
Introduction
iPhone Users Statistics: Apple’s iPhone has become a cornerstone of the global smartphone market, renowned for its premium design, strong brand loyalty, and deep integration within the Apple ecosystem. Since its 2007 debut, the iPhone has cultivated a vast and diverse user base worldwide. This report explores key iPhone user statistics, including demographics, geographic distribution, market share, usage patterns, and purchasing behavior.
By analyzing current trends and historical data, the report offers valuable insights into consumer preferences and mobile technology adoption, serving as a strategic resource for businesses, developers, and industry stakeholders seeking to navigate the evolving digital landscape.
Editor’s Choice
- Over 1.382 billion people worldwide are active iPhone users today.
- Apple shipped approximately 151.3 million iPhones between the first quarter (Q1) and the third quarter (Q3) of 2024.
- iPhones account for 53% of all smartphone sales within the United States market.
- In Q3 2024, 4 out of the top 10 best-selling smartphone models were iPhones.
- The U.S. alone is home to 155 million iPhone users.
- Globally, the iPhone holds a 27.73% market share of the smartphone market.
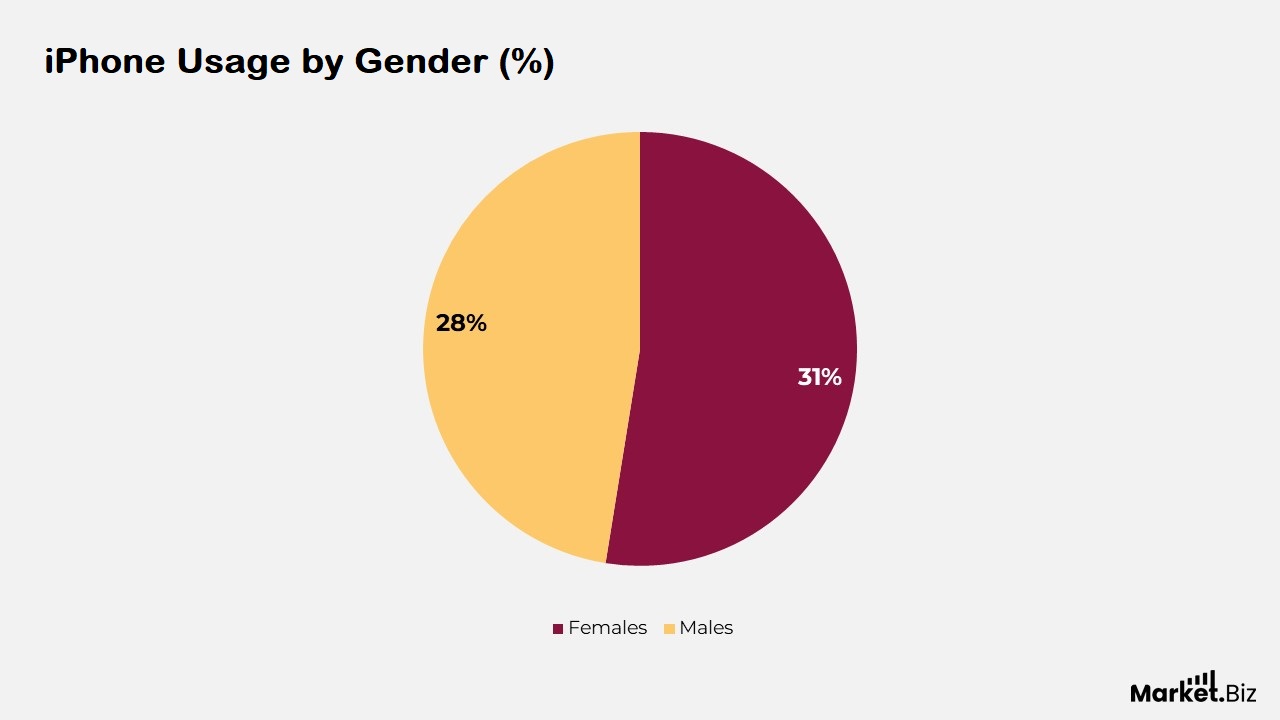
- Among iPhone users, 31% identify as female, while 28% are male.
- Apple’s iPhone sales brought in $39.3 billion during Q3 2024 alone.
- Roughly 23% of iPhone users are in the 25–34 age group.
- A significant 44% of iPhone users fall within the 16–24 age bracket.
- The global smartphone market includes an iPhone share of over 27.39%.
- Within the U.S., iPhone commands a dominant 57.59% market share.
- Total iPhone revenue reached approximately $201.1 billion, underscoring its robust market performance.
General iPhone Statistics
- A report by Demand Sage projects that by 2024, the number of iPhone users will surpass 1.56 billion.
- As of January 2024, the iPhone holds a 29.19% global market share.
- In 2024, approximately 143 million iPhone users were recorded in the United States.
- In 2023, iPhone sales decreased compared to the previous year, with a total of 231.3 million units sold.
- The Americas region led in iPhone sales, accounting for 98.1 million units.
- Other regions’ sales in 2023 include China (43.7 million), Japan (14.6 million), Europe (56.8 million), and Rest of Asia Pacific (17.8 million).
- The market share distribution across countries in 2024 is as follows: China, at 22.37%; the U.S., at 61.3%; and India, at 4.02%.
- According to Apple Statistics, iPhone sales average 35,393 units per hour, 849,450 units per day, 590 units per minute, and 10 units every second.
- Demand for the iPhone 15 surged by 253% in China as of 2023.
- Shipments of the iPhone 15 Pro Max have increased by 35% to 40% in 2023.
(Source: DemandSage, Kooc Media Ltd., Coolest-Gadgets, Apple)
Global Number of iPhone Users
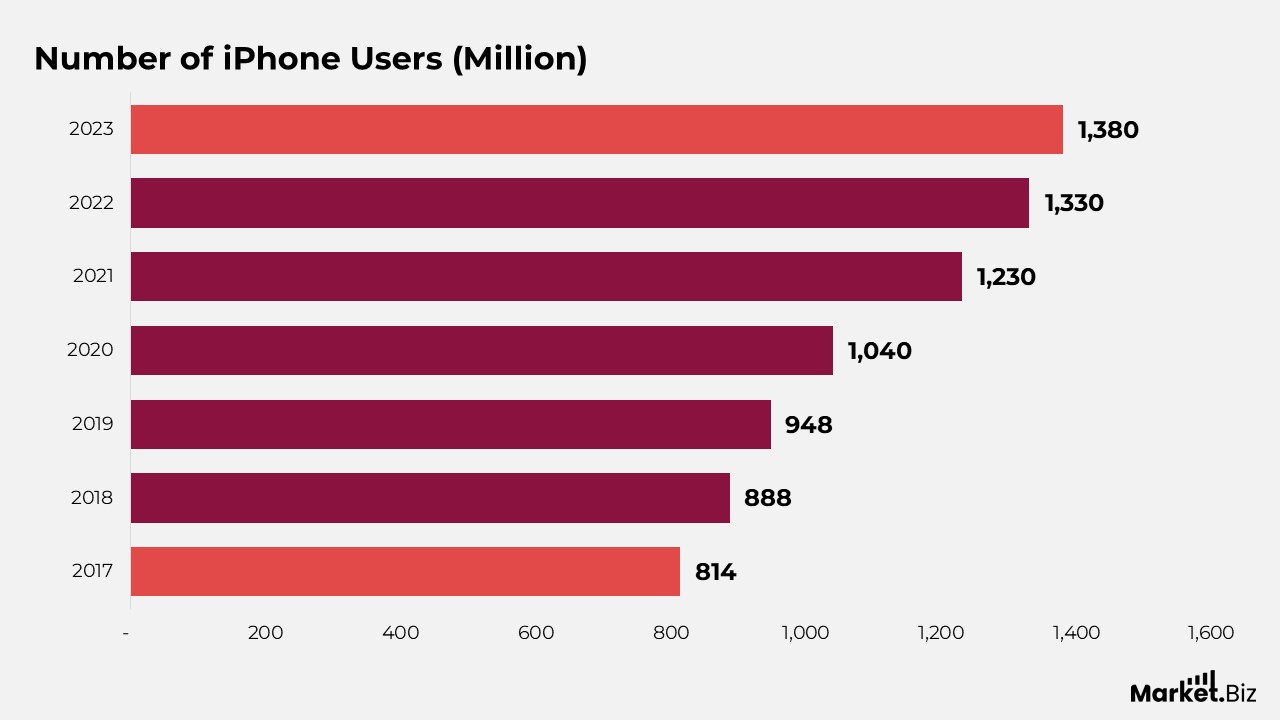
- The global iPhone user base has reached 1.38 billion, marking a growth of more than 1.05 billion users compared to figures from ten years ago.
- In 2023, the number of iPhone users worldwide reached 1.38 billion.
- In 2022, Apple had approximately 1.33 billion iPhone users.
- The iPhone user base grew to 1.23 billion in 2021.
- In 2020, the global number of iPhone users totalled approximately 1.04 billion.
- The number of iPhone users stood at 948 million in 2019.
- In 2018, there were approximately 888 million iPhone users.
- The iPhone user count in 2017 was about 814 million.
(Source: Statista, DemandSage, Semrush Inc., Backlinko)
Smartphone Market Size
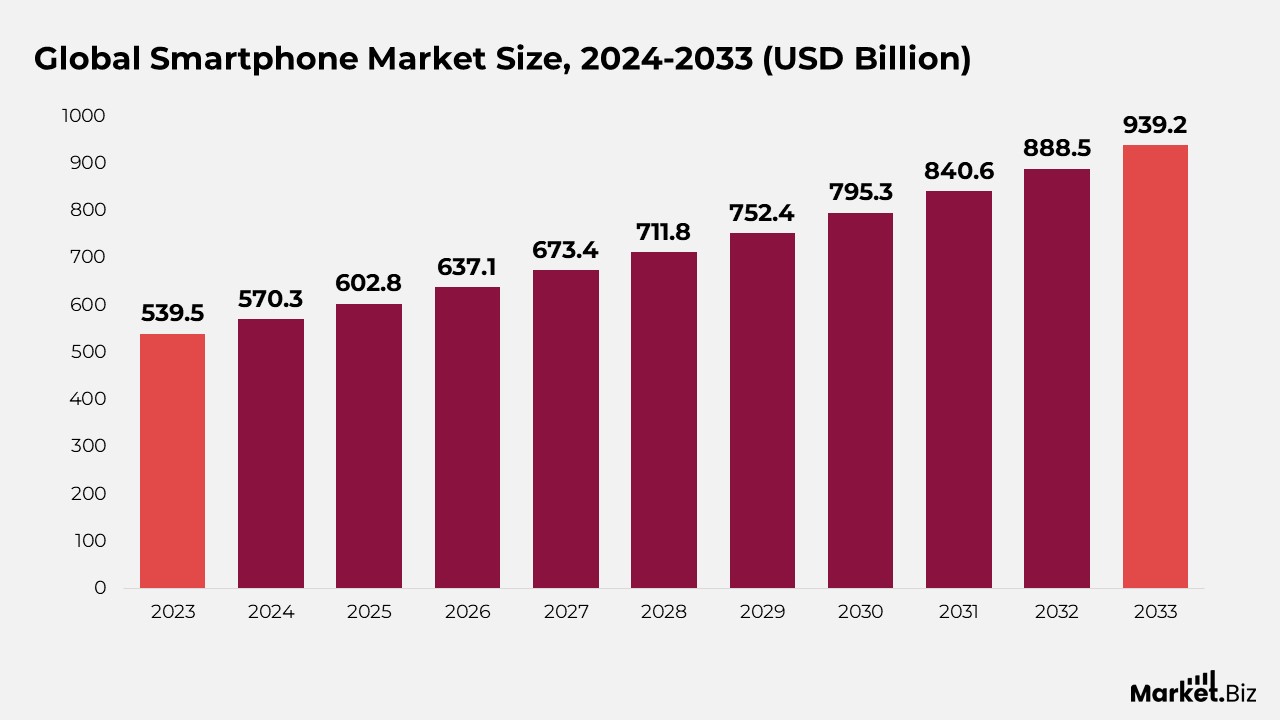
- According to Market.us, the smartphone market is projected to grow from $570.3 billion in 2024 to $939.2 billion by 2033, representing a compound annual growth rate (CAGR) of 5.7% from 2024 to 2033.
- Market growth is driven by technological advancements, increasing demand for connectivity, and the expanding adoption of smartphones in developing regions.
- The smartphone market is segmented by operating system, with Android leading at 63.4% due to its open-source platform and flexibility.
- Distribution is categorized into OEM stores, retailers, and e-commerce, with OEM stores holding the largest share at 47.6%.
- North America dominates the smartphone market, accounting for a 42.6% share, valued at USD 229.83 billion, driven by premium demand, the rollout of 5G, and a strong brand presence.
- 5G adoption is expected to rise significantly, with 45% of the projected 5.3 billion active smartphones in 2024 being 5G-ready, up from the current 15%.
- In Q1 2024, Samsung sold over 60 million smartphones, strengthening its dominant market position.
- Samsung’s flagship models, including the Galaxy S24 Ultra and foldables like the Z Fold 6 and Galaxy Z Flip 6, reflect its focus on AI features and advanced display technology.
- Despite Samsung’s lead, competition is intense. Xiaomi saw a 27.4% increase in shipments during the same period, highlighting the pressure on brands to innovate.
(Source: Market.us)
Cell Phone Charger Market
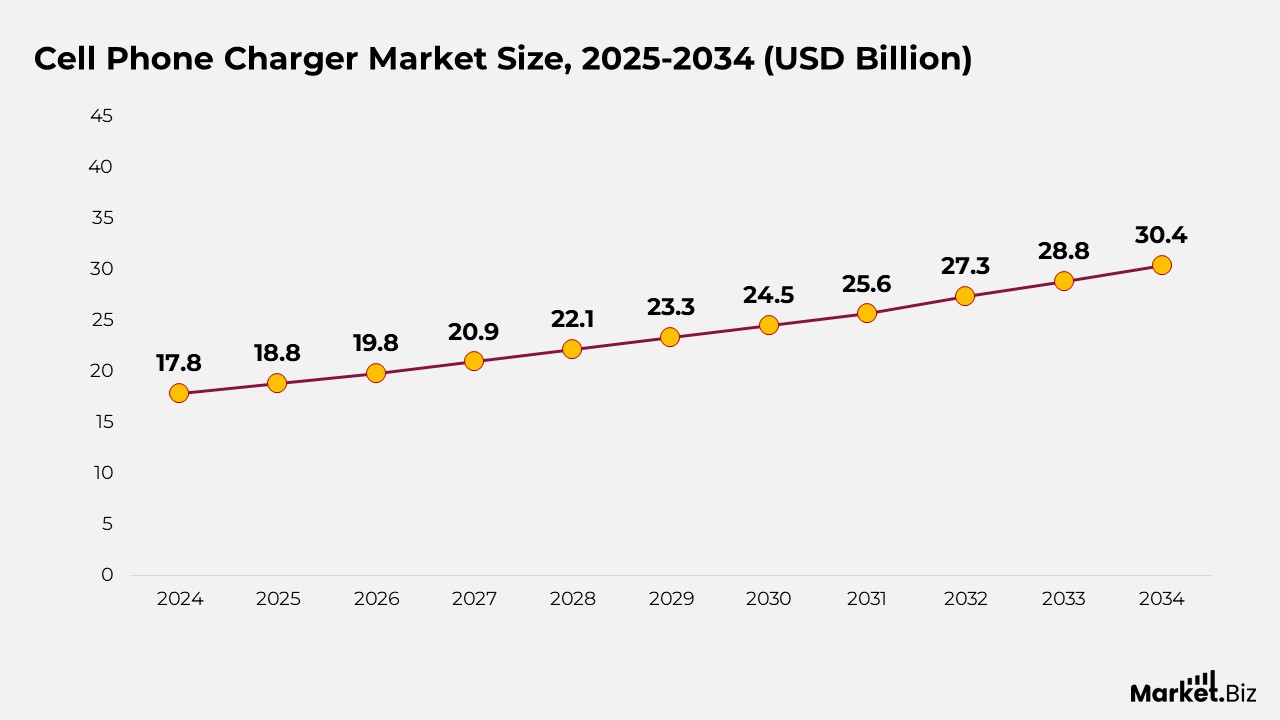
- According to Market.us, the cell phone charger market is projected to grow from $18.8 billion in 2025 to $30.4 billion by 2034, representing a compound annual growth rate (CAGR) of 5.5% from 2025 to 2034.
- The growing global penetration of smartphones is driving demand for fast and efficient charging solutions, which is being boosted by innovations such as fast and wireless charging.
- In 2024, the Wired segment led the Cell Phone Charger market with over 51.0% market share, favoured for its reliability and alignment with consumer preferences.
- The offline distribution channel dominated in 2024, accounting for more than 80.0% of the market, driven by consumer preference for in-store purchases and immediate product access.
- The general charger segment captured over 52.0% of the market by application in 2024, reflecting strong demand for basic, universally compatible charging options.
- The Asia-Pacific region led the global market in 2024, holding a 41.4% share valued at approximately USD 7.3 billion, driven by high population density and increasing mobile device usage in key countries.
- According to Ugreen, optimal battery health practices are shaping the Cell Phone Charger Market, recommending that lithium-ion batteries be kept between 20% and 80% charged for peak efficiency.
- Modern chargers are now designed to automatically stop at 100%, preventing battery degradation and avoiding deep sleep states triggered by charge levels below 2%–3%.
- Industry guidelines now advise charging devices to a starting level of 30%–40% and unplugging them around 80%, which enhances battery life, especially in environments maintained between 0°C and 35°C to avoid thermal stress.
(Source: Market.us)
Global iPhone Shipment Trends
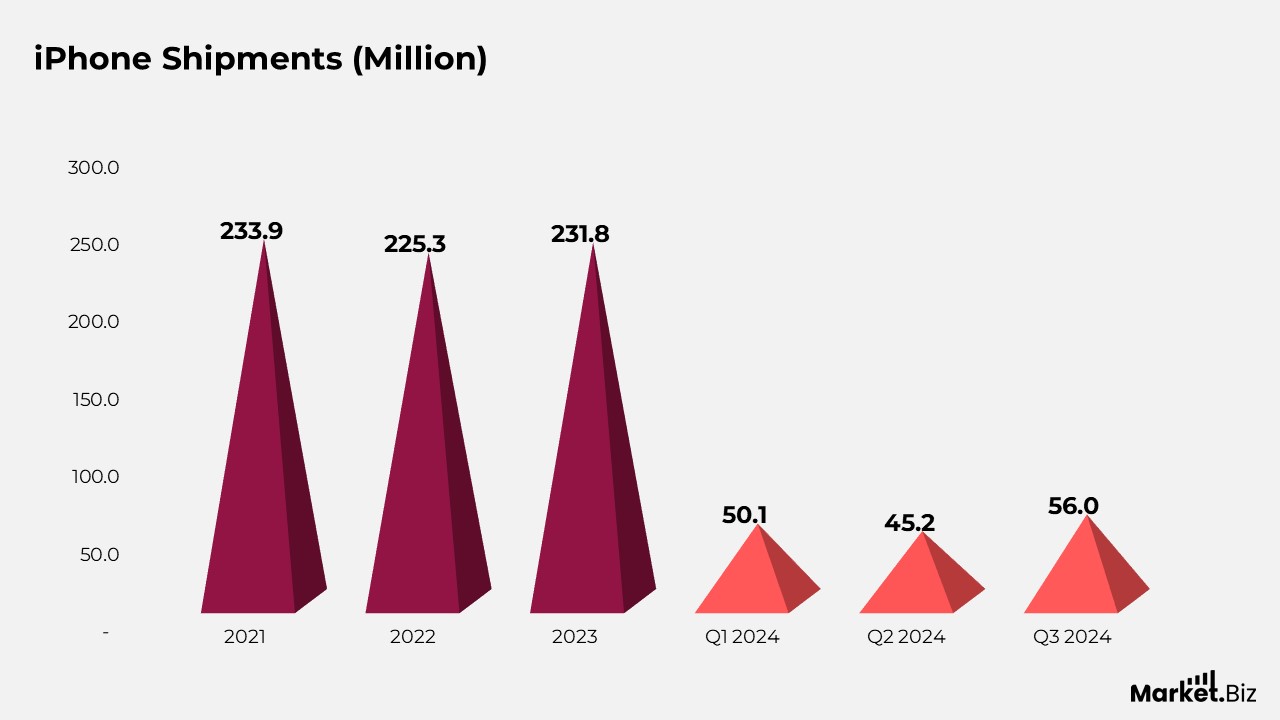
- Apple shipped 151.3 million iPhones during the first nine months of 2024, maintaining the same volume as the 151.3 million units shipped in Q1–Q3 2023, indicating stable year-over-year performance.
- In 2021, Apple shipped approximately 233.9 million iPhones worldwide.
- The total number of iPhone shipments in 2022 was approximately 225.3 million units.
- By 2023, iPhone shipments had risen to approximately 231.8 million devices.
- During Q1 2024, Apple shipped roughly 50.1 million iPhones.
- In Q2 2024, iPhone shipments reached approximately 45.2 million units.
- Apple recorded 56 million iPhone shipments in Q3 2024.
(Source: Semrush Inc, Backlinko, Statista, International Data Corporation)
App Availability on iPhone vs. Android
- The App Store for iPhone users offers approximately 1.55 million apps for download.
- The Google Play Store, available to Android users, offers approximately 1.68 million apps for download.
(Source: Statista, Semrush Inc., Backlinko)
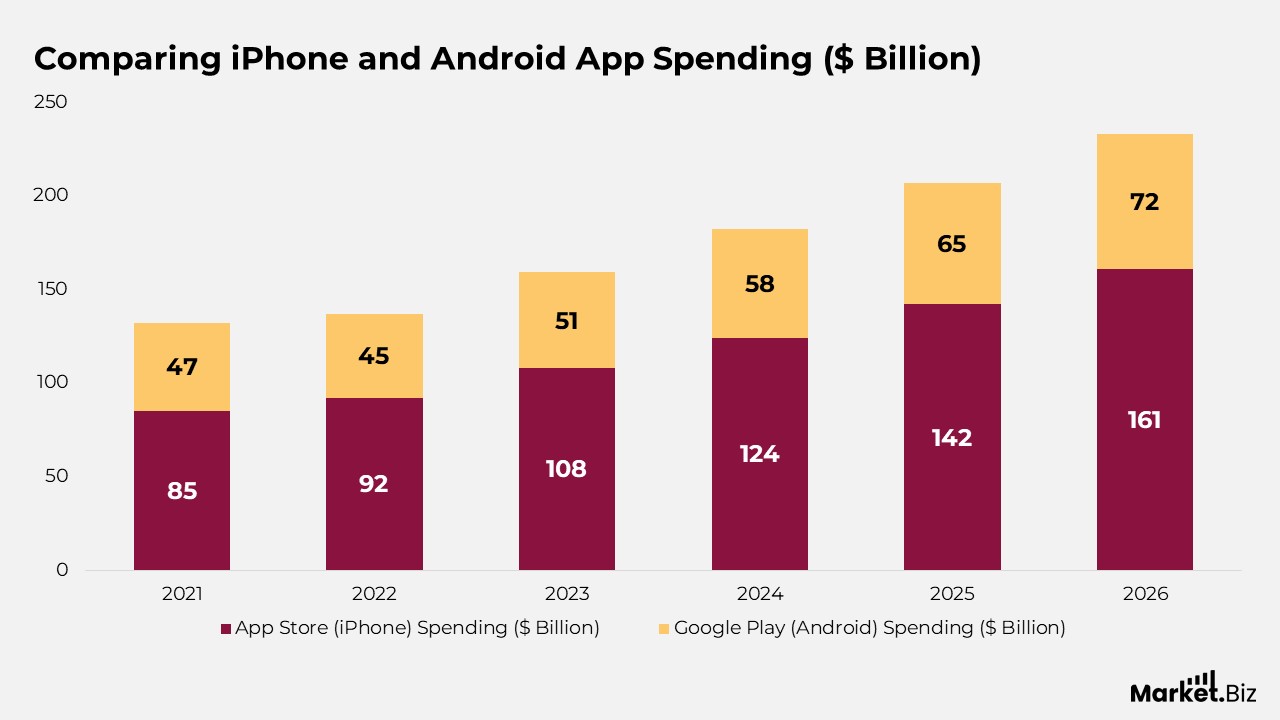
Comparison of iPhone and Android App Spending
- Consumer spending on the App Store for iPhone users is projected to reach $124 billion in 2024, covering paid apps, in-app purchases, and subscriptions.
- Android users are expected to spend $51 billion on Google Play apps in 2024, including paid apps, in-app purchases, and subscriptions.
- In 2021, spending on the App Store (iPhone) reached $85 billion, while spending on Google Play (Android) totaled $47 billion.
- In 2022, spending on the App Store reached $92 billion, while Google Play saw $45 billion in revenue.
- In 2023, $108 billion was spent on the App Store, while spending on Google Play rose to $51 billion.
- Projected for 2024, App Store spending is expected to reach $124 billion, and Google Play spending is forecasted at $58 billion.
- By 2025, App Store spending is expected to reach $142 billion, with Google Play spending projected to increase to $65 billion.
- In 2026, spending on the App Store is expected to reach $161 billion, while spending on Google Play is projected to reach $72 billion.
(Source: Semrush Inc, Backlinko, Sensor Tower)
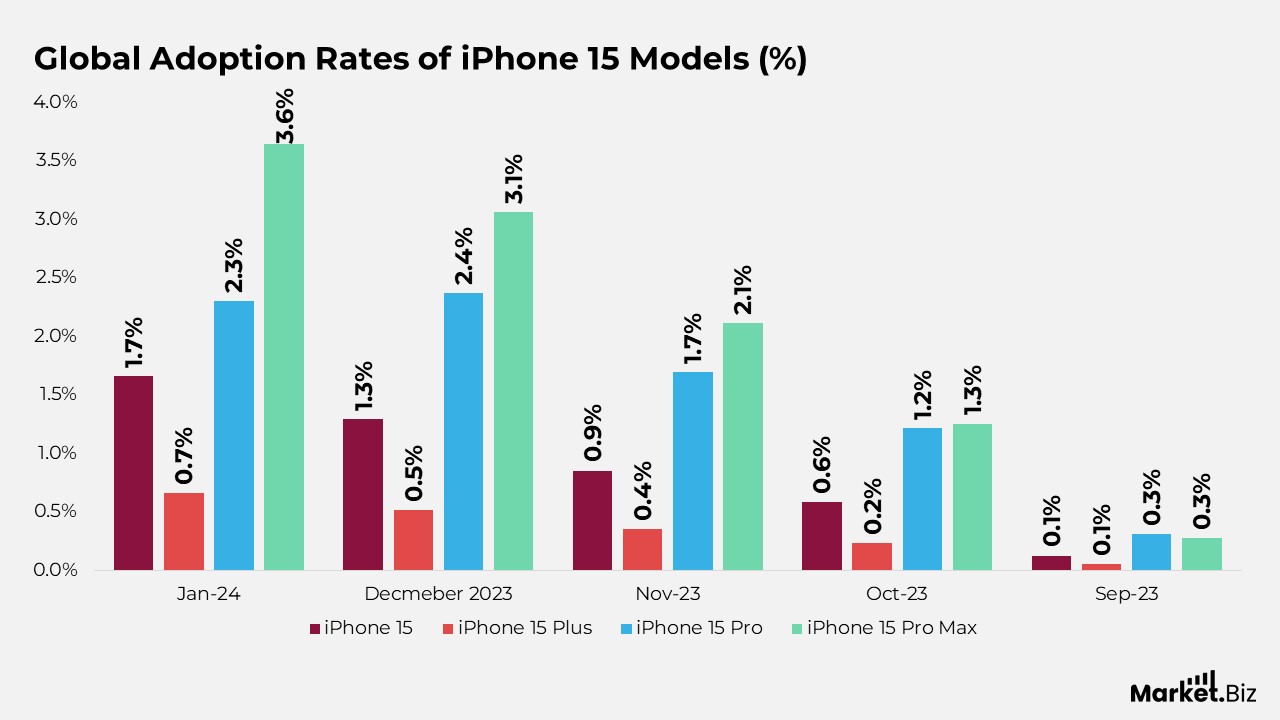
Global Adoption Rates of iPhone 15 Models
- The iPhone 15 Pro Max leads with the highest global adoption rate of 3.64%.
- The iPhone 15 Pro has a 2.3% global adoption rate.
- In January 2024, adoption rates were 1.66% for the iPhone 15, 0.66% for the iPhone 15 Plus, 2.3% for the iPhone 15 Pro, and 3.64% for the iPhone 15 Pro Max.
- In December 2023, adoption rates were 1.29% for the iPhone 15, 0.51% for the iPhone 15 Plus, 2.37% for the iPhone 15 Pro, and 3.06% for the iPhone 15 Pro Max.
- In November 2023, adoption rates were 0.85% for the iPhone 15, 0.35% for the iPhone 15 Plus, 1.69% for the iPhone 15 Pro, and 2.11% for the iPhone 15 Pro Max.
- In October 2023, adoption rates were 0.58% for the iPhone 15, 0.23% for the iPhone 15 Plus, 1.21% for the iPhone 15 Pro, and 1.25% for the iPhone 15 Pro Max.
- In September 2023, adoption rates were 0.12% for the iPhone 15, 0.05% for the iPhone 15 Plus, 0.31% for the iPhone 15 Pro, and 0.27% for the iPhone 15 Pro Max.
(Source: DemandSage, Statista)
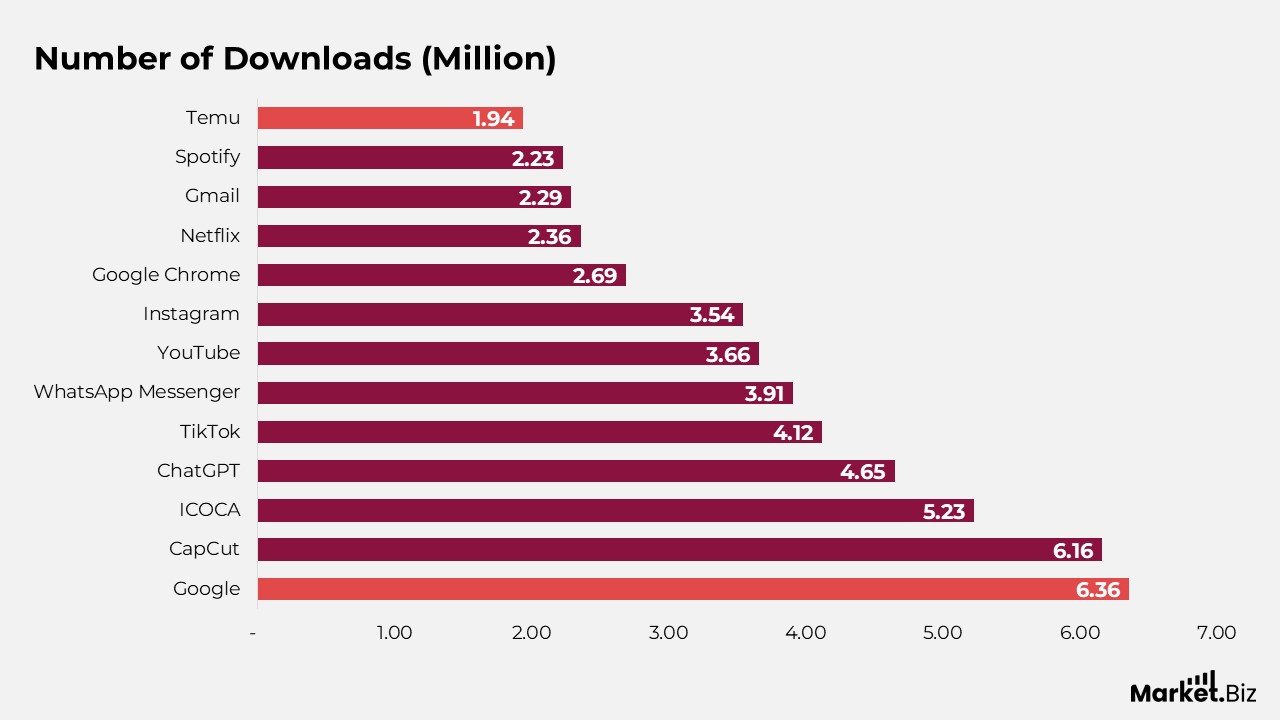
iPhone’s Most Downloaded Apps
- The Google App achieved over 6.36 million downloads on the Apple App Store.
- In June 2023, ChatGPT was downloaded 4.65 million times.
- Below are the top downloaded iPhone apps on the Apple App Store as of June 2023:
- Google led with 6.36 million downloads.
- CapCut followed closely with 6.16 million downloads.
- ICOCA garnered 5.23 million downloads.
- ChatGPT reached 4.65 million downloads.
- TikTok achieved 4.12 million downloads.
- WhatsApp Messenger saw 3.91 million downloads.
- YouTube had 3.66 million downloads.
- Instagram recorded 3.54 million downloads.
- Google Chrome was downloaded 2.69 million times.
- Netflix had 2.36 million downloads.
- Gmail was downloaded 2.29 million times.
- Spotify received 2.23 million downloads.
- Temu had 1.94 million downloads.
(Source: DemandSage, Statista)
Global iPhone App Revenue Rankings
- DouYin generated $372.08 million, making it the highest-earning iPhone app worldwide.
- TikTok followed with impressive revenue of $324.3 million.
- Piccoma secured the third spot, earning $228.32 million.
- Honor of Kings recorded revenue of $165.75 million.
- Tencent Video was nearly identical in performance, reaching $165.71 million.
- Roblox achieved strong earnings with $129.95 million.
- Honkai: Star Rail brought in $104.8 million.
- Max: Stream HBO, TV, & Movies generated $103.93 million.
- Iqiyi reported revenues of $96.54 million.
- LINE earned $93.24 million globally.
- Disney+ contributed $92.06 million in app store revenue.
- Candy Crush Saga maintained its popularity, generating $90.26 million.
(Source: DemandSage, Statista, answeriq)
Popular Smartphones Across the Globe
- iPhone 14 dominated sales with a 3.9% market share.
- iPhone 14 Pro Max followed, holding 2.8%.
- iPhone 14 Pro captured 2.4% of the market.
- iPhone 13 maintained a strong performance at 2.2%.
- iPhone 15 Pro Max accounted for 1.7%.
- iPhone 15 Pro registered 1.4%.
- iPhone 15 also secured 1.4%.
- Samsung’s Galaxy A14 5G matched with 1.4%.
- Galaxy A04e contributed 1.3%.
- Galaxy A14 4G added another 1.3%.

(Source: DemandSage, Statista, Counterpoint Research)
User Loyalty for iPhone vs. Android
- Both Android and iPhone boast impressive customer retention rates, with Android at 89-91% and iPhone at 85-88%, indicating strong brand loyalty.
- Despite high retention, some users have switched between mobile operating systems. 18% of iPhone users were previously Android users, while only 11% of Android users switched from Apple.
- The main reasons for switching include user experience and affordability
- 47% of former Android users switched to iPhone due to a better user experience, compared to just 30% of former iPhone users who felt the same about Android.
- 29% of former iPhone users switched to Android for greater affordability, while only 11% of former Android users found their new iPhone more affordable.
(Source: CIRP, PC Mag, Semrush Inc., Exploding Topics)
iPhone Usage Patterns
- The iPhone has over 1.36 billion active users worldwide, making it the most popular smartphone brand.
- Navigation apps lead in the App Store, boasting an impressive 104.5% conversion rate.
- Google is the top publisher for non-gaming apps on iPhone, while X-Hero holds the title for the most downloaded gaming app worldwide.
- In Q1 2023, iOS apps were downloaded 8.6 billion times, contributing to a total of 32.6 billion downloads for the year.
- On average, an iPhone user spends 40 hours per week on their device, equivalent to a full workweek.
- The iPhone is the most commonly owned Apple device, with 88% of users owning one, followed by the Apple Watch (58%), iPad (73%), and Mac laptop/desktop (50%).
- 92% of all iPhones are running either the latest iOS 16 (72%) or the previous version, iOS 15 (20%).
(Source: Enterprise Apps Today, Statista, MS Power User)
Demographics of iPhone Users
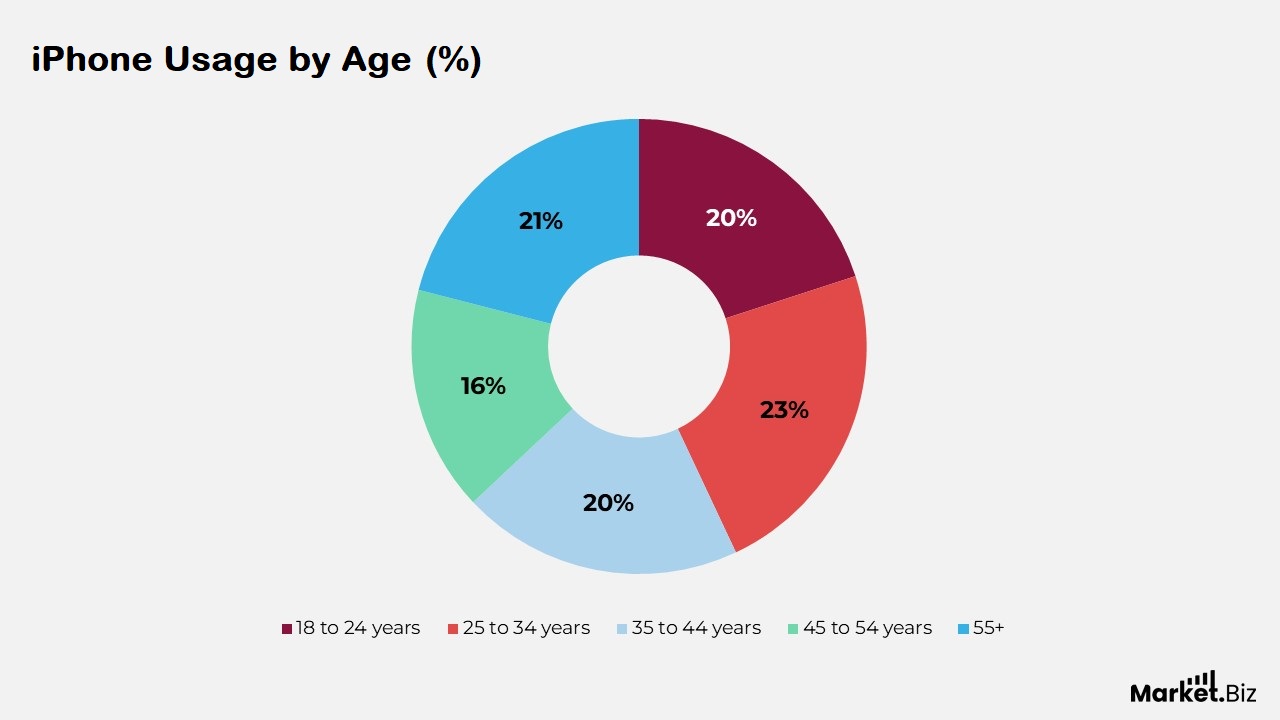
Age
- 20% of iPhone users are between 18 and 24 years old.
- 23% of iPhone users fall within the 25-34 age group.
- 20% of iPhone users are aged 35 to 44 years.
- Approximately 16% of iPhone users fall within the 45- to 54-year age range.
- 21% of iPhone users are 55 years and older.
(Source: DemandSage, ComScore)
Gender
- According to Statista, 31% of iPhone users are women, while 28% are men.
(Source: Statista, DemandSage, ComScore)
iOS Market Share by Geographic Region
- iOS dominates the North American market with a 55.53% share, making it the leading mobile OS in the region.
- In Europe, iOS holds a 31.48% market share, establishing a strong presence.
- iOS has a 27.73% global market share, reflecting its significant yet competitive position in the worldwide market.
- The mobile OS holds 16.32% of the market in South America and 19.22% in Asia, showing varied popularity across these regions.
- Oceania sees a high 51.14% market share for iOS, indicating strong adoption in the region.
- Conversely, iOS holds the lowest share in Africa, with just 12.43%, highlighting a smaller footprint in this region.
(Source: StatCounter, DemandSage)
Conclusion
The iPhone continues to dominate the smartphone market, driven by ongoing innovation, seamless integration within Apple’s ecosystem, and unwavering customer loyalty.
The popularity of newer models, such as the iPhone 15, showcases Apple’s ability to attract a diverse range of users. iPhone users also remain highly engaged with the App Store, playing a crucial role in the expansion of the digital ecosystem.
By consistently prioritizing a premium user experience, Apple ensures that the iPhone is not just a communication tool but a vital part of daily life for many consumers. With continuous technological advancements and an expanding global presence. The iPhone is set for sustained success and growth in the years to come.
FAQ’s
By 2024, the number of iPhone users globally is expected to exceed 1.56 billion.
The iPhone 15 Pro Max currently leads with the highest global adoption rate of 3.64%.
As of January 2024, the adoption rates for the iPhone 15 models are as follows:
iPhone 15: 1.66%
iPhone 15 Plus: 0.66%
iPhone 15 Pro: 2.3%
iPhone 15 Pro Max: 3.64%
In 2024, iPhone users are projected to spend $124 billion on the App Store, which includes purchases of paid apps, in-app purchases, and subscriptions.
Approximately 31% of iPhone users are female, according to recent data.
As of 2024, the iPhone holds a 57.59% market share in the U.S.
On average, 849,450 iPhones are sold per day, 35,393 units per hour, 590 units per minute, and 10 units per second globally.