
Introduction
Live Streaming Statistics: In the past decade, live streaming has evolved from a niche entertainment format into a mainstream force, redefining how audiences consume content, interact with creators, and engage with brands. Enabled by faster internet speeds, widespread smartphone usage, and increasingly interactive platforms, its scope now extends beyond gaming to include sports, music, education, corporate events, and e-commerce.
Leading platforms such as Twitch, YouTube Live, Facebook Live, and TikTok Live draw millions of viewers daily, driven particularly by younger audiences who value authenticity, immediacy, and community-driven content. These statistics present an in-depth analysis of live streaming statistics, including market size, user demographics, engagement patterns, monetization models, and platform performance, designed to help businesses, marketers, creators, and investors uncover growth opportunities and navigate the rapidly evolving global live streaming landscape.
Editor’s Choice
- More than 1 in 4 internet users tune in to live streams every week.
- Live streaming ranks as the third most popular video format, engaging 27.7% of users each week.
- The global live streaming market is valued at approximately USD 99.82 billion.
- Around 27% of live stream viewing happens on mobile devices.
- In Q1 2024, live streaming audiences were 128% larger than in Q1 2019 and 61% higher than in Q1 2020.
- During Q2 2024, viewers consumed a combined 8.5 billion hours of live-streamed content.
- By 2026, over half of the U.S. population is projected to watch content from at least one ad-supported streaming platform each month, with 55.8% of U.S. internet users viewing through AVOD services.
- Around half of all new Disney+ subscribers choose the ad-supported plan over the ad-free option.
- Nearly 60% of pay-TV users either enjoy or are indifferent to advertisements during their viewing sessions.
- In the U.S., 54% of internet users maintain subscriptions to four or more OTT video platforms, while 20% pay for eight or more.
- In 2024, brands invested USD 30.10 billion in streaming ads, compared with USD 60.56 billion spent on traditional television advertising.
General Video Streaming Statistics
- Around 60% of young adults in the U.S. primarily watch TV through online streaming platforms.
- The share of Americans using satellite or cable TV dropped from 76% in 2015 to 56% in 2021.
- U.S. adults now spend close to 6 hours daily watching video content, an 11-minute increase from the previous year, with 6 minutes of that growth coming from TV-connected devices.
- In 2023, 83% of U.S. households subscribed to paid video services such as Netflix or Hulu.
- By 2024, half of all online video viewers will use an ad-supported streaming service, whether free or paid.
- Millennials remain the largest connected TV (CTV) user group at 62 million, followed by 35.8 million Baby Boomers, 51.6 million Gen X viewers, and 52.8 million Gen Z viewers.
- Viewers are 39% more likely to share content when it’s delivered in video format.
- Nearly 48% of consumers have shared a brand’s video on social media, helping retailers expand their reach through existing customers.
- About 80% of marketers consider video across TV, digital, social, and OTT an increasingly essential channel.
Further
- Video content could account for up to 90% of all 5G network traffic.
- Nearly 29% of consumers are willing to pay more if 5G delivers better video quality and reduced buffering.
- Interactive video ads drive 47% more engagement time and are 32% more memorable than standard ads.
- Most viewers will abandon a poor-quality stream within 90 seconds.
- Streaming now makes up 26% of total TV viewing time.
- U.S. CTV ad spending is projected to hit USD 36 billion by 2026.
- About 68% of Americans (233 million people) use a connected TV.
- Over half (54%) of U.S. internet users subscribe to at least four OTT services, with 20% paying for eight or more.
- In Q4 2023, TVs captured 58% of spending on streaming ad inventory bought via traditional deals, while phones and tablets held 32%, and desktops/laptops took 10%.
- Ad spending on platforms like Hulu and Max grew by 10% year over year in Q4 2023.
- For streaming ad inventory bought through real-time bidding in Q4 2023, mobile devices led spending, with TVs at 27% and computers at 22%.
- In 2024, brands invested USD 30.10 billion in streaming ads, compared with USD 60.56 billion for traditional TV advertising.
- The U.S. has approximately 115 million connected TV households.
(Source: Tinuiti, Statista)
Live Streaming Pay-Per-View Market Size
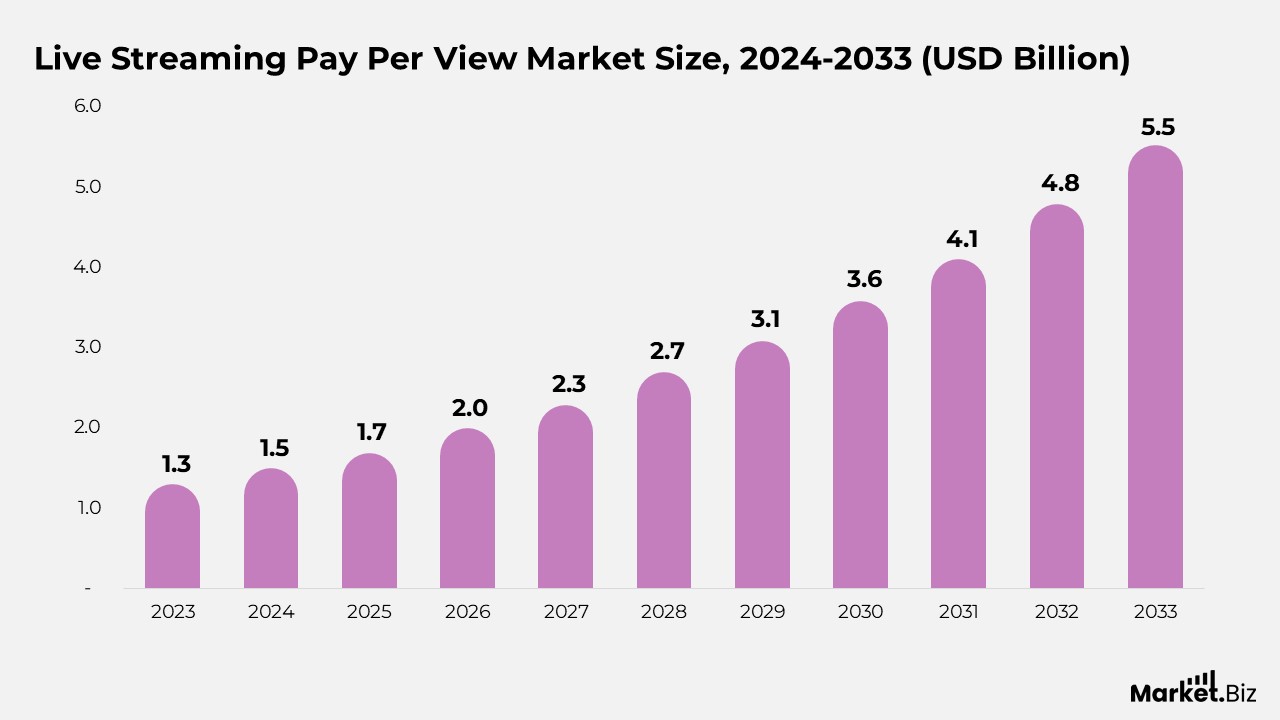
- According to Market.us, the live streaming pay-per-view market is anticipated to rise from $1.5 billion in 2024 to $5.5 billion by 2033, representing a compound annual growth rate (CAGR) of 15.50% from 2024 to 2033.
- The market’s expansion is propelled by surging demand for digital content and the worldwide transition toward online consumption, further supported by the widespread use of smartphones and cost-effective mobile data plans.
- Enhanced internet infrastructure and cutting-edge streaming solutions are delivering superior, on-demand viewing experiences, bolstered by the rollout of 5G networks and advancements in content delivery networks (CDNs).
- In 2023, the Media & Entertainment sector claimed a commanding 34.3% market share, fueled by high demand for exclusive live broadcasts such as concerts, movie premieres, and award ceremonies, alongside the growing subscriber base of OTT platforms.
- North America secured the leading position in 2023 with a 37.1% share, translating to USD 0.48 billion in revenue, driven by a strong appetite for live-streamed sports, entertainment, and media events.
Moreover
- The region’s dominance stems from substantial investments in streaming innovation, a large base of digitally adept consumers, and the enduring appeal of major sports leagues like the NFL and NBA, as well as large-scale music events.
- The sports vertical generated USD 450 million in 2023, powered by premium broadcasting rights, interactive fan engagement, and the growth of virtual event ticketing.
- The entertainment segment contributed USD 650 million, benefiting from blockbuster launches, live award galas, and artist-led streaming performances.
- The education industry added USD 100 million in 2023, underpinned by the rising integration of remote learning tools and virtual classrooms.
- Regionally, North America led with 40% market share (USD 600 Million), followed by Asia-Pacific (USD 400 Million), driven by accelerating internet access, Europe (USD 300 Million), supported by a thriving esports scene, and Latin America (USD 100 Million), propelled by growing streaming adoption.
(Source: Market.us)
Livestream E-Commerce Market Size
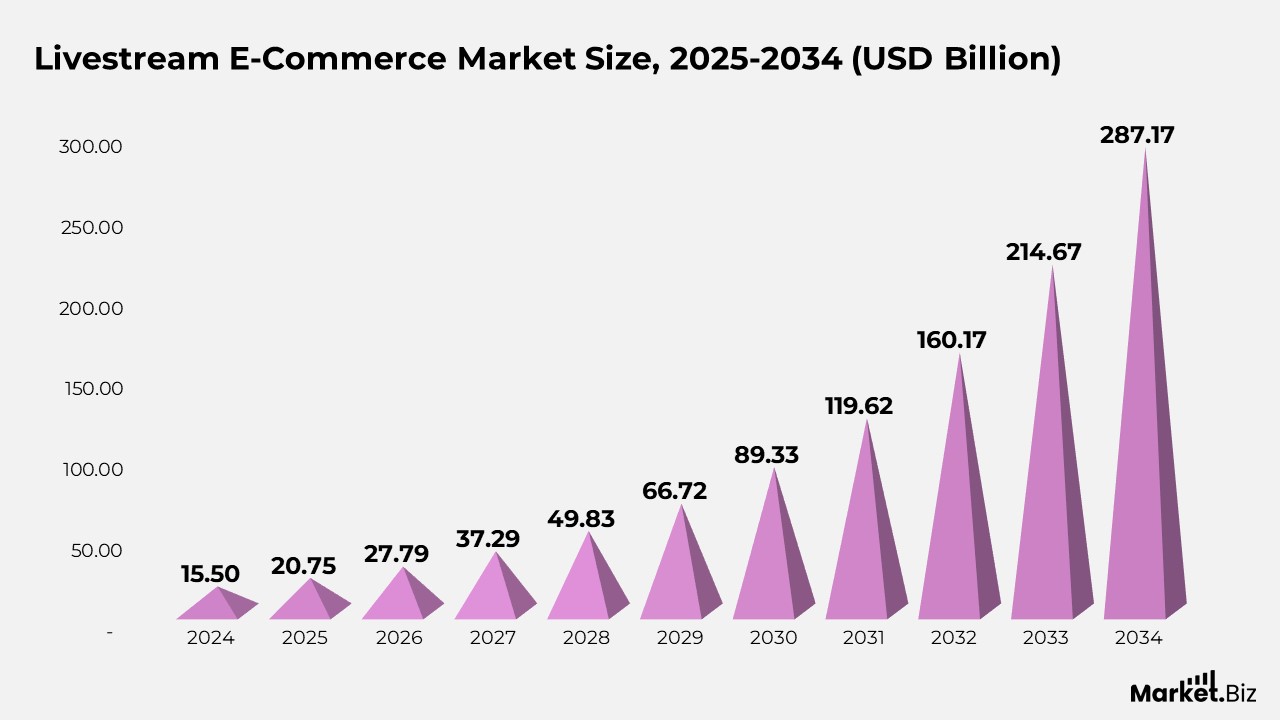
- According to Market.us, the livestream e-commerce market is anticipated to rise from $20.75 billion in 2025 to $287.17 billion by 2034, representing a compound annual growth rate (CAGR) of 33.9% from 2025 to 2034.
- Fashion & Apparel led the livestream e-commerce market in 2024 with a 28% share, driven by its strong alignment with the interactive and visual nature of livestream shopping.
- Social Media Platforms dominated in 2024 with a 44.3% share, benefiting from their vast reach, engagement tools, and integrated shopping features.
- Market growth is fueled by strong appeal to younger demographics, high conversion rates, and the ability to deliver real-time product demos with personalized shopping experiences.
- Asia-Pacific (APAC) captured 66.7% of the global livestream e-commerce share in 2024, generating USD 0.1 billion, supported by advanced digital ecosystems and high mobile commerce adoption.
- Livestream e-commerce has grown rapidly, with live selling up 76% since COVID-19, driven by shifting consumer habits, rising digital engagement, and social commerce influence.
- The U.S. livestream e-commerce market is projected to hit USD 35 billion in 2024, reflecting its accelerating adoption and commercial potential.
(Source: Market.us)
Live Streaming for Marketing and Business
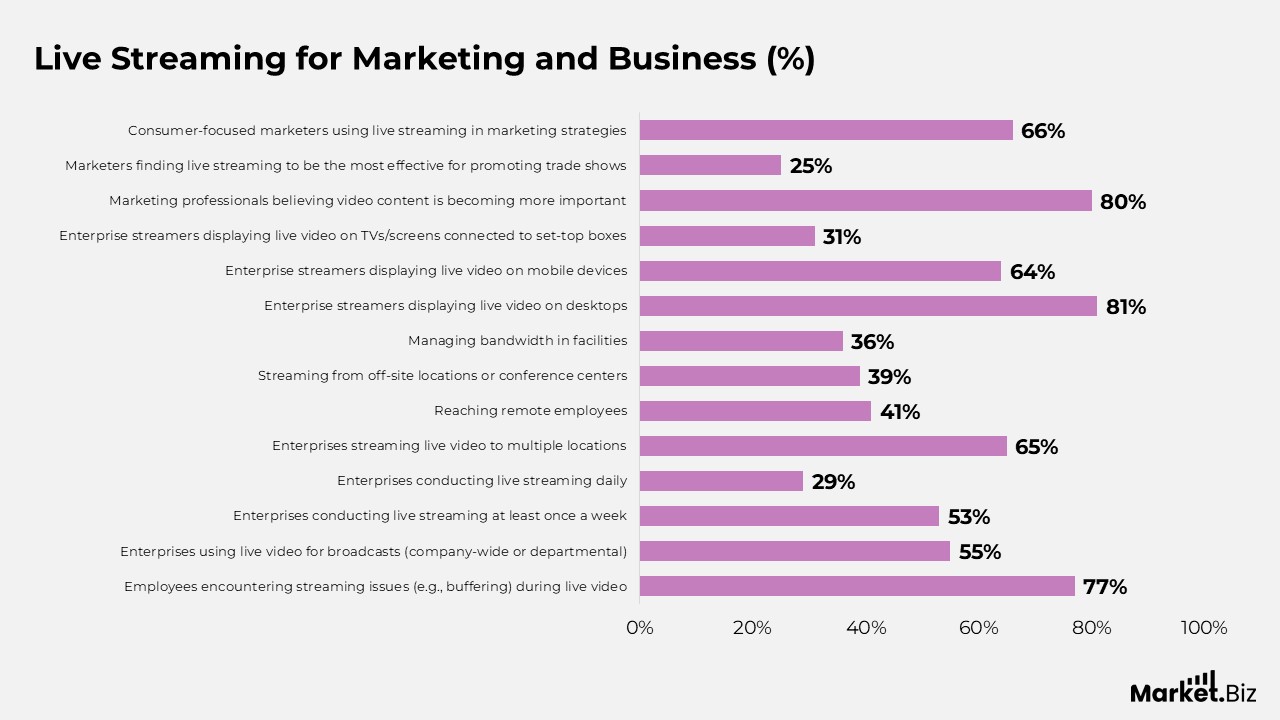
- Around 77% of employees have encountered streaming issues, such as buffering while watching live video at work.
- As of 2024, 55% of enterprises use live video for company-wide or departmental broadcasts.
- More than half (53%) of enterprises conduct live streaming within their organization at least once a week, with 29% doing so daily.
- 65% of enterprises stream live video to multiple locations.
- The main challenges for enterprise live streaming include reaching remote employees (41%), streaming from off-site locations or conference centers (39%), and managing bandwidth in facilities (36%).
- 81% of enterprise streamers display live video on employee desktops, 64% on mobile devices, and 31% via TVs or screens connected to set-top boxes.
- About 80% of marketing professionals believe video content is becoming increasingly important in business.
- Live video campaigns can double engagement rates in influencer marketing compared to standard video content.
- Nearly one in four marketers finds live streaming to be the most effective method for promoting trade shows.
- Two-thirds of consumer-focused marketers incorporate live streaming into their marketing strategies.
- Brands are projected to spend over USD 100 billion on video content by 2023.
- Using video content has helped reduce the number of customer support calls by 43%.
- In 2020, Facebook Live usage in marketing strategies grew by approximately 32% among businesses already using video content.
(Source: streaming Media, Wainhouse Research, 4CInsights, RhythmOne, The Social Effect, Content Marketing Institute, Forrester, Wyzowl)
Live Video Monetization Statistics
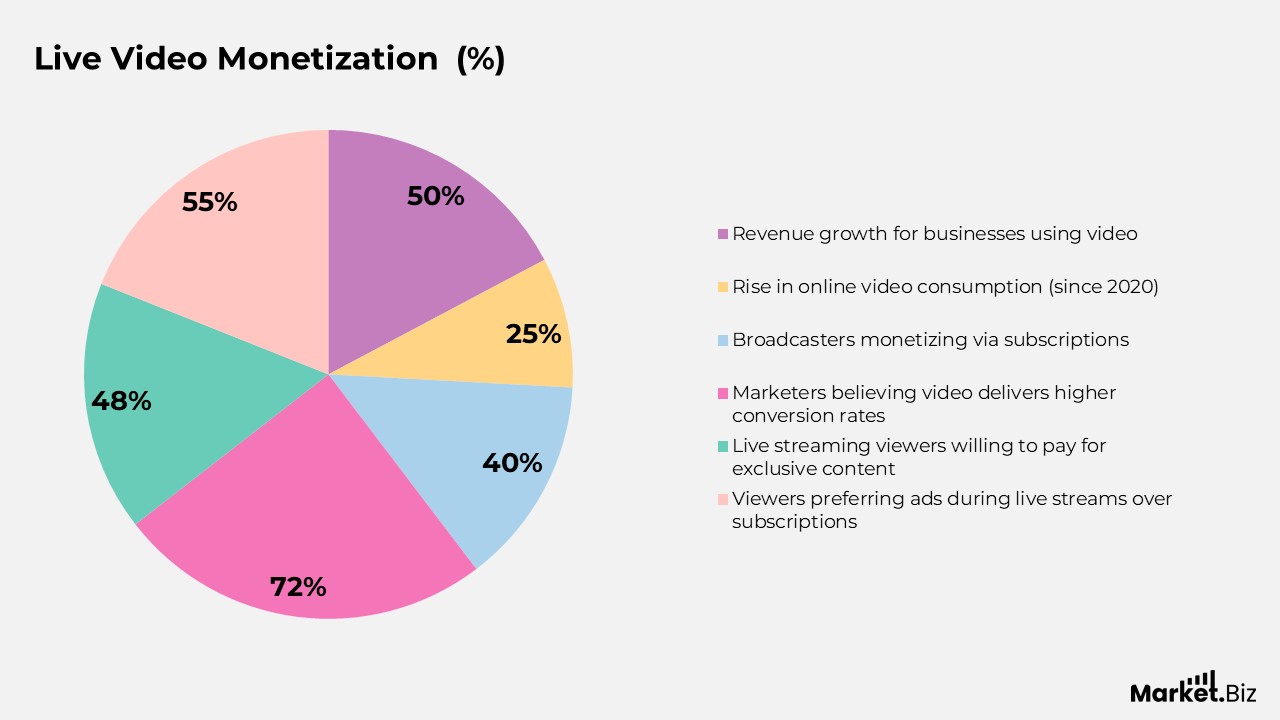
- Businesses integrating video features report revenue growth rates up to 50% higher than those not using video, highlighting its growing influence on business performance.
- Traditional home entertainment spending has steadily declined, while online video consumption has risen by more than 25% per year since 2020.
- By 2025, at least 20 countries are projected to generate over USD 1 billion annually from video streaming, showcasing the market’s global expansion.
- Streaming video advertising revenue is expected to reach USD 60 billion by 2025, fueled by the growth of FAST channels and ad-supported video-on-demand (AVOD) models.
- Over 40% of professional broadcasters now monetize content through subscription models, with hybrid AVOD-SVOD approaches gaining popularity.
- Approximately 72% of marketers believe video delivers higher conversion rates than other types of content.
- Nearly 48% of live streaming viewers say they would pay for exclusive live content from preferred creators, sports organizations, or events.
- Global subscription video-on-demand (SVOD) subscriptions surpassed 530 million by the end of 2024, reflecting continued rapid adoption.
- SVOD revenue is forecasted to grow at a CAGR of 11% through 2026, reaching an estimated market value of USD 95 billion.
- More than 55% of viewers prefer watching ads during live streams over paying a subscription fee for ad-free access.
(Source: MoffettNathanson Video Trends Report, eMarketer Digital Video Report, Omdia Regional Streaming Revenue Study, Video Advertising Forecast, Omdia Broadcaster Monetization Survey, MoffettNathanson Marketing Trends, Omdia Consumer Live Video Survey, MoffettNathanson Consumer Preferences Study)
Live Streaming Industry Trends
- Over one-fourth of viewers access live streams from multiple social media platforms, with 26% using Facebook, 15% using Snapchat, 13% using Instagram, and another 13% using Twitter.
- As of June 2020, about 79% of U.S. households used either paid or ad-supported streaming services, up from 76% just six months earlier.
- Roughly one in five consumers discover new brands and products through social media live streaming.
- Around 39% of sports fans watch their favourite teams and events via live streams on social media platforms.
- In May 2020, about 29% of internet users engaged with live streaming features on their preferred social media channels.
- While social media live streaming initially appealed to younger audiences, it is steadily gaining traction among older generations.
- In sports live streaming, nearly one-quarter of viewers interact by posting comments during live events.
- Live streaming on LinkedIn Live grew in popularity by 158% between the first and third quarters of 2020.
- Live videos on LinkedIn generate significantly higher engagement than pre-recorded content, averaging 7x more reactions and 24x more comments.
- Only 3% of marketers currently use LinkedIn’s live streaming feature.
- Around 28% of Facebook users watch at least one live stream on the platform each month.
Moreover
- In 2018, MLB partnered with Facebook to stream 26 games, which attracted over 123 million views.
- About 13% of live streaming viewers on social media use Instagram.
- Instagram’s “Live” feature saw usage grow by 70% in April 2020.
- Around 17% of digital marketers include Instagram Live in their content strategies.
- Fewer than 10% of marketers use YouTube Live as part of their marketing efforts.
- About one-quarter of TikTok users tuned into a live stream on the platform in June 2020.
- Nearly 48% of Gen Z adults use TikTok daily.
- 52% of viewers prefer free, ad-supported live streaming options.
- In 2019, internet users collectively watched around 1.5 million years of live streaming content.
- By the end of 2021, live video content accounted for 13.2% of global internet traffic.
- 80% of viewers enjoy watching live videos from verified creators, such as brands, over reading blogs.
- 82% of viewers favor live streaming over social media posts and text-based content.
- Viewers spend 10 to 20 times longer watching live streams compared to on-demand videos.
- 67% of viewers who watched a live broadcast event went on to purchase a ticket for a similar event in the future.
(Source: GWI Social Video Report, Think with Google, GWI Social Media Trends Report, GWI Live Streaming Infographic, Social Media Examiner, Business Insider, Digital Information World, Morning Consult, Forrester, AffiliateBooster Media)
AI Integration and Monetization Shaping the Live Streaming Landscape
- Over 60% of broadcasters now use AI in live streaming tools for tasks such as content tagging, automated captioning, and moderation.
- AI-powered virtual humans, or “AI streamers,” are becoming increasingly popular, particularly in gaming, Asian markets, and live commerce platforms.
- Machine learning supports real-time adaptive bitrate streaming, enhancing playback quality and reducing latency during live broadcasts.
- FAST channels grew by 35% globally in the past year, driven by the rise of cord-cutting and growing demand for free, ad-supported content.
- Leading FAST platforms, including Pluto TV and Roku, are expanding their reach through ad-supported video-on-demand (AVOD) models.
- Hybrid monetization models joining FAST’s ad-supported approach with microtransactions are gaining momentum, merging AVOD and subscription-based (SVOD) strategies with premium transactional elements to increase revenue.
(Source: Gumlet, Exploding Topics, DemandSage, UniqCast/PwC)
Conclusion
The live streaming market is undergoing rapid expansion, fueled by shifting consumer habits, technological innovation, and the seamless blend of interactive shopping with entertainment. Leading categories like fashion & apparel and social media platforms dominate thanks to their high visual appeal and ability to deliver engaging, real-time experiences.
Asia-Pacific emerges as the frontrunner, leveraging advanced digital infrastructure and widespread mobile commerce adoption. By combining entertainment with commerce, live streaming is redefining digital interaction and solidifying its role as a cornerstone of the global e-commerce and media landscape.
FAQ’s
The live streaming industry is expanding rapidly, fueled by rising demand for real-time, interactive content and the growing convergence of e-commerce with entertainment experiences.
Fashion & Apparel and social media platforms hold the leading positions, driven by their strong visual appeal, ability to engage audiences, and suitability for live product demonstrations.
Asia-Pacific leads the global market, supported by robust digital infrastructure, widespread mobile commerce adoption, and high consumer engagement with interactive streaming content.
Major growth drivers include improved internet connectivity, increased mobile device penetration, real-time audience engagement, and the integration of shopping within live content.
Live streaming is transforming e-commerce by offering real-time product presentations, personalized shopping experiences, and higher conversion rates through immersive and interactive formats.