Introduction
Food Packaging Statistics: plays a crucial role in safeguarding and maintaining food quality, ensuring safety, and delivering essential information. It encompasses various categories, including primary (which comes into direct contact with food). Secondary (which groups primary packages), and tertiary (which is used for bulk handling). The materials typically utilized include glass, plastic, metal, and paper, each providing unique advantages.
Methods such as vacuum packaging and modified atmosphere packaging help to prolong shelf life. While regulatory standards guarantee safety and precise labeling. Among rising concerns regarding sustainability, there is an increasing emphasis on recyclable, biodegradable, and minimalist packaging options.
The main factors driving this trend include a growing demand for convenience, population expansion. The surge in food delivery services and the pursuit of sustainable, high-performance materials.
Paper and cardboard, flexible plastics, and rigid plastics are the primary materials in use, yet continuous innovation is directed towards biodegradable alternatives, smart packaging solutions, and meeting consumer expectations for safety and user-friendliness.
Editor’s Choice
- The worldwide revenue for the food packaging market is anticipated to reach USD 592.8 billion by the year 2032.
- The global food packaging market is anticipated to witness steady growth in the upcoming years, with a compound annual growth rate (CAGR) of 5.30%.
- In 2021, the market revenue was noted at USD 118 billion.
- In 2019, the Asia-Pacific region dominated the market with a revenue of $28.16 million, followed closely by Europe at $26.73 million and North America at $26.55 million.
- The Asia-Pacific (APAC) region is at the forefront of the market, representing 34.8% of the overall share.
General Food Packaging Statistics
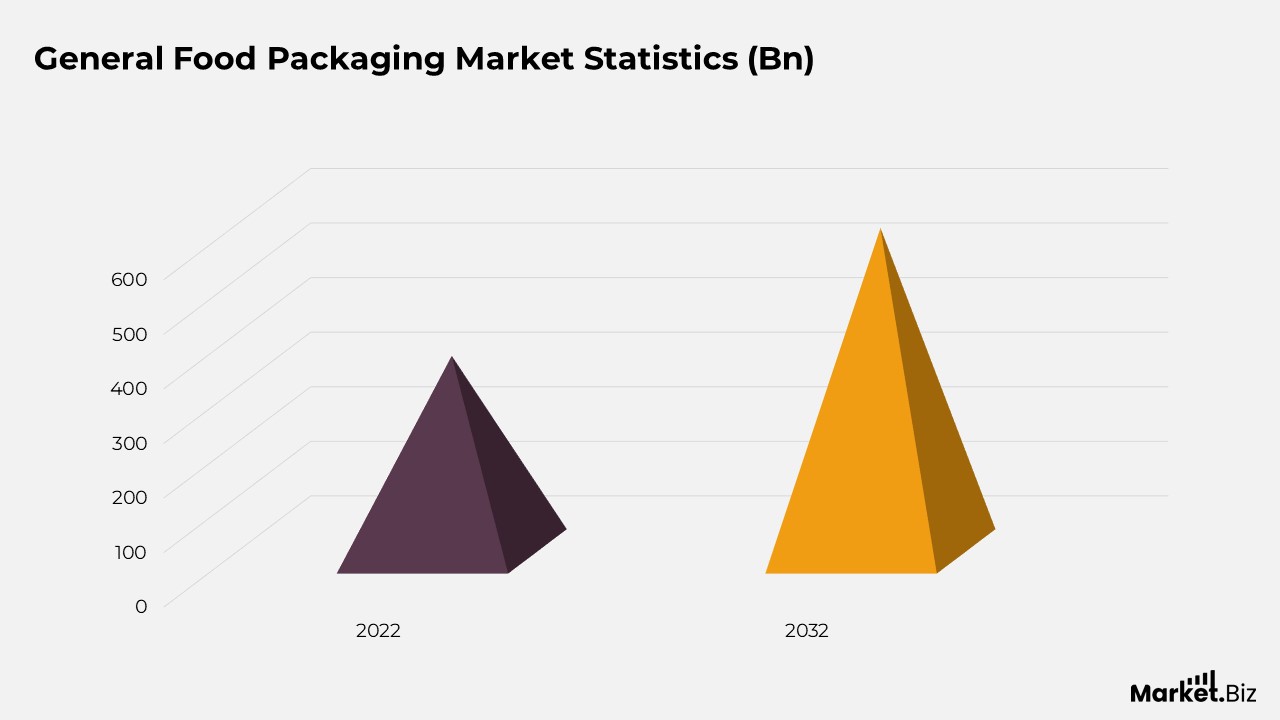
- The worldwide revenue for the food packaging market is anticipated to reach USD 592.8 billion by the year 2032.
- The global food packaging market is characterized by the presence of numerous key players, each possessing a considerable share of the market. Constantia Flexibles is at the forefront, commanding a 15% market share.
- The global food packaging market displays varying degrees of market share across different geographical regions. The Asia-Pacific (APAC) region is the leader, representing 34.8% of the overall market share.
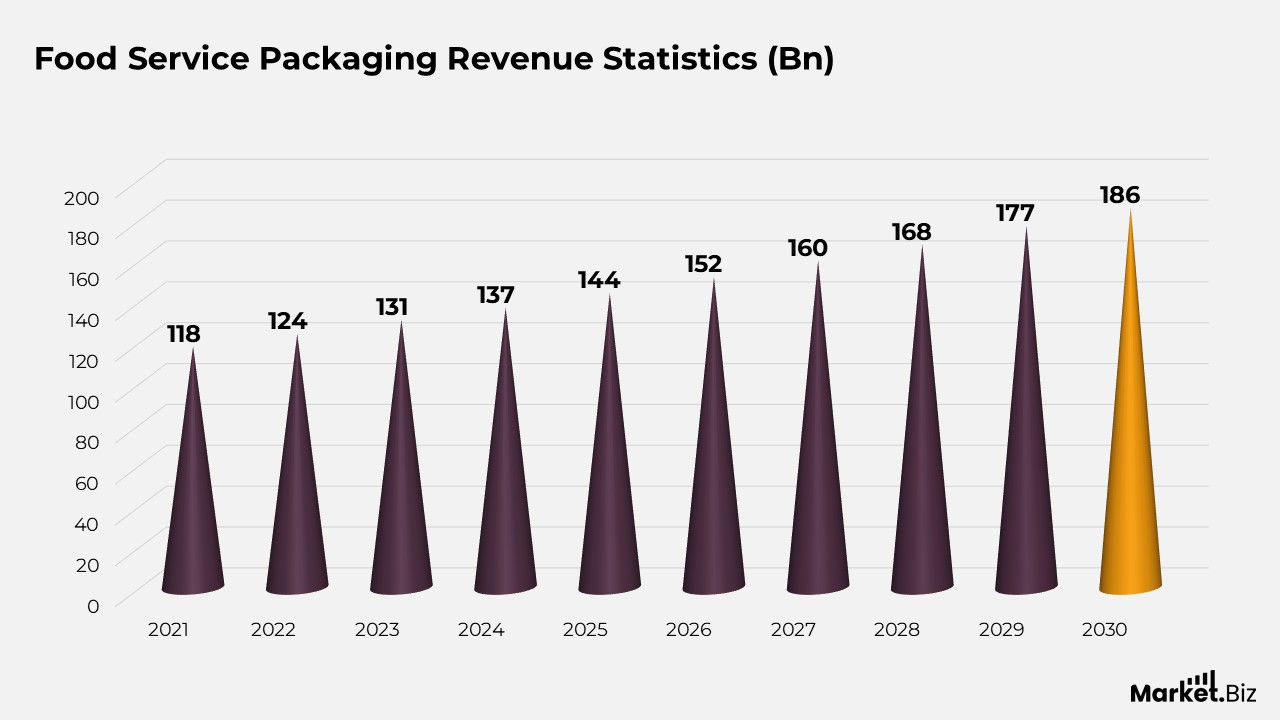
- By the year 2030, the global food service packaging market is projected to generate a revenue of USD 186 billion, highlighting the ongoing growth of this industry.
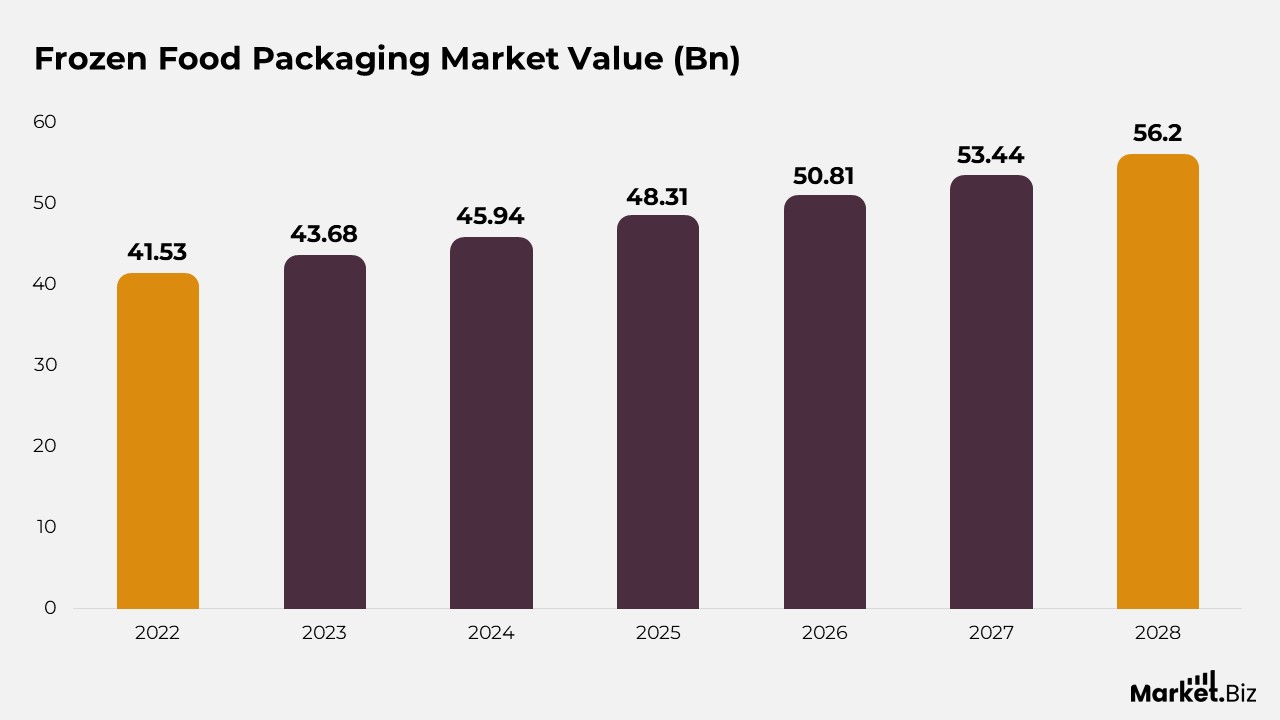
- The revenue for the global frozen food packaging market is expected to reach USD 56.2 billion by 2028
- As of March 2023, consumers in the United States identified several critical factors when assessing food packaging.
- The primary concern was hygiene and food safety, which was emphasized by 75% of the respondents.
- In 2018, various aspects of food packaging had a significant impact on the purchasing choices of French consumers
- The most crucial factor was the price, which was identified as the main consideration by 43% of the respondents.
Food Packaging Market Size Statistics
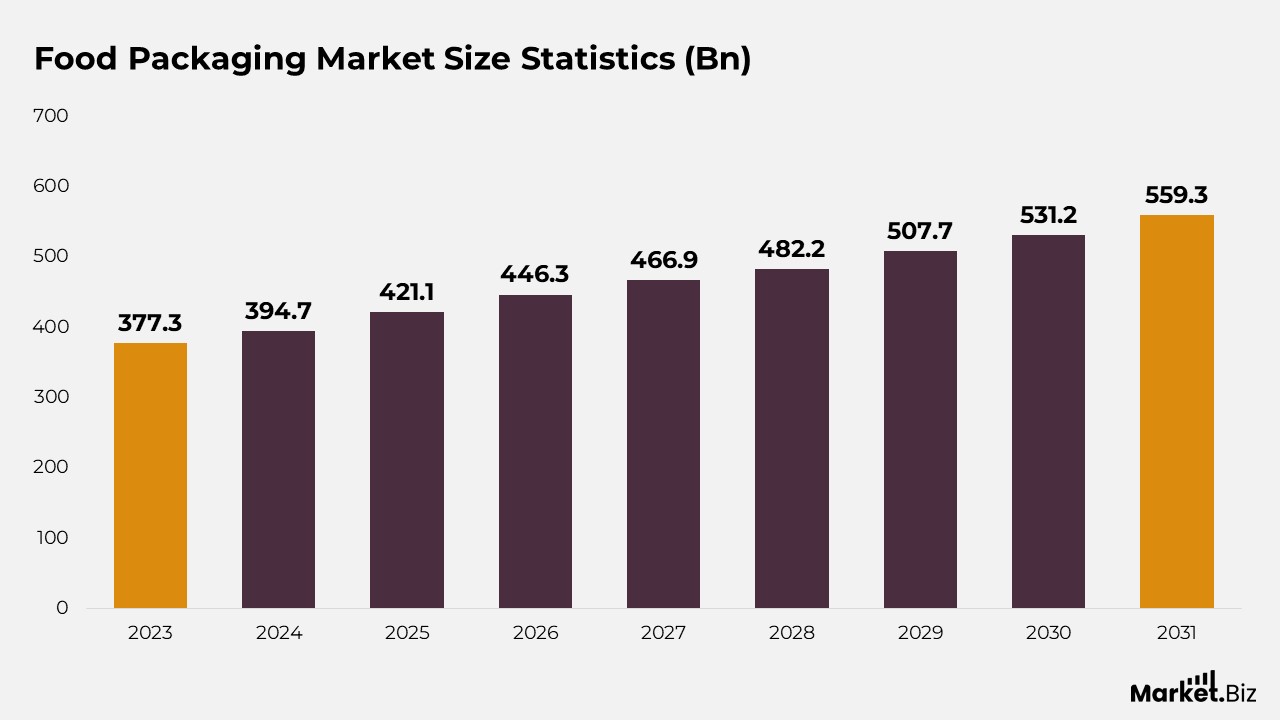
- The global food packaging market is anticipated to witness steady growth in the upcoming years, with a compound annual growth rate (CAGR) of 5.30%.
- Starting from a revenue of USD 358.3 billion in 2022, it is projected that the market will reach USD 377.3 billion by 2023.
- This positive trend is expected to continue, with the market forecasted to generate USD 394.7 billion in 2024 and further increasing to USD 421.1 billion by 2025.
- By 2026, the market is predicted to expand to USD 446.3 billion, and by 2027, it is likely to attain USD 466.9 billion.
- The pattern of consistent growth is expected to carry on, with estimates indicating that the market will reach USD 482.2 billion in 2028, USD 507.7 billion in 2029, and USD 531.2 billion by 2030.
- Looking further into the future, the market is projected to achieve revenues of USD 559.3 billion by 2031 and approximately USD 592.8 billion by 2032.
Regional Food Packaging Market Size
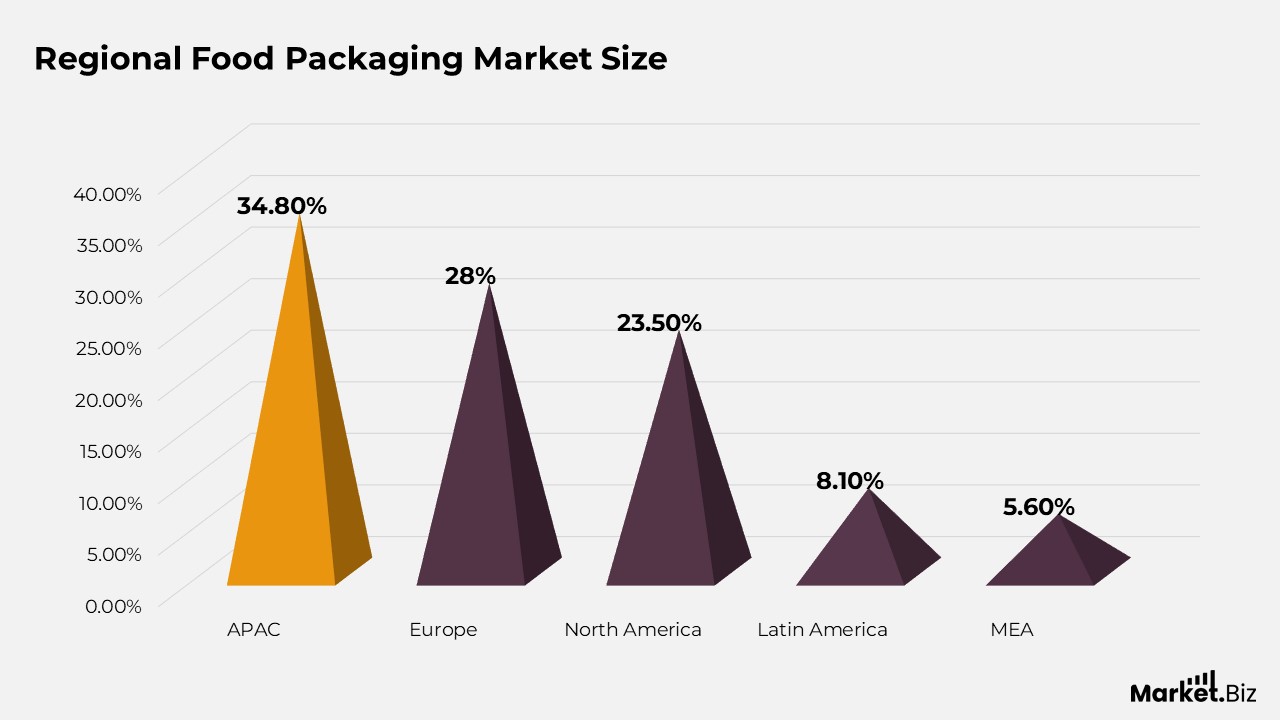
- The Asia-Pacific (APAC) region is at the forefront of the market, representing 34.8% of the overall share.
- Europe comes next, holding a notable 28% market share.
- North America also possesses a significant segment of the market, with a 23.5% share.
- Latin America adds 8.1% to the global market.
- Meanwhile, the Middle East and Africa (MEA) region makes up 5.6% of the total market share.
- This distribution underscores the preeminence of the APAC region in the food packaging sector, closely followed by Europe and North America.
Food Service Packaging Revenue Statistics
- In 2021, the market revenue was noted at USD 118 billion.
- This amount rose to USD 124 billion in 2022 and is projected to increase further to USD 131 billion in 2023.
- The market is forecasted to attain USD 137 billion by 2024 and continue its growth trajectory. It is anticipated to reach USD 144 billion in 2025 and USD 152 billion in 2026.
- The upward trend is expected to continue, with market revenues estimated to hit USD 160 billion by 2027, USD 168 billion by 2028, and USD 177 billion by 2029.
- By 2030, the global food service packaging market is projected to reach a revenue of USD 186 billion, highlighting the ongoing expansion of this industry.
Frozen Food Packaging Market Value
- In the year 2022, the market revenue amounted to USD 41.53 billion.
- This amount is forecasted to grow to USD 43.68 billion in 2023 and subsequently to USD 45.94 billion in 2024.
- The market is anticipated to keep expanding, achieving USD 48.31 billion by 2025.
- By 2026, the market revenue is expected to increase to USD 50.81 billion, followed by a rise to USD 53.44 billion in 2027.
- The upward trend is projected to persist into 2028, with the market expected to attain USD 56.2 billion.
Metallocene Polypropylene Food Packaging Statistics
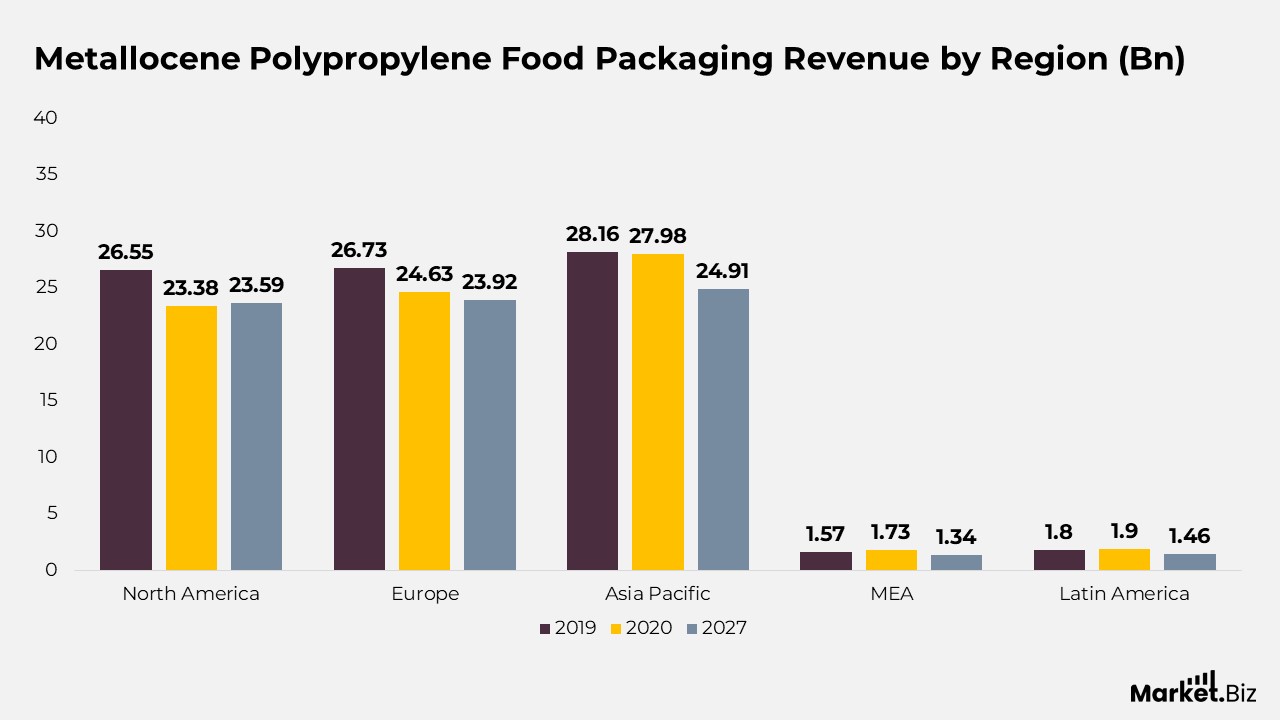
- In 2019, the Asia-Pacific region dominated the market with a revenue of $28.16 million, followed closely by Europe at $26.73 million and North America at $26.55 million.
- The revenues from the Middle East & Africa and Latin America were considerably lower, at $1.57 million and $1.8 million, respectively.
- In 2020, a slight downturn was noted across most regions, with the Asia-Pacific market generating $27.98 million. Europe $24.63 million, and North America $23.38 million.
- The Middle East & Africa experienced a minor increase to $1.73 million, while Latin America’s revenue rose to $1.9 million.
- Looking forward to 2027, the market is expected to continue its decline in most regions. The Asia-Pacific region is projected to generate $24.91 million, maintaining its leading position, albeit with a smaller margin.
- Europe and North America are anticipated to earn $23.92 million and $23.59 million, respectively.
- The Middle East & Africa and Latin America are expected to experience further decreases, with revenues of $1.34 million and $1.46 million, respectively.
Food Storage Container Statistics
- In 2011, around 183.98 million individuals reported utilizing disposable food storage containers. Conversely, 122.45 million stated they did not use them, while 5.14 million were either uncertain or did not respond.
- Over the years, the user base steadily grew, reaching 192.49 million in 2012 and 191.81 million in 2013. A minor increase was noted in 2014, with 192.01 million users, followed by a further rise to 193.53 million in 2015.
- Additionally, a significant surge occurred in 2016, with the user count reaching 206.19 million. This was accompanied by a marked decline in the non-user segment, which fell to 112.83 million. This upward trajectory persisted, with 207 million users recorded in 2017.
- However, from 2018 to 2020, the user numbers experienced a slight decline, with 201.71 million in 2018 and 199 million in 2019, although it rebounded to 199.52 million in 2020.
- Beginning in 2021, the user count gradually increased once more, reaching 201.07 million in 2021 and continuing to rise to 202.48 million in 2022. This trend is anticipated to persist, with forecasts of 203.87 million users in 2023 and 205.25 million in 2024.
- Meanwhile, the number of non-users has steadily risen from 129.31 million in 2020 to 132.57 million in 2024. The segment of respondents who were uncertain or did not provide an answer remained relatively stable, fluctuating slightly between 3.68 million and 5.14 million over the years.
Brands of Food Storage Containers
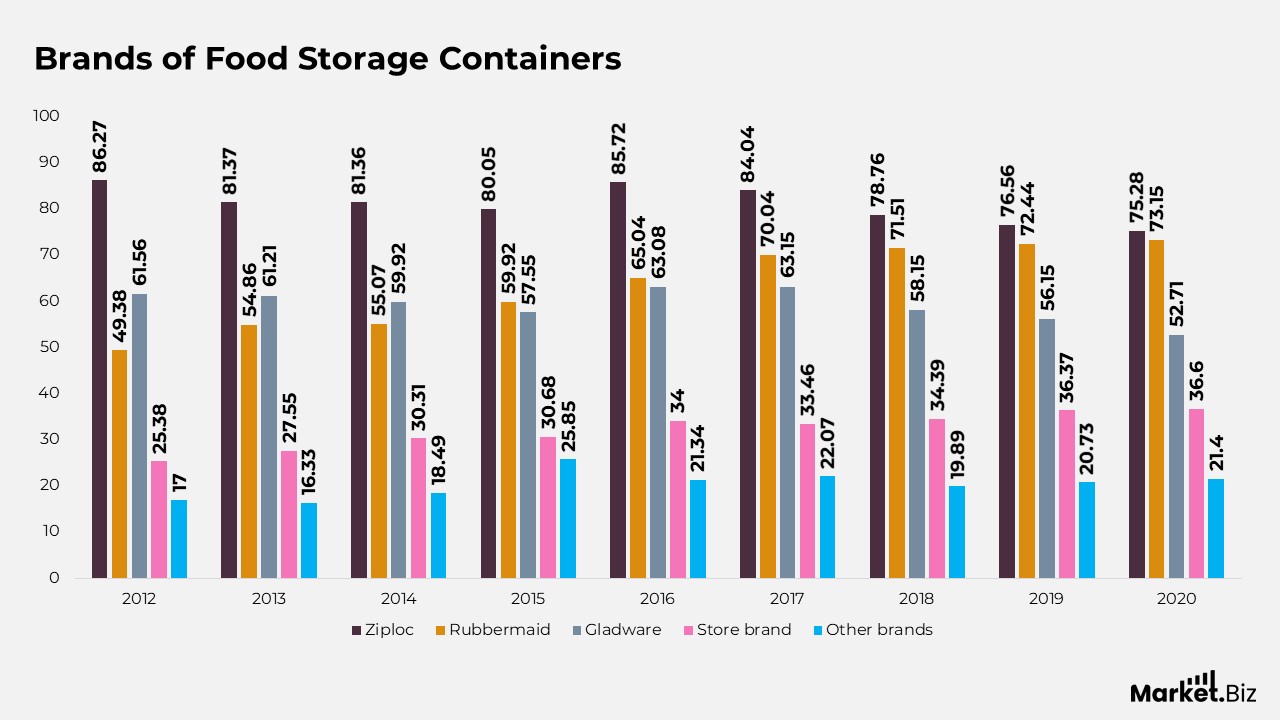
- In 2012, Ziploc emerged as the leading brand, boasting 86.27 million users. It was followed by Gladware, which had 61.56 million users, and Rubbermaid, with 49.38 million users. Store brands and other brands were less favored, attracting 25.38 million and 17 million users, respectively.
- Throughout the years, Ziploc sustained its dominant position, although its user count experienced a slight decline, reaching 75.28 million by 2020.
- Rubbermaid experienced a notable rise, increasing from 49.38 million users in 2012 to a peak of 73.15 million in 2020.
- Gladware’s user base varied, reaching a high of 63.15 million in 2017 before dropping to 52.71 million in 2020.
- Store brands maintained a steady, albeit smaller, user base, peaking at 36.6 million in 2020.
- The category of ‘Other brands’ saw fluctuating popularity, with the highest user count recorded at 25.85 million in 2015, before falling to 21.4 million in 2020.
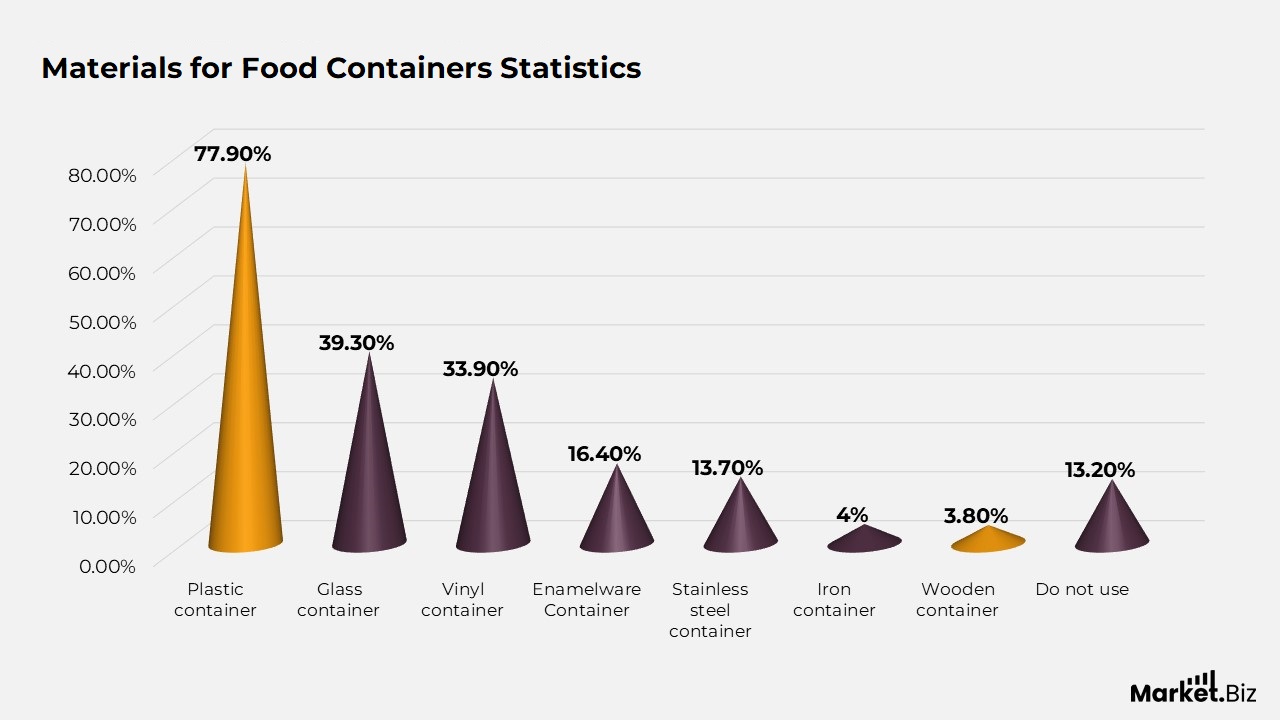
Materials for Food Containers Statistics
- As of February 2024, plastic containers have become the leading option for food storage in Japan, with 77.9% of survey participants expressing a preference for this material.
- Glass containers also represented a notable portion, utilized by 39.3% of the population. In contrast, vinyl containers were selected by 33.9% of respondents.
- Enamelware containers were employed by 16.4% of those surveyed, while stainless steel containers were favored by 13.7%, underscoring their specialized appeal
- Materials that were less frequently used included iron containers, preferred by 4% of respondents, and wooden containers, which were utilized by 3.8% of the population.
- Interestingly, 13.2% of respondents reported that they do not utilize any of the aforementioned container materials.
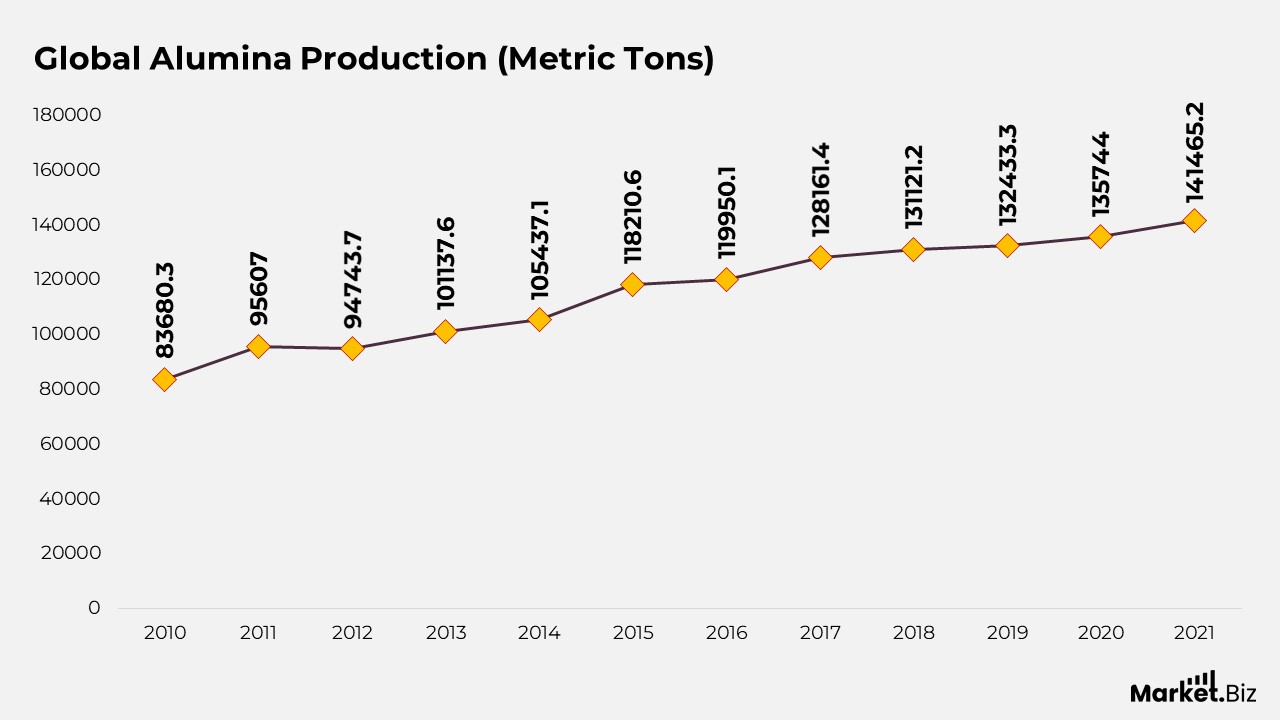
Global Alumina Production
- In 2010, the production volume was 83,680.3 thousand metric tons.
- This figure saw a significant increase in 2011, reaching 95,607.0 thousand metric tons, followed by a minor decline in 2012 to 94,743.7 thousand metric tons.
- However, production resumed its upward trend in 2013, exceeding the 100,000 mark to achieve 101,137.6 thousand metric tons.
- The growth continued steadily in the subsequent years, with production volumes rising to 105,437.1 thousand metric tons in 2014 and 118,210.6 thousand metric tons in 2015.
- In 2016, production further escalated to 119,950.1 thousand metric tons, followed by 128,161.4 thousand metric tons in 2017.
- The global alumina production reached 131,121.2 thousand metric tons in 2018.
- The upward trend continued, with production increasing to 132,433.3 thousand metric tons in 2019, 135,744.0 thousand metric tons in 2020, and culminating at 141,465.2 thousand metric tons in 2021.
Food Packaging Among Consumers Statistics
- As of March 2023, consumers in the United States identified several key factors when assessing food packaging.
- The primary concern was hygiene and food safety, which was prioritized by 75% of those surveyed.
- Following this, shelf life was deemed essential by 69% of consumers, underscoring the significance of packaging that preserves food freshness.
- Ease of use emerged as another critical factor, appreciated by 57% of respondents, indicating a demand for packaging that is user-friendly.
- Durability was a priority for 55% of consumers, ensuring that packaging can endure handling and safeguard its contents.
- Moreover, 54% of respondents highlighted the importance of the information provided on labels, including nutritional facts and ingredients.
- Environmental impact was a consideration for 39% of consumers, reflecting an increasing awareness and concern regarding sustainable packaging.
- Finally, 34% of respondents viewed the visual appeal of packaging as an important factor. Emphasizing the influence of aesthetics on consumer decisions.
Recent Development
- In early 2024, the Finnish packaging firm Huhtamaki obtained a €200 million green loan aimed at financing sustainable packaging innovations. Additionally, this loan will assist Huhtamaki in developing new renewable materials and broadening its sustainable food packaging offerings.
- Smart Packaging with IoT Integration: The concept of smart packaging, which employs IoT sensors to track the freshness and quality of food, is gaining significant popularity. It is projected that by 2025, 25% of food packaging will feature smart technology. Facilitating real-time monitoring of food safety and prolonging shelf life.
- Edible Packaging Innovations: Edible packaging, crafted from materials such as seaweed and rice. It’s increasingly making its mark in the market. By 2026, the edible packaging sector is anticipated to expand by 15%. Propelled by consumer interest in waste-free and sustainable packaging alternatives.
Conclusion
Food Packaging Statistics: The worldwide food packaging sector is undergoing a significant transformation, propelled by heightened consumer consciousness regarding environmental concerns and the increasing demand for sustainable materials. Consumers are progressively favoring eco-friendly alternatives such as biodegradable, compostable, and reusable packaging.
This transition signifies a larger movement towards sustainability, emphasizing the reduction of environmental impact while ensuring food safety and convenience. As the market grows, particularly in areas like Asia-Pacific and North America. Companies are required to innovate to accommodate these evolving preferences.
The future of food packaging hinges on achieving a balance between functionality, safety, and sustainability to meet consumer expectations and adhere to environmental standards.
FAQs
A prominent trend is the increasing focus on sustainability. Educated consumers now favor environmentally friendly packaging, made from recyclable materials, and has a minimal ecological footprint. Another notable aspect of food packaging is the demand for unique and customized designs.
Only 12% is incinerated, and 9% of plastic waste is recycled. The remaining 79% is either deposited in landfills or released into the environment, where it will persist indefinitely in some form, as plastic does not break down.
Flexible packaging plays a vital role in reducing food waste, which is a significant issue for both consumers and businesses. This type of packaging minimizes waste and overconsumption by extending the shelf life of perishable items and providing portion control.