Introduction
Online Food Delivery Statistics: As the demand for convenience grows, online food delivery platforms are experiencing rapid expansion across multiple regions. The widespread adoption of smartphones, mobile apps, and a shift in consumer preferences towards contactless services fuel this growth.
These platforms cater to a wide array of options, from fast food to gourmet meals, reshaping the way people access food. By analyzing relevant statistics, businesses can gain a deeper understanding of market size, consumer demographics, popular cuisines, and regional preferences.
Furthermore, these insights reveal important details about delivery times, customer satisfaction, and spending habits, enabling companies to optimize their operations and improve customer experiences. This data-driven approach empowers businesses to make informed decisions and maintain a competitive edge in the dynamic market.
Editor’s Choice
- 60% of restaurant operators report that offering delivery services has led to increased sales.
- 59% of restaurant orders from millennials are for takeout or delivery, highlighting the generation’s preference for convenience.
- The online food ordering industry is forecasted to be worth USD 200 billion by 2025, reflecting continued growth in the sector.
- The average annual consumption per person in the US food market is expected to reach 537.5kg in 2022.
- Consumers tend to spend more on online orders compared to in-store orders, with digital ordering growing at nearly 3x the rate of traditional on-site ordering.
- Online food ordering now contributes to roughly 40% of total restaurant sales, a significant portion of industry revenue.
- 55% of diners have primarily been eating at home since the onset of the pandemic, shifting dining habits.
- 68% of consumers reported being more likely to order takeout in 2021 than they were before the pandemic, indicating a long-term shift in behavior.
- Nearly 75% of consumers use mobile phones to place food orders, underscoring the importance of mobile-friendly platforms.
- In 2020, 92% of top-performing restaurants offered mobile order-ahead features and/or loyalty programs to enhance customer engagement.
- 30% of American diners who do not use third-party ordering apps avoid them because they prefer to support restaurants directly.
- 70% of consumers prefer to order directly from restaurants, prioritizing supporting the business over third-party platforms.
The Impact of Online Food Delivery Statistics
- 70% of customers select ordering food online and having it delivered.
- The number of employers in the online food delivery industry is expected to reach 2,656 million by 2026.
- Around 60% of operators report that offering delivery services has resulted in incremental sales.
- 59% of restaurant orders from millennials are for takeout or delivery.
- The online food ordering industry is expected to be valued at USD 200 billion by 2025.
- The average volume per person in the US food market is projected to reach 537.5kg in 2022.
- Customers spend more on online orders than on on-premise orders, with digital ordering growing at nearly 3x the rate of on-site ordering.
- Online food ordering now accounts for approximately 40% of total restaurant sales.
- China is the largest consumer of online food orders, followed by the USA as the second-largest.
- 1 in 3 customers in the US uses online food ordering services at least twice a week.
- 35% of guests determine restaurants through online reviews and the restaurant’s website, while 49% find them through recommendations from friends and family.
- Customers who place an online order with a restaurant are 67% more likely to visit that restaurant more frequently than those who do not.
- 63% of consumers agree that it is more convenient to get food delivery than dining out with a family.
- 87% of Americans using third-party food delivery services say it makes their lives easier.
(Source: Upserve, Statista, Restaurant Business, Fundera, Forbes, Zippia, BusinessofApps, Tacit, FinancesOnline)
Online Food Delivery Market Size
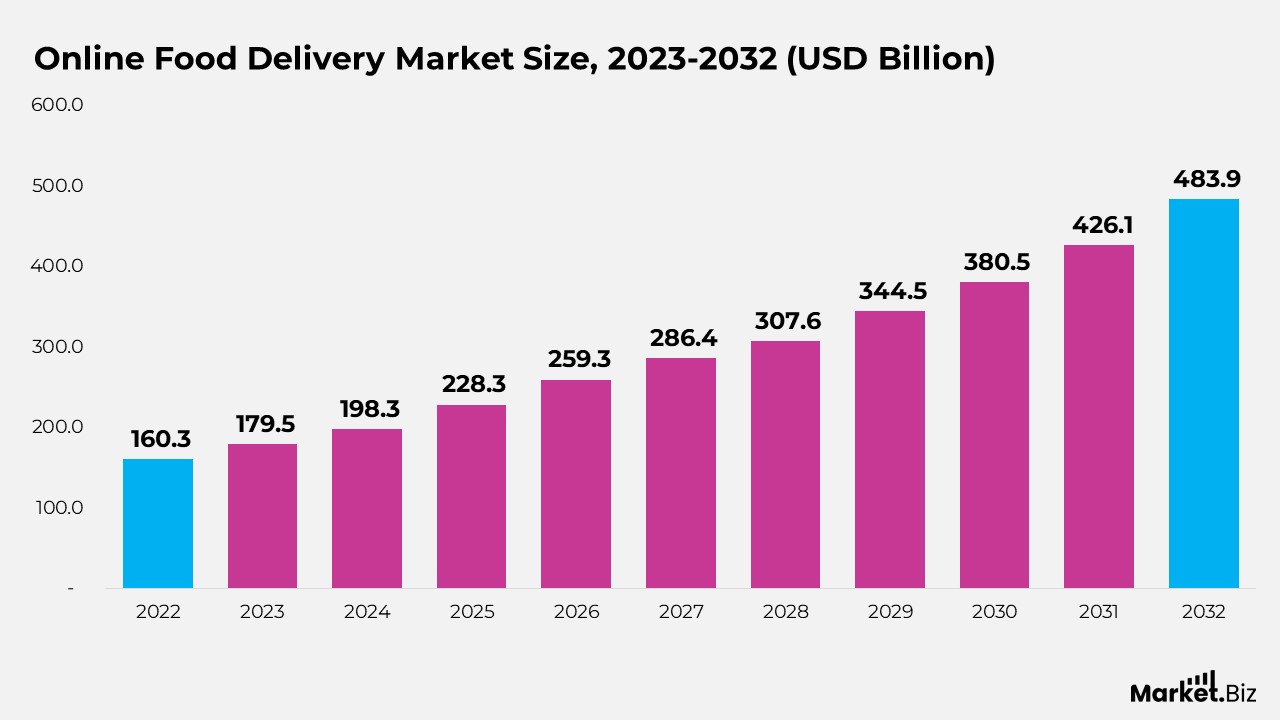
- According to Market.us, the online food delivery market is expected to rise from $179.5 billion in 2023 to $483.9 billion by 2032, representing a compound annual growth rate (CAGR) of 12% from 2025 to 2034.
- The online food delivery market is growing due to the increasing convenience it offers and the widespread availability of internet access, driven by busy lifestyles and technological advancements.
- In 2022, the Grocery Delivery segment captured more than 62% of the market share, reflecting consumer preferences and lifestyle trends.
- The Platform to Consumer Delivery segment held more than 65% of the market share in 2022, driven by the seamless integration of technology in the delivery process.
- In 2022, the Mobile Applications segment dominated the market with more than 73% of the share, owing to the increasing use of smartphones and demand for on-the-go services.
- The Order-focused Food Delivery System sector also had a dominant position in 2022, offering diverse culinary options from various restaurants through a single platform.
- In 2022, the Asia Pacific led the Online Food Delivery Market with more than 37% share, driven by high population density and rapid urbanization in countries like China, India, and Japan.
Moreover
- China is expected to generate the highest revenue in 2024, amounting to approximately USD 448 billion in the online food delivery market.
- Delivery revenue worldwide is forecasted to grow by 22.2%, with the United States showing a significant increase of 29%.
- The ARPU for online grocery deliveries in the United States is projected to reach approximately USD 1,360 in 2023, much higher than in China (USD 487), Europe (USD 448), and the global average (USD 449).
- By 2027, approximately 2.5 billion people globally are expected to have meals delivered, with 1.6 billion of them located in Asia.
- In 2023, the number of online food delivery users worldwide surpassed 1.6 billion, marking a 12% increase from the previous year.
- The adoption of online food delivery services in rural areas grew by 25% in 2023, as major industry players expanded to underserved markets.
- The use of AI and machine learning in online food delivery platforms increased by 22% in 2023, enhancing personalization, demand forecasting, and route optimization.
- The adoption of sustainable packaging and eco-friendly delivery options in the industry is expected to rise by 30% by the end of 2024.
- In 2023, 68% of US customers expressed a preference for ordering from local or independent restaurants via online delivery platforms.
- Drone deliveries are projected to exceed one million in 2024, though most drones have a limited carrying capacity of 5 to 25 pounds, which could limit larger food orders.
(Source: Market.us)
Food E-Commerce Market Size
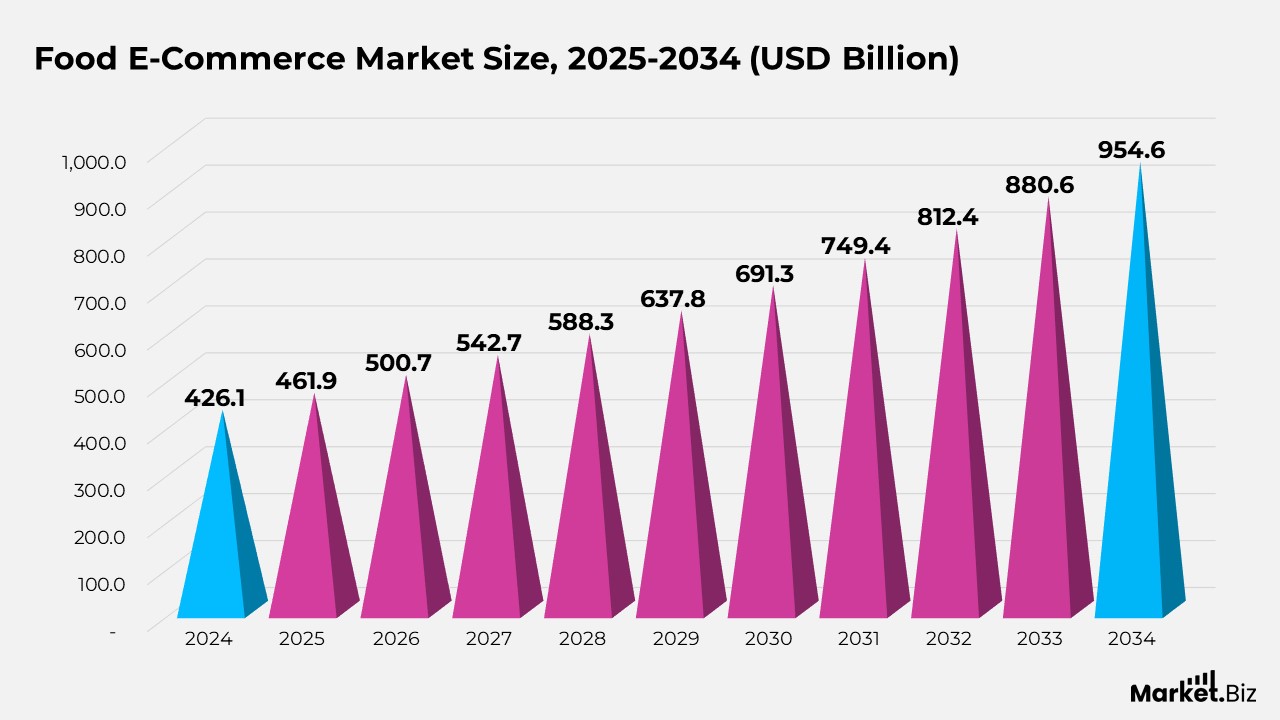
- According to Market.us, the global food e-commerce market is expected to rise from $461.9 billion in 2025 to $954.6 billion by 2034, representing a compound annual growth rate (CAGR) of 8.40% from 2025 to 2034.
- The growth of the food e-commerce market is driven by shifts in consumer behavior and technological advancements, with urbanization and busy lifestyles increasing demand for online grocery services.
- In April 2025, the Indian food eCommerce market recorded approximately USD 690 million in monthly revenue, reflecting a 5.7% increase from March 2025.
- October 2024 saw the peak of the Indian food eCommerce market, accounting for 10.9% of the total annual revenue for 2024.
- The US food e-commerce market was valued at approximately USD 125.1 billion in 2024, showing strong growth in digital consumer habits, particularly in grocery, meal kits, and ready-to-eat products.
- North America held more than 32.6% of the global food e-commerce market in 2024, generating approximately USD 138.9 billion in revenue, driven by strong digital infrastructure and platforms like Amazon Fresh and Instacart.
- The B2C (Business-to-Consumer) segment held more than 68.7% of the market share in 2024, driven by consumer demand for convenience, home delivery, and personalized food shopping experiences.
- The Restaurant Meal Delivery segment dominated with more than 57.3% of the food e-commerce market share in 2024, supported by factors that highlight its popularity.
(Source: Market.us)
Trends in the Food Delivery Industry
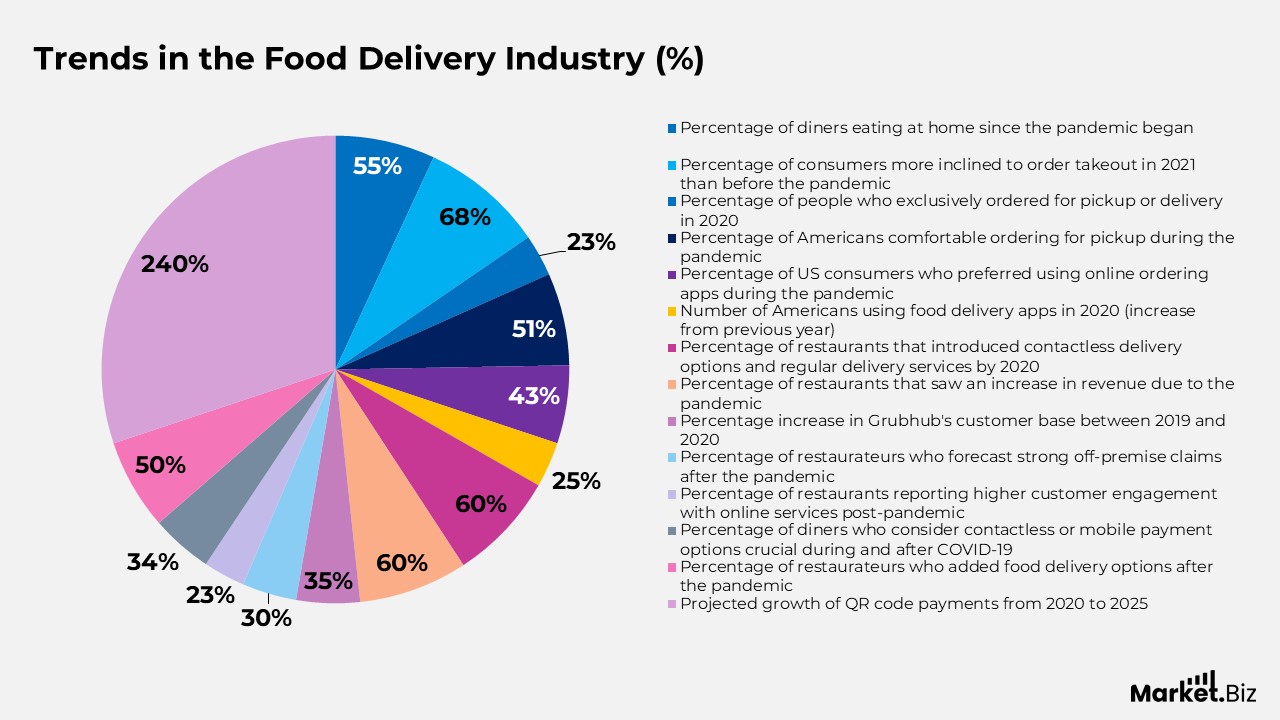
- 55% of diners have been eating at home since the pandemic began.
- 68% of consumers stated they were more inclined to order takeout in 2021 compared to before the pandemic.
- 23% of people exclusively ordered for pickup or delivery in 2020.
- 51% of Americans felt comfortable ordering for pickup during the pandemic.
- During the pandemic, 43% of US consumers preferred using online ordering apps to place food orders.
- In 2020, over 45 million Americans used a food delivery app, marking a 25% increase from the previous year.
- By 2020, at least 3 out of 5 restaurants had introduced contactless delivery options and regular delivery services to boost sales.
- Nearly 60% of restaurants experienced an increase in revenue due to the pandemic.
- Grubhub, a leading food delivery app, saw a 35% increase in its customer base between 2019 and 2020.
- 30% of restaurateurs forecast that off-premise claims will remain strong even after the pandemic ends.
- 23% of restaurants reported higher customer engagement with their online services compared to pre-pandemic times.
- 34% of diners stated that the availability of contactless or mobile payment options is a crucial technology during and after COVID-19.
- Nearly 50% of restaurateurs added food delivery options to adapt to the evolving market after the pandemic.
- QR code payments are expected to grow by 240% from 2020 to 2025, driven by the demand for cashless transactions due to the pandemic.
- Over 112 million Americans have used a food delivery service.
- The online food delivery market generates over $26.5 billion annually.
Moreover
- The industry is expected to reach $32 billion by 2024.
- 60% of American consumers order takeout or delivery at least once a week.
- 31% of U.S. consumers place food delivery orders through third-party services at least twice a week.
- Online food orders are growing at a rate three times faster than in-house dining.
- 70% of customers prefer to order directly from a restaurant rather than use a third-party service.
- 59% of millennial consumers opt for takeout or delivery when ordering from restaurants.
- Consumers spend 18% more on average when ordering pizza online compared to ordering by phone.
- 33% of customers are willing to pay extra for faster delivery.
- 45% of consumers say mobile ordering or loyalty programs would encourage them to order food online more often.
- 41% of consumers would purchase meal kits from their favorite restaurants if available.
- GrubHub is the most popular delivery service in New York City.
- DoorDash leads in popularity in San Francisco.
- Uber Eats is the preferred service in Miami.
- Postmates is the dominant service in Los Angeles.
- 60% of restaurant operators report that offering delivery has led to increased sales.
- Partnering with third-party delivery services can increase restaurant sales by 10-20%.
- 43% of restaurant professionals believe third-party platforms hinder direct customer relationships.
- Customers who order online from a restaurant visit that restaurant 67% more frequently than those who don’t.
(Source: FinancesOnline, HotelTechReport, SevenRooms, BlinkCo, NerdWallet Inc. )
How Mobile Technology is Shaping the Future of Food Delivery and Ordering
- Nearly 75% of people use mobile phones to order food.
- 92% of top-performing restaurants in 2020 offered mobile order-ahead features and/or loyalty rewards programs.
- Using digital menu boards viewable on mobile phones can boost yearly store sales by USD 16,000 per unit.
- In 2019, 51% of diners ordered directly from a restaurant’s website, 38% used an online ordering aggregate site, and 29% used a mobile app.
- By March 2020, 38% of American customers had ordered food through a food delivery app, a number that increased to 41% in 2021, indicating steady growth.
- 49% of restaurant operators consider a mobile payment option essential for diners.
- Around 50% of consumers are open to using QR codes as a payment method in bars and restaurants.
- 58% of consumers in the US prefer cashless payments.
- 70% of a restaurant’s total digital orders are derived from its branded app or website.
- Orders placed via smartphones and mobile apps grew to a USD 38 billion industry in 2020.
- About 60% of online orders are made on smartphones.
- Mobile app orders account for nearly a quarter of all sales at Starbucks locations in the US.
- By late 2020, mobile orders made up around 75% of all sales at Domino’s.
- Pizza chains reported an 18% increase in customer spend from online/mobile orders compared to phone orders.
- On average, consumers have two delivery apps on their phones and use them three times per month.
- Food delivery and online ordering apps were among the most popular app downloads in 2020, with Uber Eats and the McDonald’s app each reaching 82 million global downloads, surpassing apps like Google Maps, Tinder, and eBay.
(Source: HotelTechReport, FinancesOnline, Upserve, SevenRooms, GeekWire)
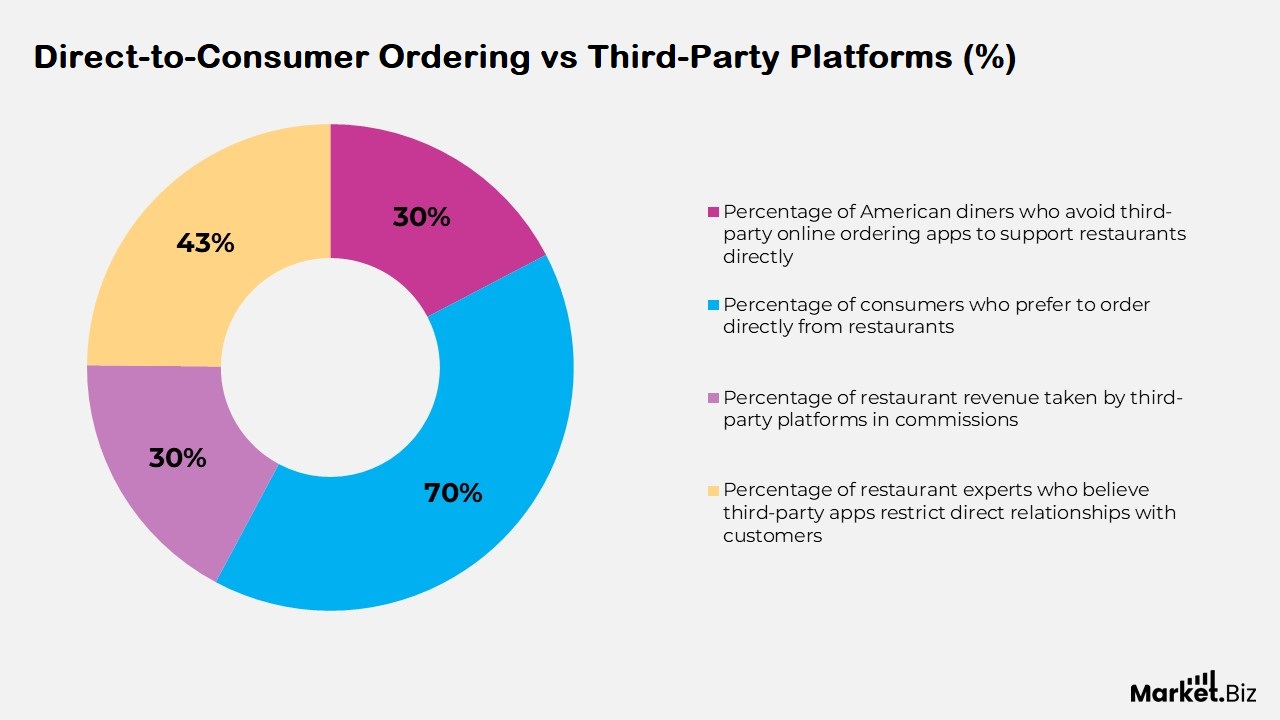
Direct-to-Consumer Ordering vs Third-Party Platforms
- 30% of American diners who don’t use third-party online ordering apps avoid them because they prefer to support restaurants directly.
- 70% of consumers would rather order directly from a restaurant, preferring that their money goes directly to the restaurant instead of a third party.
- The largest segment in the online food delivery market is direct-to-consumer ordering, as opposed to third-party ordering.
- 78% of off-premise orders are placed indirectly, while 22% are made through third-party platforms.
- By the end of 2020, direct ordering platforms generated approximately USD 16 billion in revenue.
- Third-party platforms can take up to 30% of a restaurant’s revenue in commissions.
- 43% of restaurant experts trust third-party apps to restrict the direct relationship among a restaurant and its customers.
(Source: SevenRooms, Hospitality Technology, Upserve)
Why Consumers Choose Third-Party Platforms
- In Canada (56%), the US (46%), and Australia (48%), a significant portion of consumers prefer using third-party platforms like DoorDash for food delivery.
- The primary reason consumers favor third-party delivery apps over ordering directly from restaurants is convenience. 45% of Canadians, 42% of Australians, and 49% of US consumers cite ease of use as the top factor.
- Using third-party delivery apps has become a regular habit for consumers, with Canadians averaging 4 orders per month, Americans 4.6 orders, and Australians 4.2 orders monthly.
(Source: DoorDash, Statista)
Direct Online Ordering
- At Starbucks locations in the US, mobile app orders account for nearly 25% of all sales, according to the company’s Q3 2020 report.
- Domino’s has seen significant success with its mobile app, with around 75% of its sales coming from mobile orders by late 2020.
- Approximately 60% of online orders are placed via smartphones, making it crucial for restaurants to ensure their websites and ordering systems are mobile-friendly.
- To manage the increase in online orders, fast-casual and quick-service restaurants, like Burger King and Chipotle, have introduced dedicated “lanes” for more efficient order pickups.
- Pizza restaurants have been pioneers in online ordering, with Pizza Hut first testing the waters in 1994 and launching the first mobile ordering app for the segment in 2009. The app even included in-app games for customers while they awaited their delivery.
- 23% of restaurants report that their customers are now more engaged with their online offerings compared to pre-pandemic times, indicating a clear shift toward digital ordering channels.
- A recent study by Square revealed that two-thirds of customers prefer ordering directly through a restaurant’s mobile platform instead of using third-party services. Among them, 61% said their preference is driven by a desire to support the restaurant directly.
- Online ordering systems also provide an opportunity for restaurants to easily test menu changes, such as photos or pricing, through A/B testing features, which can help businesses optimize their offerings before making them permanent.
(Source: HotelTechReport, Statista)
How Different Generations are Embracing Food Delivery
- A study of over 100,000 food delivery app reviews revealed that the phrase “first time” appeared 36% more frequently in 2020 compared to 2019, indicating that many customers were using food delivery apps for the first time.
- Millennials and Gen Z are allocating a significant portion of their income to dining out or food delivery. After groceries, dining out is the second-largest spending category for both generations.
- According to a 2020 National Restaurant Association study, millennials are measured as the “food delivery generation,” with 75% of millennial respondents having ordered takeout or delivery for dinner in the past week.
- Baby boomers are also joining the takeout trend. In March 2020, 41% of baby boomers had well-organized delivery, a number that grew to 60% in November 2020.
- When ordering pizza online, the average order is 18% larger compared to those placing orders over the phone.
- Not just pizza, online orders in general generate 23% more revenue than in-person orders.
- A popular special request on Uber Eats in 2020 was “no onion”, with “extra sauce” and “no tomatoes” also ranking as common preferences.
Moreover
- 35% of delivery and takeout customers—53% of millennial customers—stated they would be more inclined to order from a restaurant that offers to-go alcoholic beverages.
- According to a 2019 study, 17% of consumers complained that their food arrived cold or stale, and 16% said it arrived late.
- About 14% of consumers have used voice assistants like Siri and Alexa to place food delivery orders, even while driving.
- Google has integrated food delivery options into Google Maps and Google Search, making it easier for consumers to find restaurants that offer online ordering and delivery.
- Holidays like Mother’s Day, New Year’s Eve, and Halloween are among the most popular times for food delivery, according to a 2020 DoorDash report.
- Speed is crucial for food delivery, with the average delivery window being 35 minutes. However, 27% of consumers are willing to pay extra for faster delivery.
- The volume of online off-premises food orders exceeded phone orders back in 2017.
- On Uber Eats in March 2020, French fries were the most popular menu item, while cheesecake topped the list of most ordered desserts.
(Source: HotelTechReport, Statista, DemandSage)
Conclusion
The online food delivery market has witnessed substantial growth, fueled by changing consumer preferences, technological progress, and a shift toward greater convenience. The pandemic significantly accelerated these trends, driving a surge in demand for delivery services, contactless payments, and online ordering platforms.
As the number of users grows, along with increased consumer engagement and a shift to digital ordering, the market is set for continued expansion. As more consumers opt for the convenience of food delivery, businesses and restaurants are adapting by enhancing their services, utilizing advanced technologies, and refining customer experiences.
This transformation underscores the rising importance of digital platforms in the food service sector, ensuring that online food delivery will play a central role in the future of dining..
FAQ’s
Multiple factors, including a shift in consumer preferences toward convenience and ease, drive the growth of the online food delivery market. Technological innovations in ordering platforms and delivery logistics have improved speed, reliability, and user experience. Additionally, the COVID-19 pandemic accelerated this trend, as it increased the demand for contactless services and home delivery, further boosting the popularity of online food delivery.
The online food delivery market is projected to reach USD 200 billion by 2025. This growth is fueled by a combination of evolving consumer preferences for convenience and the widespread adoption of online platforms in response to increasing demand for food delivery services.
Approximately 70% of consumers prefer to order food online for delivery rather than dine out. This growing preference reflects the increasing demand for convenient, flexible dining options, as more people look for time-saving solutions and rely on digital platforms for food access.
In 2020, over 45 million Americans used food delivery apps, marking a 25% increase from the previous year. This surge demonstrates the growing popularity of digital food ordering and the increasing reliance on food delivery services in response to shifting consumer habits.