
Introduction
Car Safety Statistics: Car Safety involves crucial features and practices that aim to safeguard occupants and avert accidents. Passive safety measures consist of airbags, seat belts, crush zones, and child safety seats, all designed to lessen injury in the event of a collision. Active safety features such as ESC, ABS, collision warning systems, and blind spot monitoring improve driver control and awareness while on the road.
Safe driving practices include defensive driving, minimizing distractions, and performing regular vehicle maintenance. Following speed limits and refraining from driving under the influence further enhance overall road safety. Collectively, these components form a holistic approach to car safety, merging vehicle technologies with responsible driving behaviors to diminish risks and improve protection for all road users.
Editor’s Choice
- Each day, over 500 children under the age of 18 perish in traffic-related incidents worldwide.
- Traffic-related deaths and injuries create considerable financial strains on the global economy each year.
- As of 2023, the car safety market revenue was recorded at USD 145.3 billion.
- In 2019, the worldwide traffic-related mortality rate was 16.7 deaths for every 100,000 individuals, leading to an overall total of 1,282,150 fatalities globally.
- South Africa had the highest rate of road fatalities, reporting 25.0 fatalities per 100,000 inhabitants, followed by Malaysia with a rate of 21.0.
- In the United States, human drivers experience a collision approximately every 484,000 miles traveled. Whereas Waymo’s autonomous vehicles encounter one every 1.26 million miles.
- In 2004, side airbags were included in 28% of domestic vehicles and 78% of imported vehicles. By 2005, these percentages increased to 34% for domestic and 81% for imported vehicles.
General Car Safety Statistics
- Every 24 seconds, approximately one individual loses their life in a road accident, culminating in an estimated 1.35 million deaths annually.
- Each day, over 500 children under the age of 18 perish in traffic-related incidents worldwide.
- Road traffic injuries represent the primary cause of death for young individuals aged 15 to 29.
- Pedestrians, cyclists, and motorcyclists constitute more than half of all road fatalities globally.
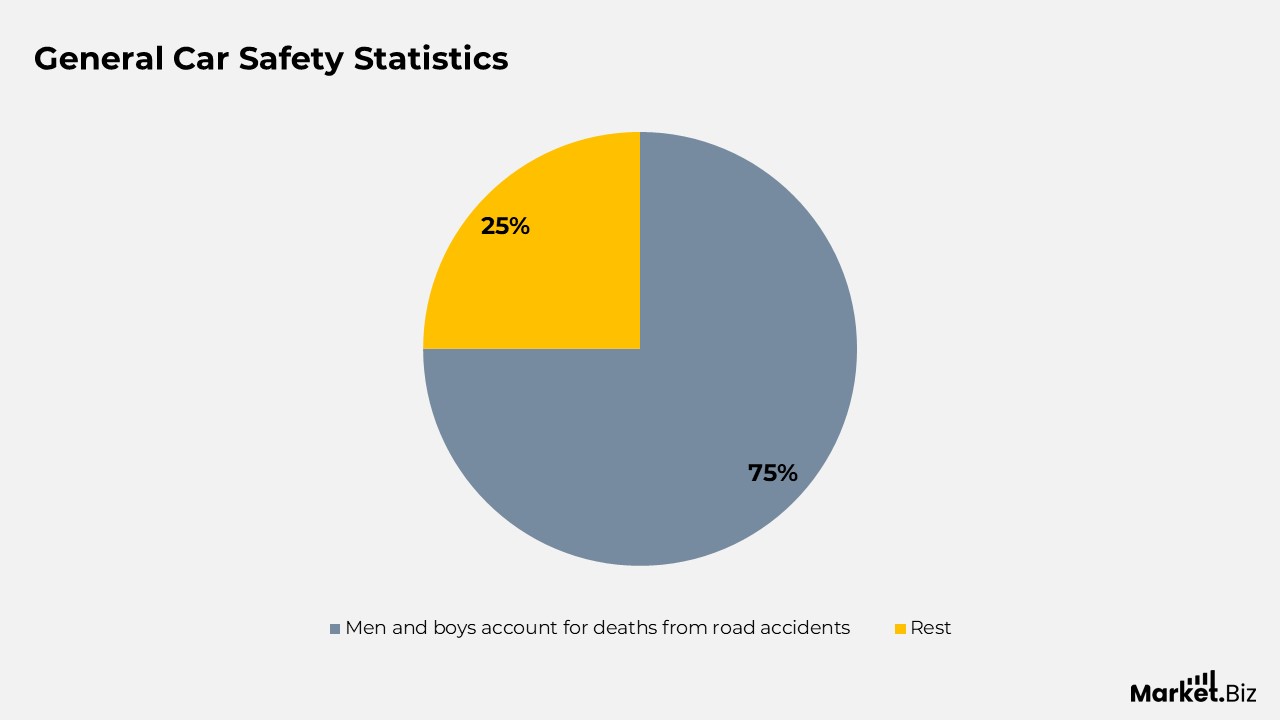
- Men and boys account for 75% of the deaths resulting from road accidents.
- Every year, between 20 to 50 million non-fatal injuries occur due to road crashes.
- Low- and middle-income nations, which possess around 60% of the world’s vehicles, endure 93% of global road fatalities. The mortality rate from road accidents in these regions is over three times greater than that in high-income countries.
- In addition to the human toll, road accidents incur high economic costs, amounting to approximately 3% of GDP in numerous nations.
- Traffic-related deaths and injuries create considerable financial strains on the global economy each year.
- According to an Insurify survey, 68% of Gen Z drivers engage in texting or interact with text messages while driving.
- Among Gen Z drivers in the Midwest, caution is more prevalent, with 37.5% choosing to wait until they are parked to reply to texts, as indicated by Insurify’s survey.
- Insurify’s findings reveal that Gen Z experiences the highest rates of accidents (7%) and DUIs (1%) compared to other generations.
- The National Highway Traffic Safety Administration (NHTSA) reports that teenagers aged 15 to 20 have a fatal crash rate that is 1.7 times greater than the average for all licensed drivers.
- In 2023, distraction was a contributing factor in approximately 13% of injury crashes and 8% of fatal crashes, according to the NHTSA.
Car Safety Market Growth Statistics
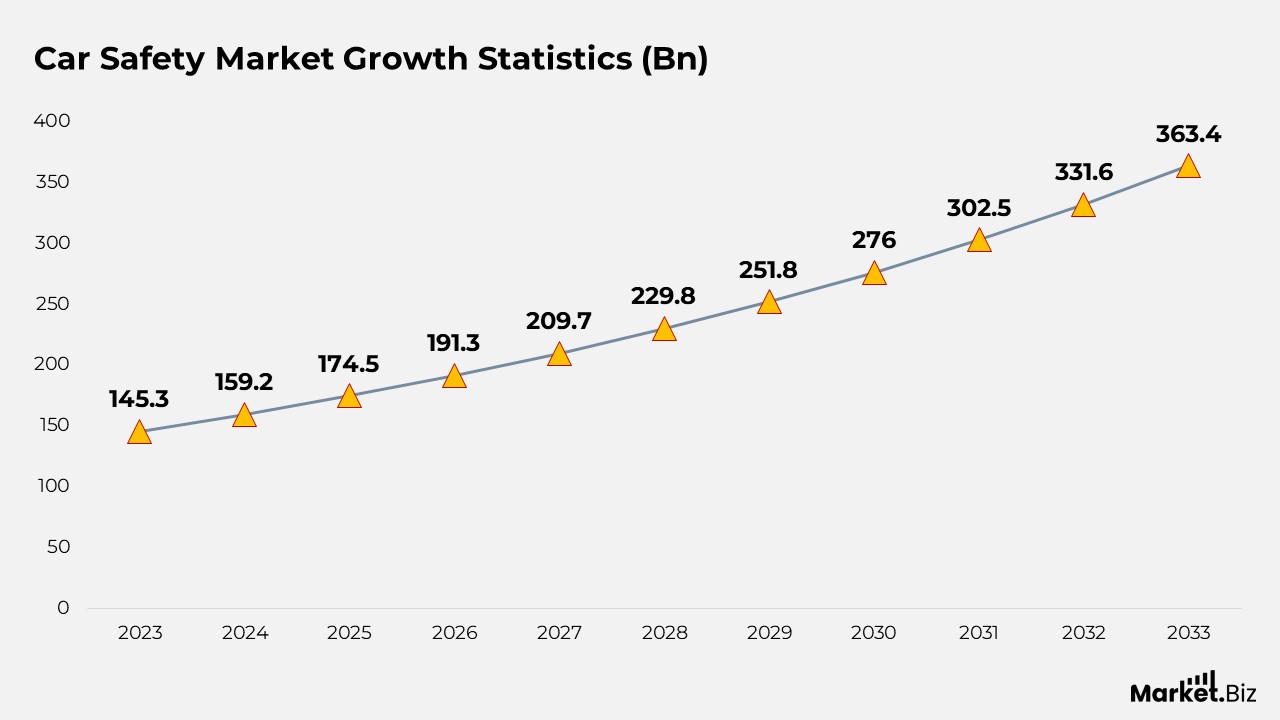
- The global automotive safety market has experienced remarkable growth over the last ten years and is expected to maintain this upward trend with a compound annual growth rate (CAGR) of 9.60%.
- As of 2023, the market revenue was recorded at USD 145.3 billion.
- By 2024, it is anticipated to rise to USD 159.2 billion and further increase to USD 174.5 billion in 2025.
- This trend is projected to continue, with estimates of USD 191.3 billion in 2026, USD 209.7 billion in 2027, and USD 229.8 billion in 2028.
- The market is expected to achieve USD 251.8 billion in 2029 and is likely to exceed USD 276.0 billion by 2030.
- Growth is forecasted to continue, with revenues anticipated to reach USD 302.5 billion in 2031, USD 331.6 billion in 2032, and an impressive USD 363.4 billion by 2033.
Regional Traffic-Related Deaths
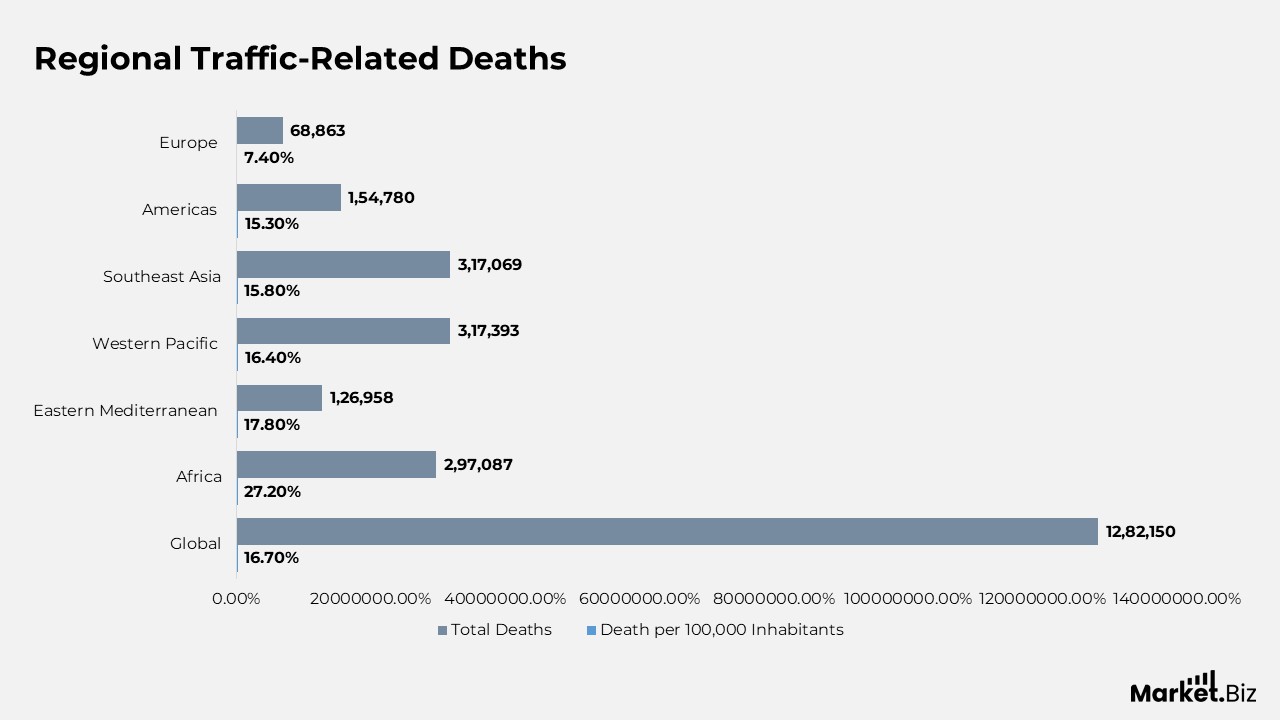
- In 2019, the worldwide traffic-related mortality rate was 16.7 deaths for every 100,000 individuals, leading to an overall total of 1,282,150 fatalities globally.
- Regionally, Africa exhibited the highest mortality rate at 27.2 per 100,000 individuals, which accounted for 297,087 fatalities.
- The Eastern Mediterranean region followed closely with a rate of 17.8, resulting in 126,958 deaths.
- The Western Pacific region documented a rate of 16.4 deaths per 100,000 inhabitants, culminating in 317,393 fatalities. Whereas Southeast Asia reported a comparable total of 317,069 deaths but with a slightly lower rate of 15.8.
- The Americas had a mortality rate of 15.3, leading to 154,780 fatalities.
- Europe recorded the lowest traffic-related mortality rate at 7.4 per 100,000 inhabitants, with a total of 68,863 deaths.
Road Death Rate by Country
- In 2017, the number of road fatalities per 100,000 inhabitants showed considerable variation among different nations.
- South Africa had the highest rate, reporting 25 fatalities per 100,000 inhabitants, followed by Malaysia with a rate of 21.
- Colombia and Jamaica exhibited comparable rates of 14.1 and 13.9, respectively.
- Uruguay documented 13.5 fatalities per 100,000 inhabitants, closely trailed by Mexico at 13.2 and Argentina at 12.
- Cambodia’s rate was recorded at 11.9, while the United States reported 11.6.
- Chile’s rate was slightly lower at 10.5, with Morocco at 10. Korea and Serbia had rates of 8.1 and 8.2, respectively.
- New Zealand had 7.9 fatalities per 100,000 inhabitants, whereas Poland reported the lowest rate among the countries listed at 7.4.
Car Fatality Rate by Country
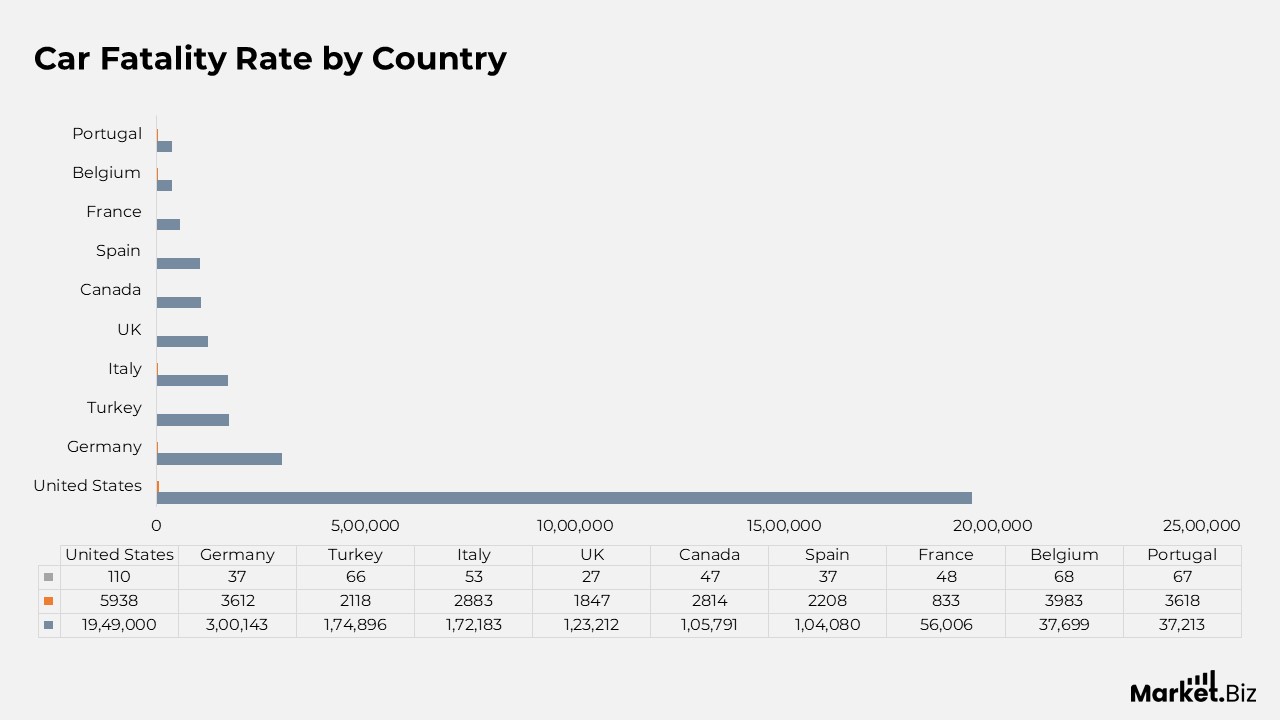
- In 2019, the occurrence of car accidents and the associated fatalities exhibited considerable variation across multiple countries. The United States documented the highest overall number of accidents, totaling 1,949,000, which corresponds to 5,938 accidents per 1 million individuals and 110 fatalities per million.
- Germany recorded 300,143 accidents in total, resulting in 3,612 accidents per million people and a death rate of 37 per million. Turkey noted 174,896 accidents, translating to 2,118 accidents per million and 66 fatalities per million.
- Italy’s statistics indicated 172,183 total accidents, with 2,883 accidents per million individuals and 53 fatalities per million. The United Kingdom reported 123,212 accidents, which equate to 1,847 per million people and 27 fatalities per million.
- In Canada, there were 105,791 accidents, leading to 2,814 accidents per million individuals and 47 fatalities per million. Spain recorded 104,080 accidents, with 2,208 accidents per million individuals and 37 fatalities per million.
- France reported 56,006 accidents, which corresponds to 833 per million individuals and 48 fatalities per million. Belgium documented 37,699 accidents, with a notably high rate of 3,983 accidents per million individuals and 68 fatalities per million.
- Finally, Portugal had 37,213 accidents, resulting in 3,618 accidents per million individuals and 67 fatalities per million. These statistics highlight significant disparities in road safety and accident rates among these countries.
Economic Cost of a Car Crash
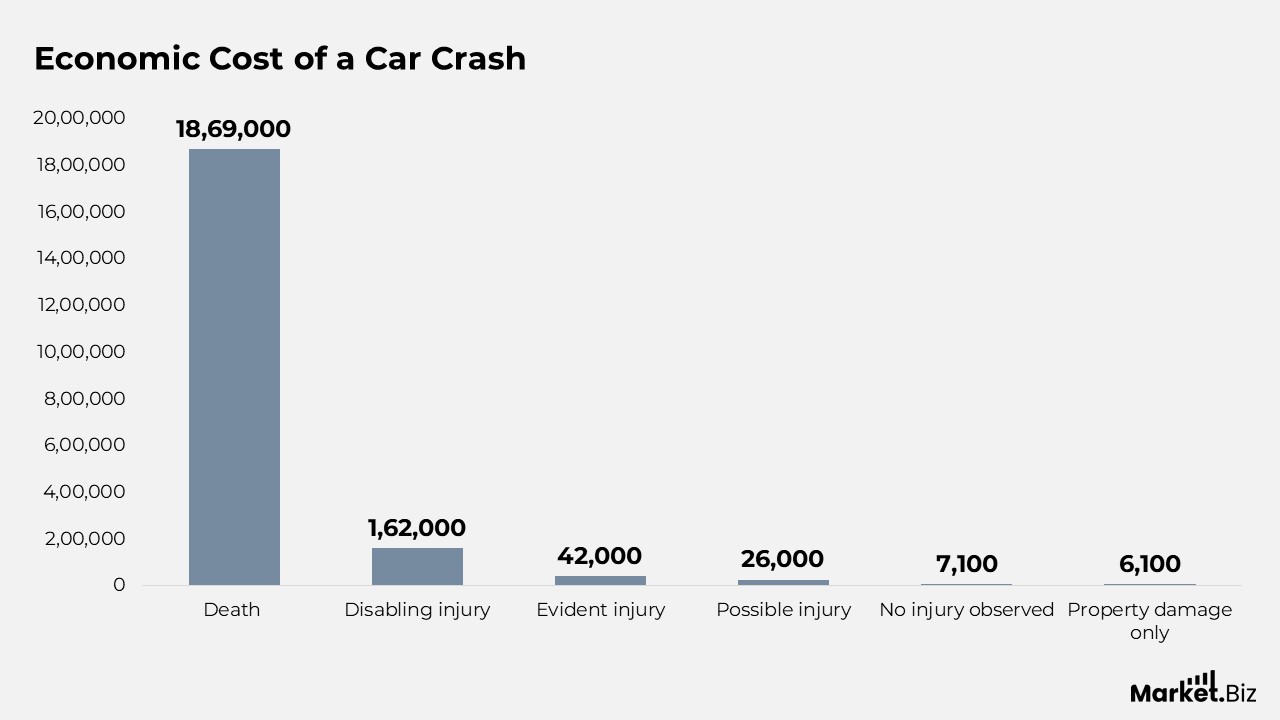
- The National Safety Council reports that the average expense resulting from a car crash fatality in the United States amounts to $1.869 million.
- Car safety statistics indicate that this figure encompasses direct costs, including medical expenses and vehicle repairs, as well as indirect costs such as administrative fees and the loss of wages and productivity.
- Financially, the car crash fatalities, which totaled 42,406, resulted in costs exceeding $79 billion for the U.S. The expenses related to accidents, whether they are fatal or not, are substantial.
- A non-fatal disabling car crash injury can incur costs of approximately $162,000, while a noticeable injury can exceed $42,000.
Self-Driving Car Safety Statistics
- In the United States, human drivers experience a collision approximately every 484,000 miles traveled. Whereas Waymo’s autonomous vehicles encounter one every 1.26 million miles.
- It is anticipated that self-driving cars will yield savings of around $447 billion by the year 2050. Primarily due to a reduction in emergency service expenditures.
- In 2020, disconnection events on Waymo’s autonomous vehicles were noted at an impressive average of 0.036 disconnections per 1,000 miles.
- Furthermore, the frequency of disconnection incidents during the testing of self-driving vehicles in California decreased by 20% from 2019 to 2020, indicating a positive trend in the advancement of autonomous driving technology.
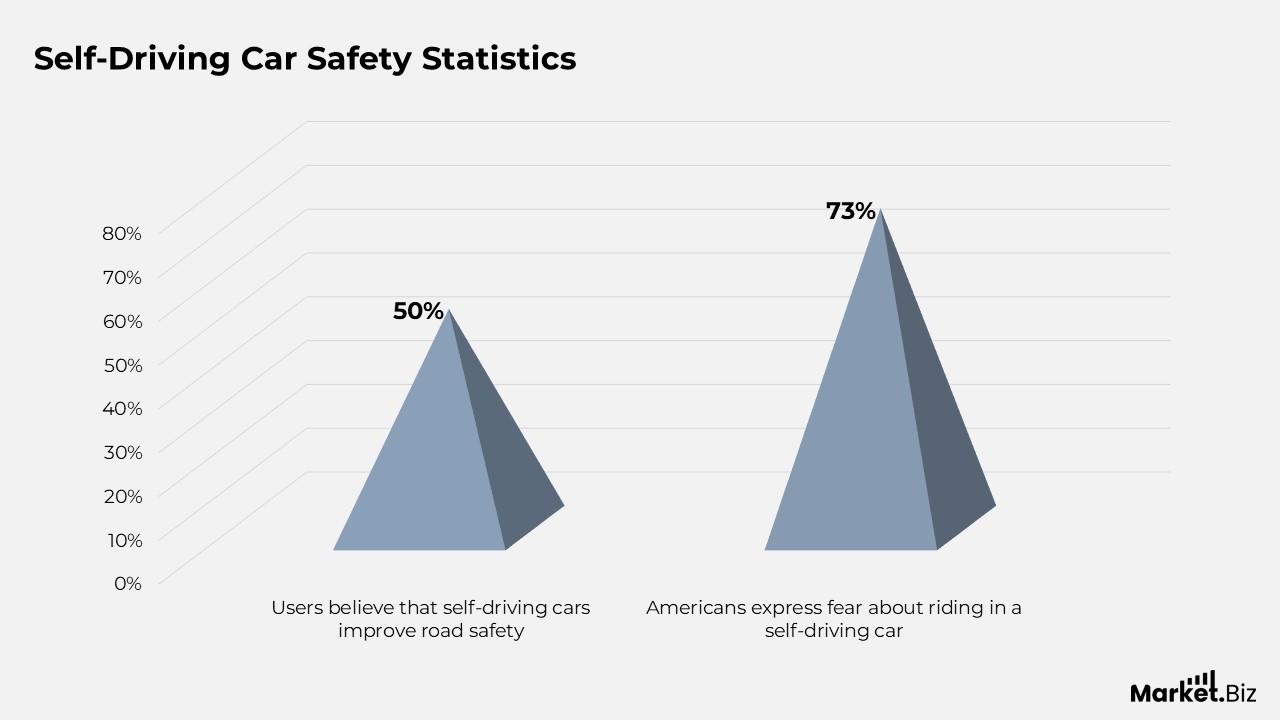
- Although public sentiment is divided, with 50% of consumers believing that self-driving vehicles enhance road safety, 73% of Americans express anxiety about riding in a self-driving car.
- The influence of autonomous vehicles on road safety is substantial. Their deployment in the United States could potentially result in an 81% decrease in vehicle collisions.
- By 2035, car safety projections suggest that self-driving technology will have averted approximately 1.25 million traffic-related deaths.
- Tesla claims that its Autopilot system decreases crash incidents by 40% in comparison to conventional, non-autonomous vehicles.
- On the other hand, Waymo indicates an accident rate of 0.59 accidents per million miles for its autonomous cars, which is considerably lower than the US average of 2.98 accidents.
Car Safety Features Statistics
Airbags
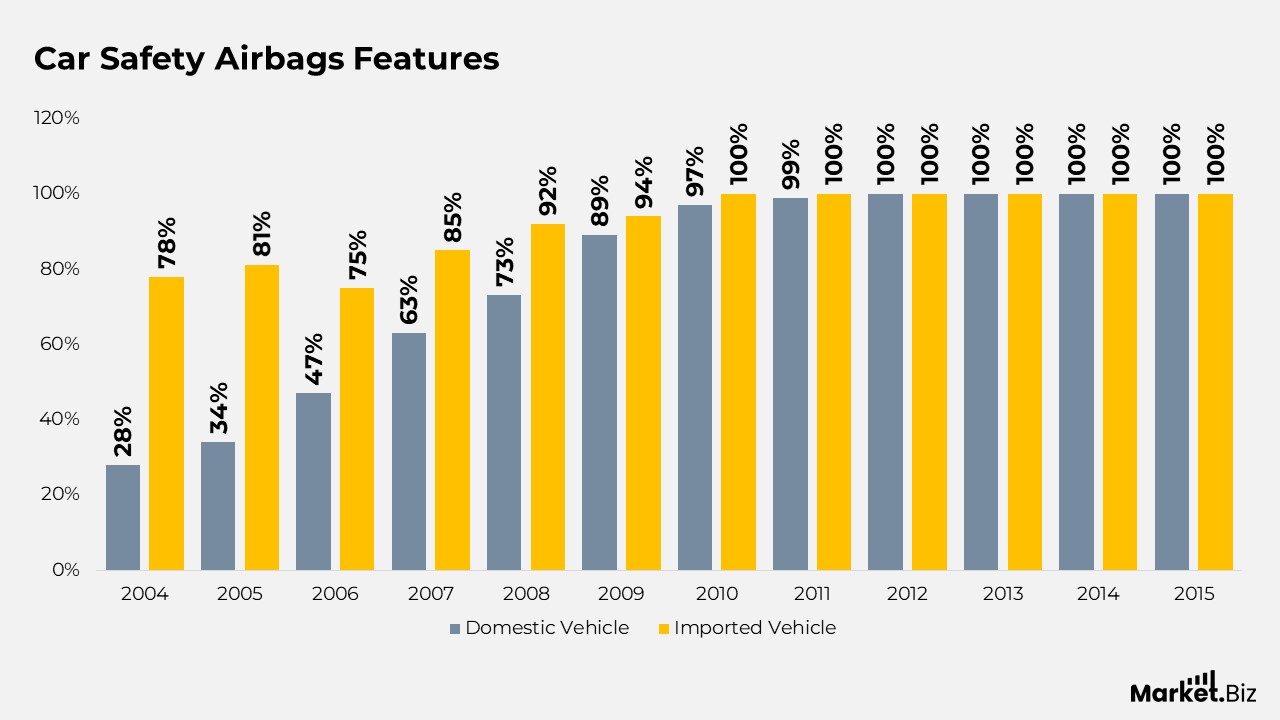
- In 2004, side airbags were included in 28% of domestic vehicles and 78% of imported vehicles. By 2005, these percentages increased to 34% for domestic and 81% for imported vehicles.
- The upward trend persisted, with 47% of domestic vehicles and 75% of imported vehicles equipped with side airbags in 2006.
- In 2007, the figures rose to 63% for domestic and 85% for imported vehicles. By 2008, 73% of domestic vehicles and 92% of imported vehicles were fitted with side airbags.
- A notable increase was observed in 2009, with 89% of domestic vehicles and 94% of imported vehicles featuring side airbags.
- The penetration rate for domestic vehicles reached 97% in 2010, aligning with the 100% rate for imported vehicles.
- From 2011 onwards, side airbags became standard in both domestic and imported vehicles, with both achieving a 100% penetration rate.
Booster Seat
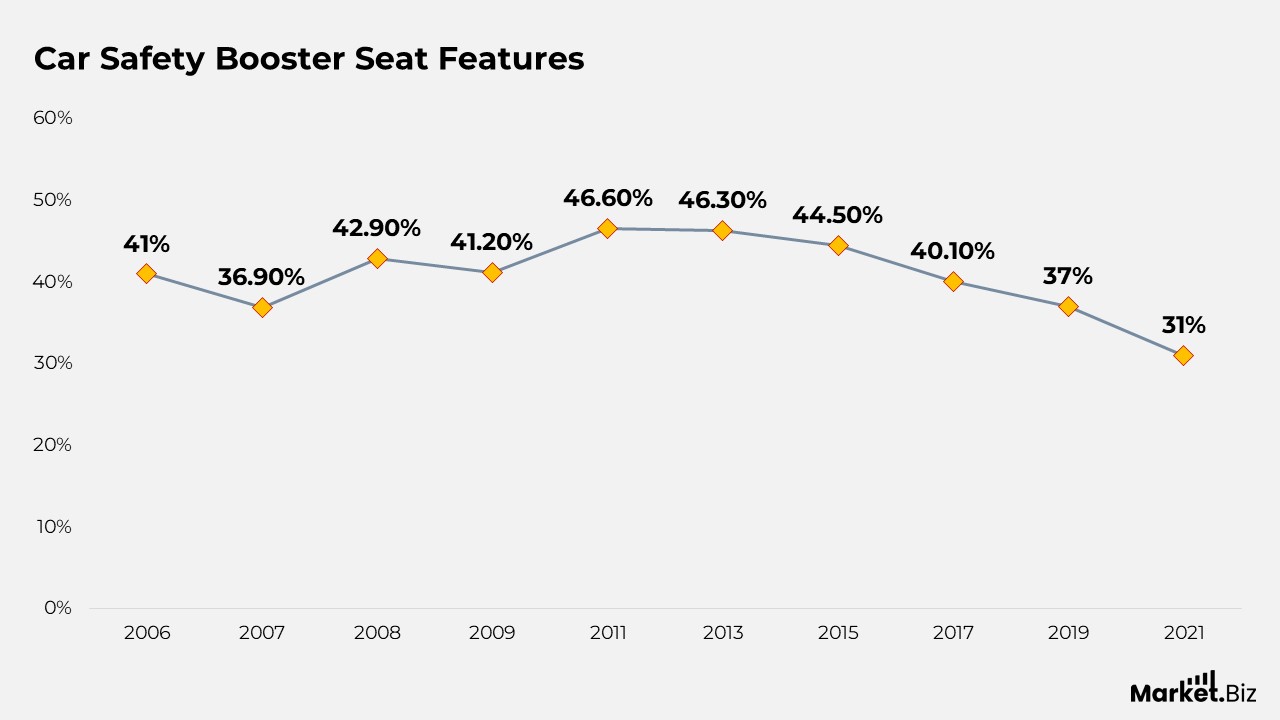
- In 2006, 41% of children within this age category utilized booster seats.
- This figure saw a slight reduction to 36.9% in 2007, followed by an increase to 42.9% in 2008.
- The percentage fell again to 41.2% in 2009.
- By 2011, the usage of booster seats had climbed to 46.6%, sustaining a relatively high level of 46.3% in 2013.
- Nevertheless, the trend started to decline, recording 44.5% in 2015 and further decreasing to 40.1% in 2017.
- The downward trajectory persisted at 37% in 2019, and by 2021, the usage rate had decreased to 31%.
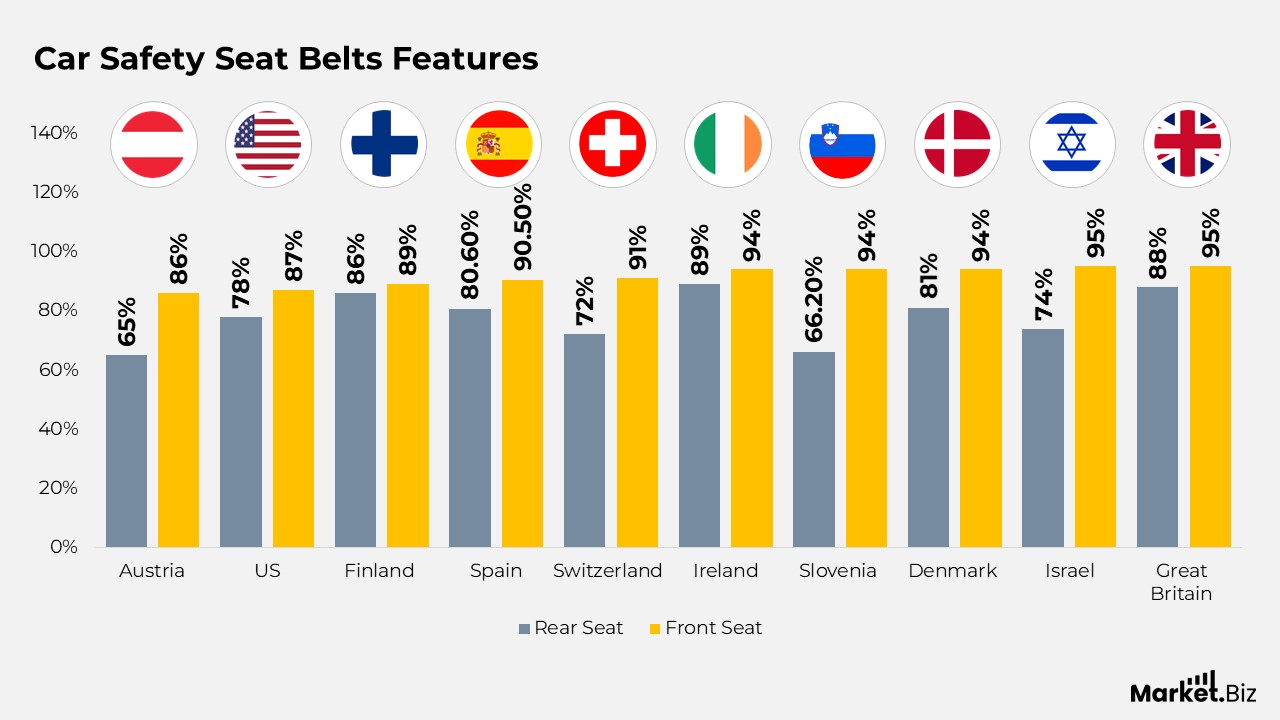
Seat Belts
- Austria recorded a rear seat usage rate of 65% and a front seat rate of 86%. In the United States, the figures were 78% for the rear seat and 87% for the front seat. Finland demonstrated even higher usage, with 86% in the rear and 89% in the front.
- Moreover, Spain’s statistics indicated a rear seat usage of 80.6% and a front seat usage of 90.5%. Switzerland reported a rear seat belt usage of 72% and a front seat usage of 91%. In Ireland, the rates were 89% for the rear and 94% for the front.
- Slovenia and Denmark showed comparable front seat rates with 94%, plus rear seat usage at 66.2% and 81%, respectively. Israel’s rates were 95% for the front and 74% for the rear, while Great Britain reported 95% for the front and 88% for the rear.
Recent Developments
The General Safety Regulation of the European Union, which was implemented in 2024, requires the incorporation of advanced safety technologies in newly manufactured vehicles. This includes systems such as intelligent speed assistance, advanced emergency braking, and lane-keeping technologies, all aimed at improving road safety.
Later, in early 2024, the National Highway Traffic Safety Administration (NHTSA) in the United States introduced new safety standards that emphasize the adoption of advanced crash avoidance technologies and more stringent crashworthiness criteria to ensure the protection of vehicle occupants.
Conclusion
Car Safety Statistics: In summary, the landscape of car safety is undergoing rapid changes. This evolution is propelled by advancements in technology and an increased awareness of vehicle safety features. The global market for car safety is anticipated to experience substantial growth, fueled by significant investments in both active and passive safety technologies.
Although there are regional differences in traffic-related fatalities and injuries, initiatives to enhance road safety are ongoing across the globe. While the usage of seat belts and side airbags is on the rise, challenges persist, especially regarding the acceptance of self-driving vehicles. Moreover, Concerns surrounding safety, control, and reliability continue to exist, necessitating thorough testing and clear communication to foster public trust.
Furthermore, the declining use of booster seats for children and the imperative for strong cybersecurity measures for autonomous vehicles underscore critical areas that require additional attention.
FAQs
The 2025 Genesis G90 has garnered numerous accolades for its structural integrity, AI-enhanced crash prevention systems, passenger safety features within the cabin, and additional attributes. It continues to be our selection for the safest vehicle, based on crash evaluations conducted in 2025.
Our findings indicate that distracted driving is the leading cause of car accidents. Drivers who are distracted take their focus away from the road by participating in activities such as using a mobile phone, texting, eating, or engaging in multitasking while operating a vehicle.
The Hyundai Venue. This subcompact crossover SUV has been associated with 13.9 fatal accidents for every one billion vehicle miles traveled, which is 4.9 times higher than the average rate for vehicles.