
Introduction
Bicycle Statistics: Cycling transcends being merely a means of transportation. It represents a substantial global industry, with projections indicating that the international bicycle market will exceed 60 billion U.S. dollars in 2025. Additionally, it is recognized as a respected professional sport, with major cycling events ranking among the most popular in the realm of global sports: in 2024, the European television audience for the Tour de France reached approximately 150 million viewers.
Offering numerous benefits both on and off the bike, cycling is poised to continue as a vital component of the global sports market for the foreseeable future. Bicycles are commonly used for various activities such as sports, hiking, exercise, commuting, and more. So, manufacturers provide a diverse range of designs to cater to these different applications, aiming to attract a broader customer base.
Factors such as increasing traffic congestion, surrounding environmental issues, and urbanization are propelling industrial growth. This article will provide further insights into ‘Bicycle Industry Statistics.
Editor’s Choice
- By the year 2027, it is projected that the global market for electric cargo bikes will increase to $1.60 billion.
- The global kids’ bicycle market was projected to reach $17.5 billion in 2021.
- Forecasts suggest ongoing growth, with the market anticipated to reach USD 63.74 billion in 2025, USD 65.07 billion in 2026, and USD 66.51 billion in 2027.
- China is at the forefront of the market, generating a revenue of USD 12,370 million, followed by the United States with USD 8,684 million and Germany with USD 7,607 million.
- The presence of a bike lane on a heavily trafficked road leads to a 285% reduction in the risk of injuries.
- In the United States, cycling ranks as the third most favored outdoor activity, with over 51 million Americans engaging in biking annually.
- Among all bicycle trips taken, 76% are made by men, while 24% are made by women.
- The worldwide average cycling speed is 13.5 mph.
- 2% of all car crash fatalities in the United States involve cyclists.
General Bicycle Statistics
- By the year 2027, it is projected that the global market for electric cargo bikes will increase to $1.60 billion.
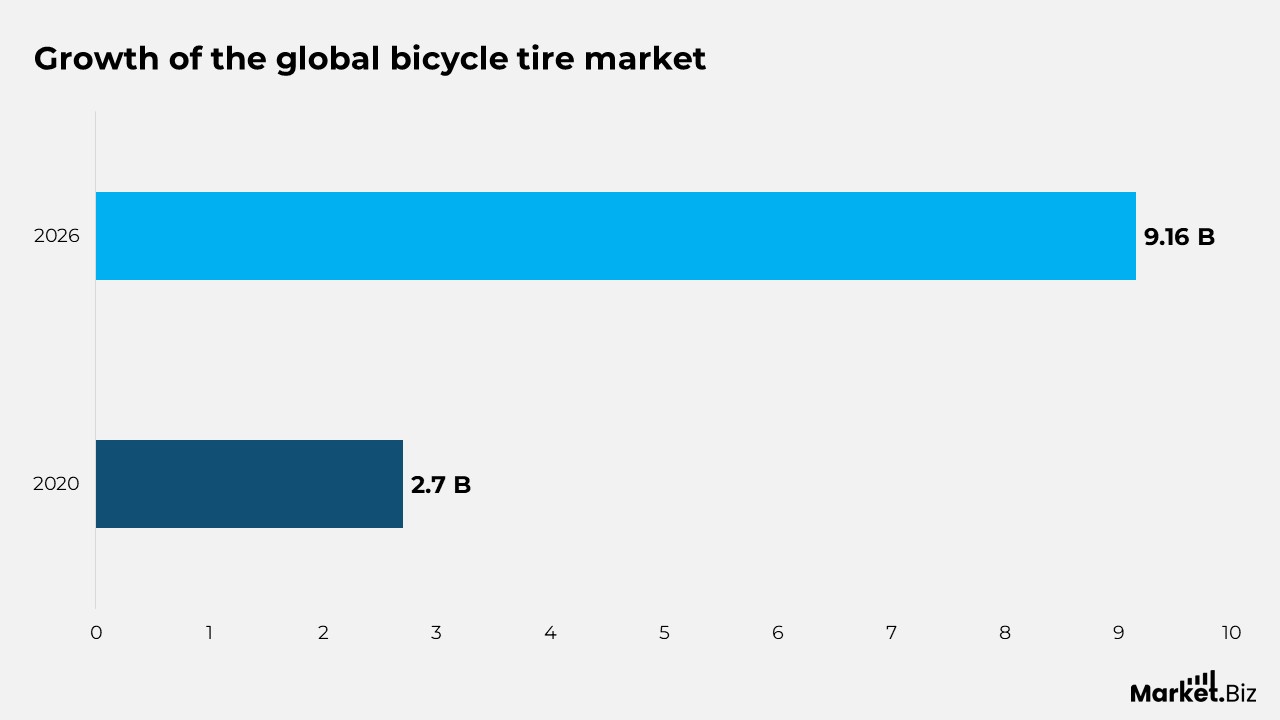
- Until 2026, the global bicycle tire market is anticipated to grow by $9.16 billion.
- In 2020, the indoor cycling sector was estimated to generate a revenue of $2.7 billion.
- Denmark has the highest bicycle market, with nearly 5.3 bicycles per capita.
- In 2021, the bicycle industry in the United Kingdom was valued at GBP 3.3 billion in revenue.
- The global bicycle-sharing market has been valued at $3.1 billion in recent years.
- In 2024, the projected revenue for the global Bicycle industry is expected to reach $62.80 billion.
- By 2027, the uptake of electric bikes in the United States is estimated to hit 7 million units.
- In 2021, the revenue of the French bicycle industry was recorded at 1.053 euros.
- Worldwide e-bike sales are expected to reach 40 million units in 2023, with China being a key player in the industry.
- Approximately 2.6% of professionals in England reported that they typically spend around 60–89 minutes cycling for leisure, while 2% of survey participants from the area cycled for the same duration for travel purposes.
- The global kids’ bicycle market was projected to reach $17.5 billion in 2021.
- Looking ahead, the industry is expected to experience a consistent annual growth rate of 2.19%.
- The chart above illustrates the premium bicycle market size by type from 2021 to 2032.
- By 2029, this growth is expected to culminate in an estimated market volume of $70.00 billion.
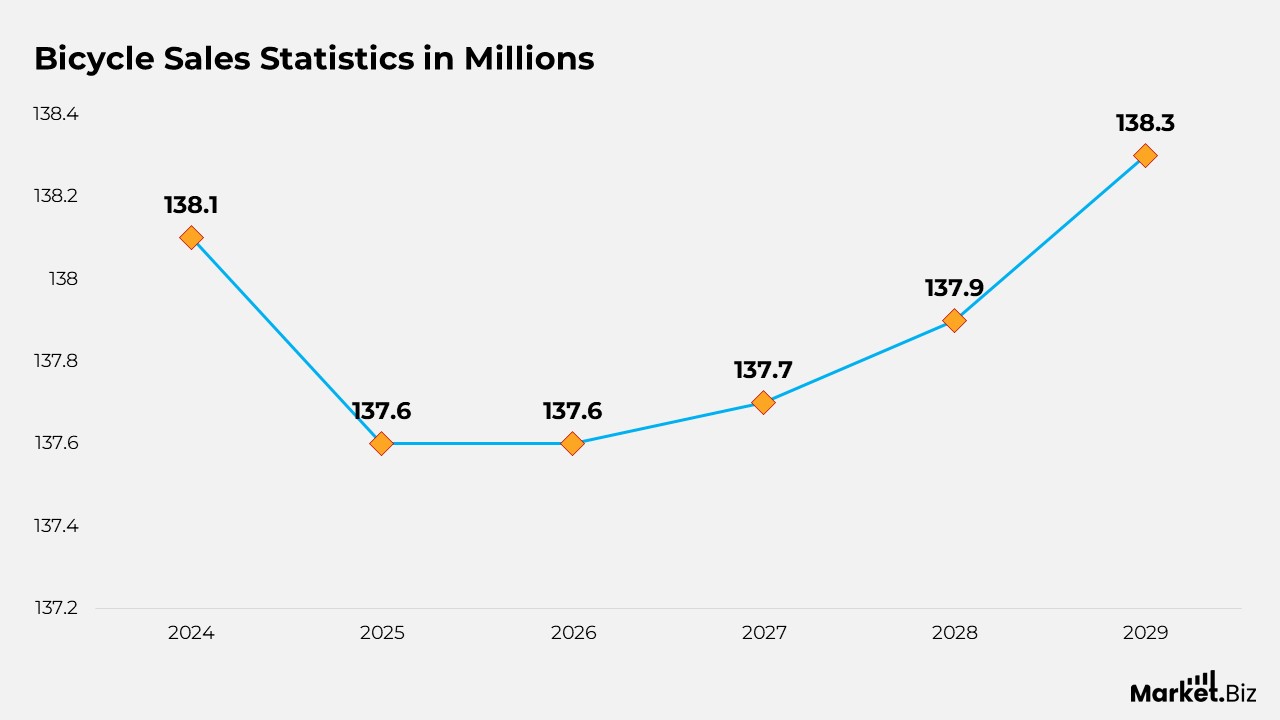
- In 2029, unit sales in the Bicycle industry are forecasted to approach nearly 138.30 million bicycles.
- When examining the pricing aspect of the Bicycle industry, the volume-weighted median price in 2024 was anticipated to be $0.45k.
- In 2024, from a global perspective, China is expected to generate the highest revenue in the Bicycle market, with a forecasted $12,370 million.
- The global bicycle industry is experiencing a rise in value due to the growing popularity of e-bicycle cycling as a leisure activity and its environmentally friendly transportation mode.
Bicycle Market Size
- The global bicycle market has undergone significant fluctuations and growth over the last decade, achieving a compound annual growth rate (CAGR) of 2.1%.
- In 2018, the market revenue stood at USD 34.57 billion, which rose to USD 38.17 billion in 2019.
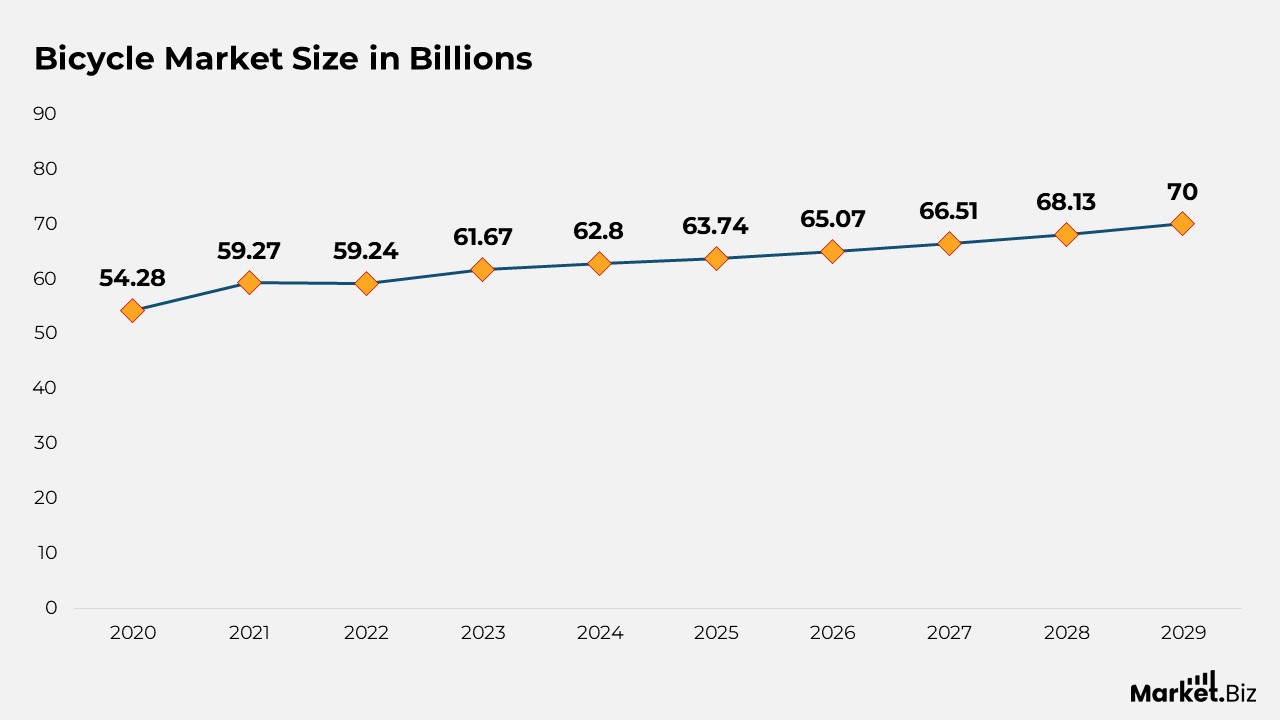
- A considerable increase was observed in 2020, with revenues soaring to USD 54.28 billion, followed by a modest increase to USD 59.27 billion in 2021.
- The market experienced a degree of stabilization in 2022 at USD 59.24 billion but resumed its growth line in the following years, reaching USD 61.67 billion in 2023 and USD 62.80 billion in 2024.
- Forecasts suggest ongoing growth, with the market anticipated to reach USD 63.74 billion in 2025, USD 65.07 billion in 2026, and USD 66.51 billion in 2027.
- Further expansion is expected, with revenues projected to attain USD 68.13 billion in 2028 and USD 70.00 billion by 2029.
Bicycle Market by Country
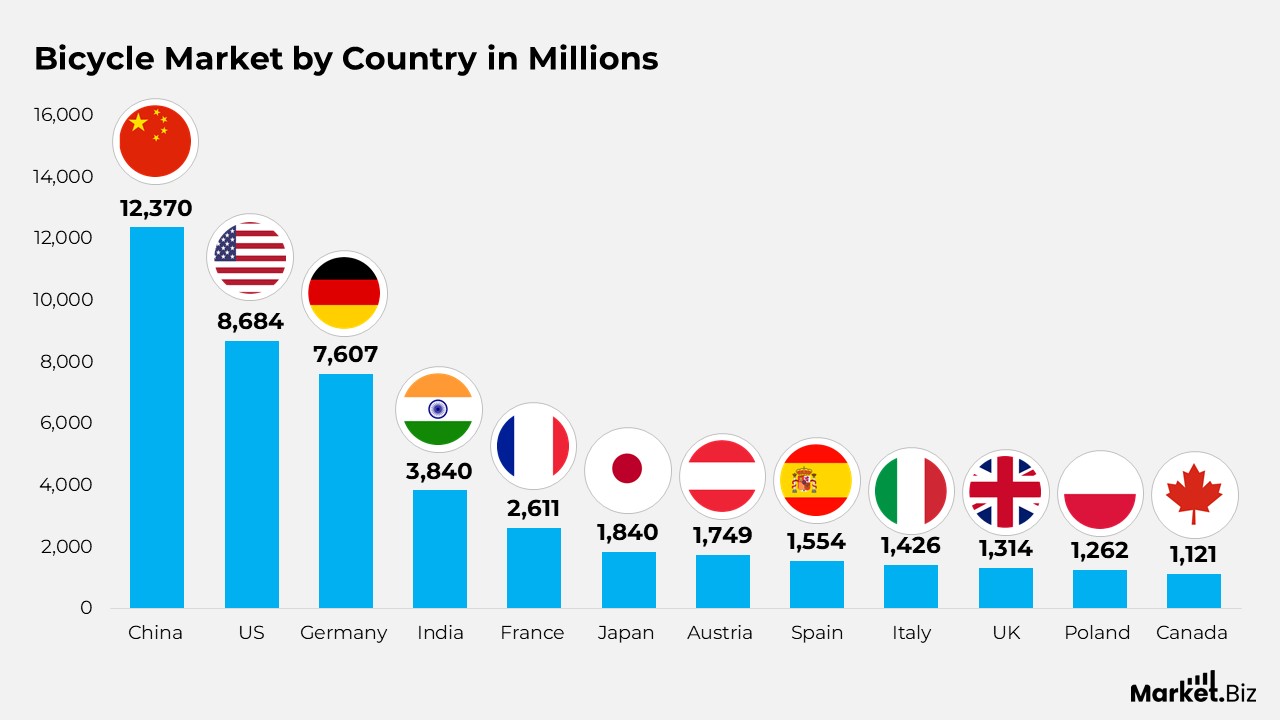
- The global bicycle market is characterized by significant revenue contributions from various countries.
- China is at the forefront of the market, generating a revenue of USD 12,370 million, followed by the United States with USD 8,684 million and Germany with USD 7,607 million.
- India’s contribution amounts to USD 3,840 million, while Japan and France yield revenues of USD 1,840 million and USD 2,611 million, respectively.
- Italy, Spain, and Austria also report notable revenues of USD 1,426 million, USD 1,554 million, and USD 1,749 million, respectively.
- The United Kingdom contributes USD 1,314 million to the market, with Poland and Canada adding USD 1,262 million and USD 1,121 million, respectively.
Statistics of Bicycle Lane
- The presence of a bike lane on a heavily trafficked road leads to a 285% reduction in the risk of injuries.
- The bike lane encourages nearly 2.5 times more cyclists compared to areas lacking cycling infrastructure.
- The existence of the bike lane has resulted in a decrease in the number of cyclists who feel unsafe while riding.
- The construction and enhancement of cycling facilities can lead to a 45% decrease in traffic-related problems.
- Nearly half of the women in the United States are likely to increase their cycling frequency when bike lanes are available.
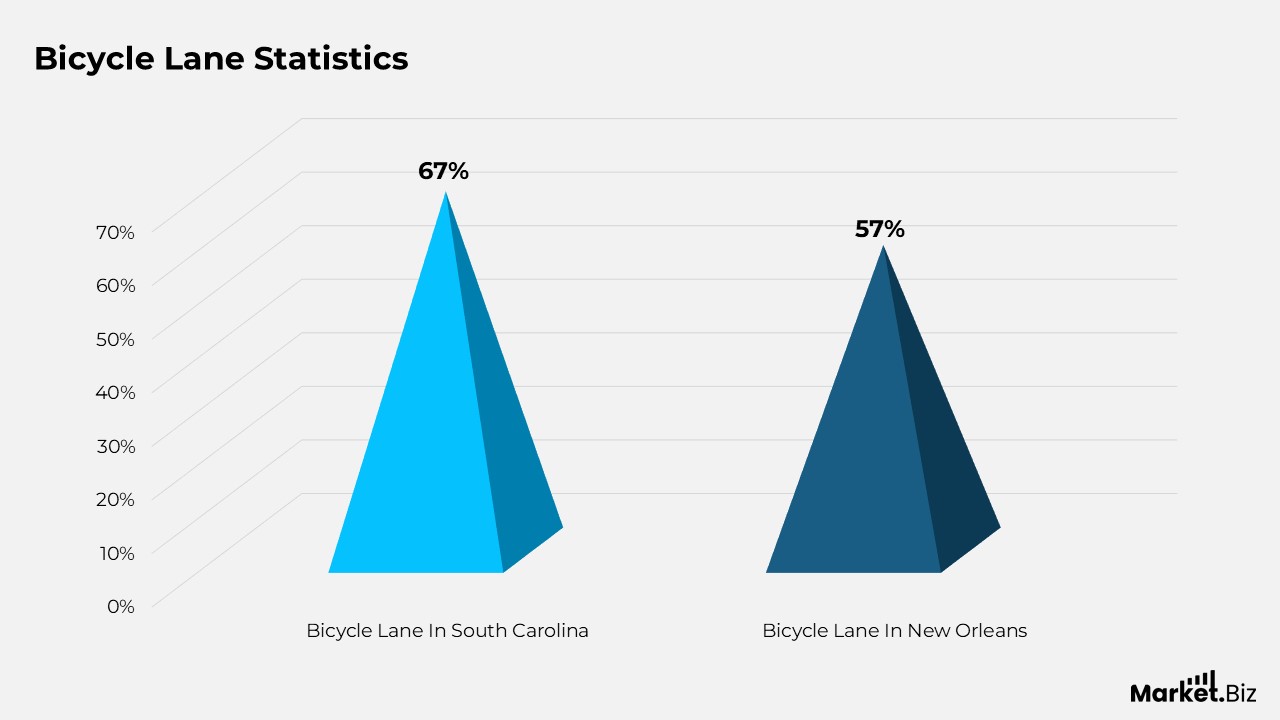
- In South Carolina, approximately 67% of residents adjusted their activity levels based on the establishment of bike and pedestrian pathways.
- In New Orleans, about 57% more individuals took up cycling following the installation of the bike lane.
- Although automobiles remain the primary mode of transportation for Americans commuting to work, bicycles are gaining popularity in various regions.
- Numerous cities across the United States are striving to improve their reputation as cyclist-unfriendly by implementing a multitude of bike lanes.
- San Diego has the largest number of on-street bike lanes in the nation, totaling 620 miles, while Tucson closely follows with 610 miles of bike lanes. Both cities are enhancing the safety and convenience of cycling.
- Since 2009, Tucson has been actively advocating for cycling, having introduced a regional plan that encompasses.
Bicycle Sales Statistics
- In 2015, the number of bicycles sold reached 117.60 million, experiencing a slight decline to 114.00 million in 2016.
- The market saw a recovery in 2017, with sales increasing to 118.30 million, and continued to expand, achieving 121.90 million in 2018 and 125.00 million in 2019.
- A notable increase was observed in 2020, as unit sales rose to 145.00 million, followed by a modest rise to 146.30 million in 2021.
- Nevertheless, the market faced a downturn in 2022, with sales falling to 140.4 million and more reducing to 139 million in 2023.
- The downward trend continued, with sales recorded at 138.10 million in 2024 and 137.60 million in both 2025 and 2026.
- A slight increase is anticipated for the upcoming years, with unit sales projected to reach 137.70 million in 2027, 137.90 million in 2028, and 138.30 million by 2029.
Bicycle Demographics
- In the United States, cycling ranks as the third most favored outdoor activity, with over 51 million Americans engaging in biking annually.
- Approximately 870,000 Americans, representing 0.6% of the total workforce in the US, commute to their jobs by bicycle.
- In large urban areas, 1.1% of commuters utilize cycling as their mode of transportation to work.
- Conversely, in regions outside major cities, only 0.3% of employees reach their workplaces by biking.
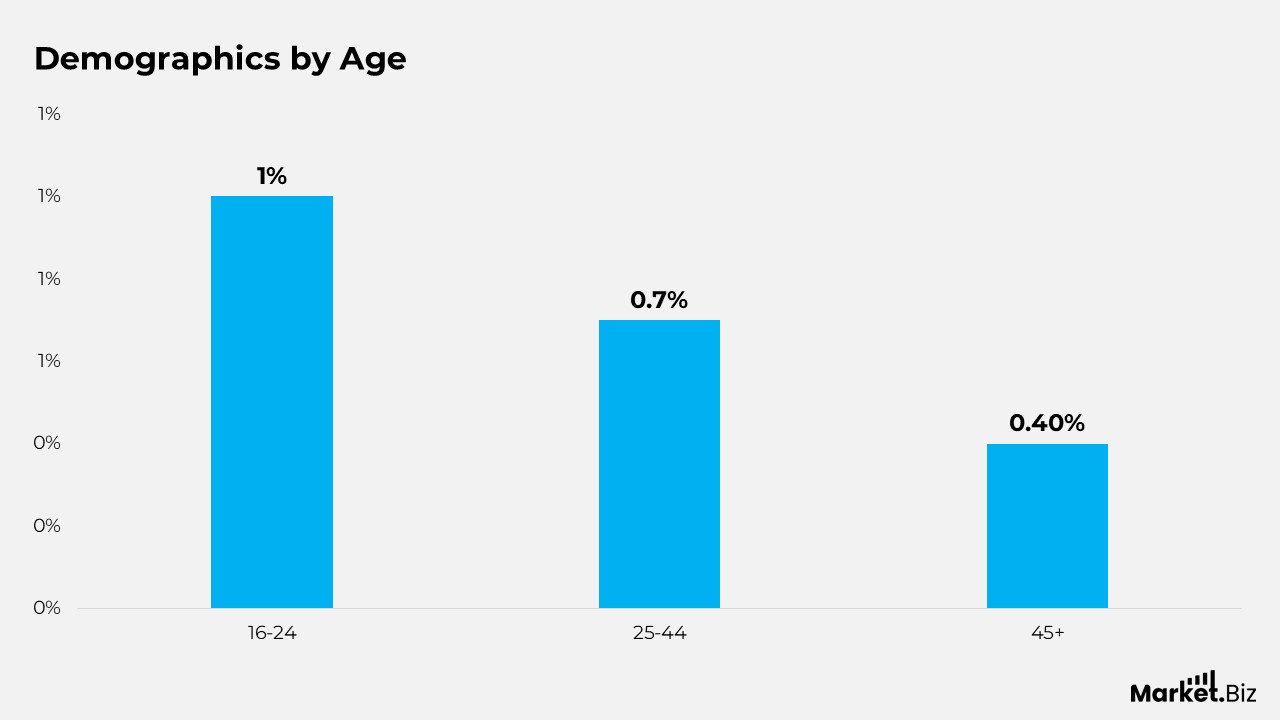
- Among commuters aged 16 to 24, 1% travel to work via cycling.
- For those in the 25 to 44 age group, 0.7% commute by bike.
- Additionally, 0.4% of workers aged 45 and above use bicycles for their commutes.
- In New York City, 100,000 individuals cycle to work on a daily basis.
- The number of Americans commuting by bicycle saw a 21% increase in 2020.
- Since the year 2000, the proportion of individuals biking to work in the US has risen by 43%.
- 51% of American adults engage in biking, compared to 15% who participate in running.
- On a global scale, 42% of households own at least one bicycle, which translates to over 580 million bikes.
- In 2021, cyclists worldwide recorded 10 billion miles and an elevation gain of 480.2 billion feet on Strava.
- In 2020, 103 million individuals rode bicycles.
- For every three male cyclists, there is only one female cyclist.
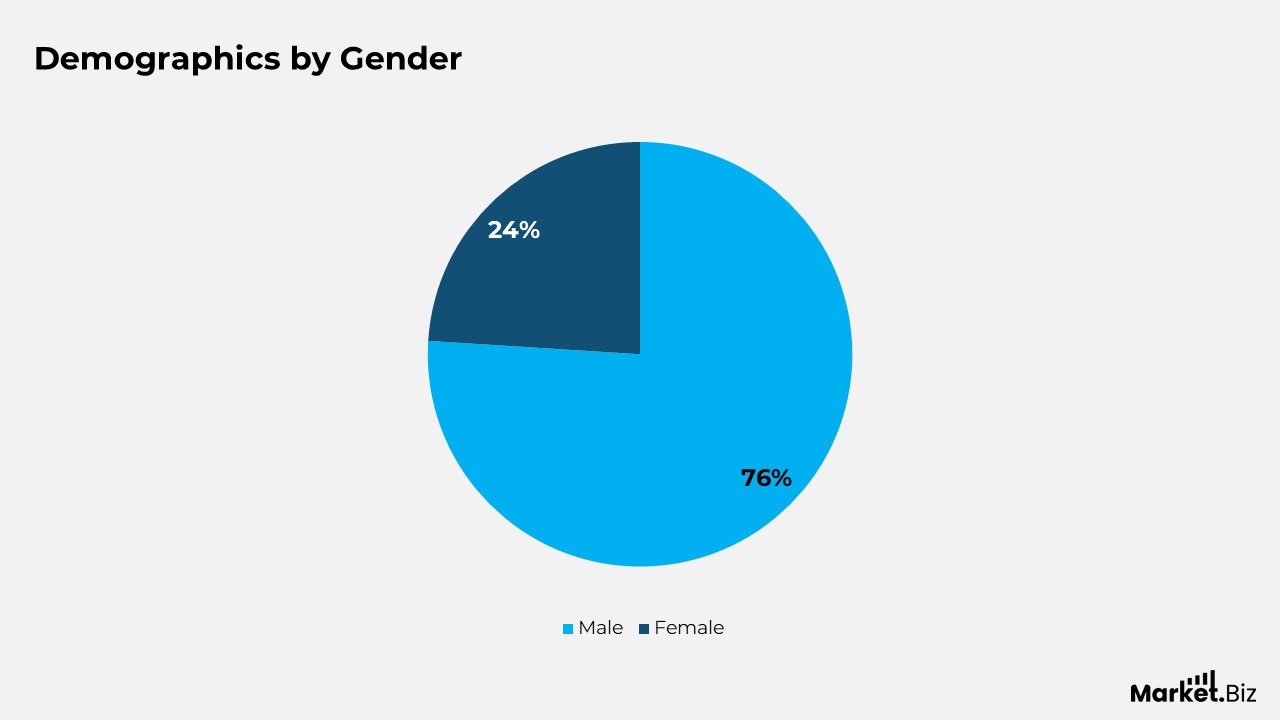
- Among all bicycle trips taken, 76% are made by men, while 24% are made by women.
- The Twin Cities, with a female cyclist percentage ranging from 37% to 45%, have one of the highest proportions of women bikers in the United States.
Speed Statistics of Bicycle
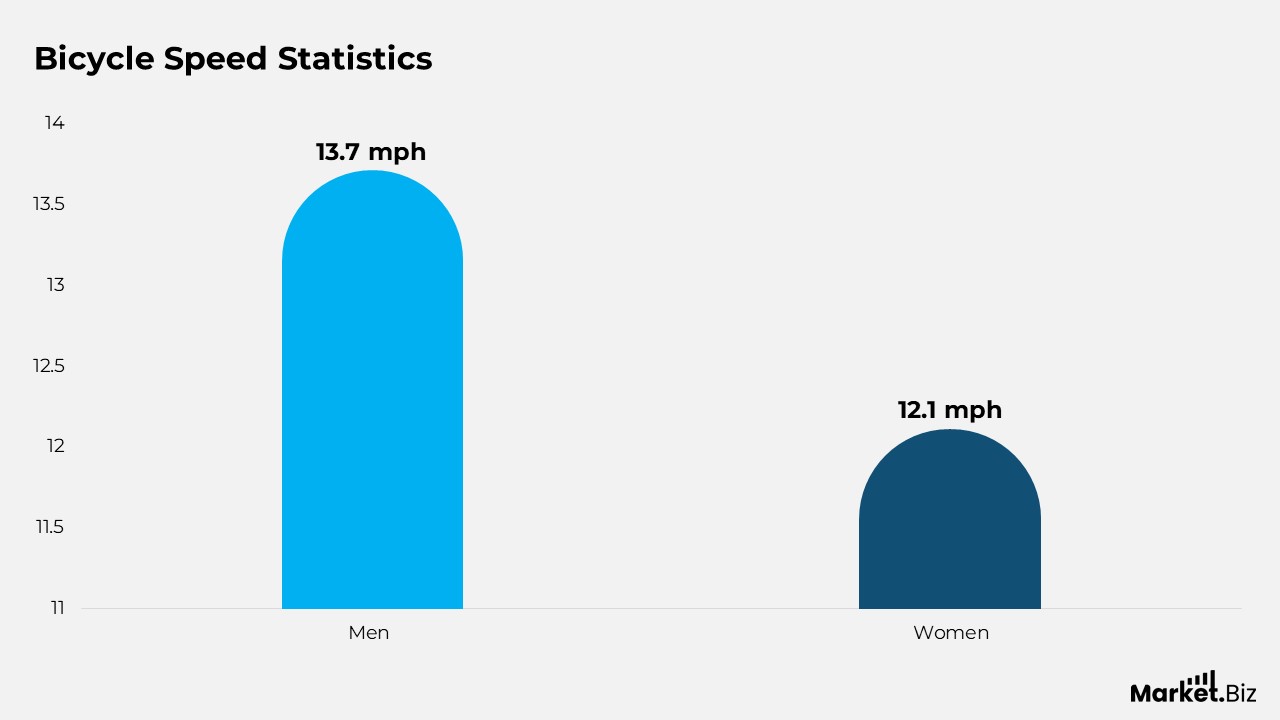
- The worldwide average cycling speed is 13.5 mph.
- The average cycling speed for women is 12.1 mph according to Strava, whereas for men it is 13.7 mph.
- A novice cyclist typically maintains an average speed ranging from 8 to 12 mph.
- An intermediate cyclist rides at an average speed between 12 and 16 mph.
- Advanced and professional cyclists show significantly higher speeds, averaging between 16 to 24 mph and exceeding 24 mph, respectively.
- On bike-specific roadways, the average cycling speed varies from 7.7 mph to 16.4 mph.
- The record for the fastest cycling speed was set by Denise Mueller-Korenek at 183.9 mph in 2018.
- The highest speed recorded on an indoor treadmill is 207.91 mph, achieved by Bruce Bursford.
- In the United States, the average distance for a bike commute is approximately 3 to 4 miles.
Bicycle Accident Statistics
- 2% of all car crash fatalities in the United States involve cyclists.
- The number of deaths resulting from cycling rose by 5% from 2020 to 2021.
- In 2018, around 857 cyclists lost their lives in traffic incidents, with 79% of these fatalities occurring in urban settings.
- Drivers who attempted to overtake cyclists in bike lanes at intersections accounted for 25% of cyclist fatalities.
- Wearing a helmet while cycling can decrease the likelihood of sustaining a head injury by up to 85%.
- Typical commuting hours for cyclists are between 6 AM to 8 AM and 6 PM to 10 PM. As a result, these periods experience low-light conditions and the highest incidence of cycling-related fatalities.
- Downhill mountain bikers experience an injury rate of 43 injuries for every 1,000 hours of cycling.
- 54% of cycling fatalities involve cyclists who were not wearing helmets.
- 29% of cycling death victims were found to be wearing helmets.
- The remaining 17% of cases are undetermined regarding helmet usage.
Exporters of Bicycle
- In 2022, China dominated the export market with a total value of USD 3.83 billion, despite a decrease from USD 5.01 billion in 2021, which represents a negative growth of USD 1.18 billion or –23.50%.
- Chinese Taipei ranked second with an export value of USD 1.76 billion, an increase from USD 1.42 billion in 2021, indicating a growth of USD 0.34 billion or 24%.
- Germany’s exports were recorded at USD 0.95 billion, rising from USD 0.834 billion in 2021, which reflects a growth of USD 0.116 billion or 14%.
- Cambodia reported export figures of USD 0.915 billion, reaching a growth of USD 0.295 billion or 47.60%.
- The Netherlands experienced a slight decline in exports, valued at USD 0.69 billion, down from USD 0.736 billion in 2021, resulting in a decrease of USD 0.04 billion or –6.29%.
- Vietnam’s exports saw significant growth, reaching USD 0.276 billion from USD 0.112 billion, demonstrating a remarkable increase of USD 0.165 billion or 147%.
- Spain recorded export values of USD 0.271 billion, an increase from USD 0.207 billion, reflecting a growth of USD 0.0648 billion or 31.40%.
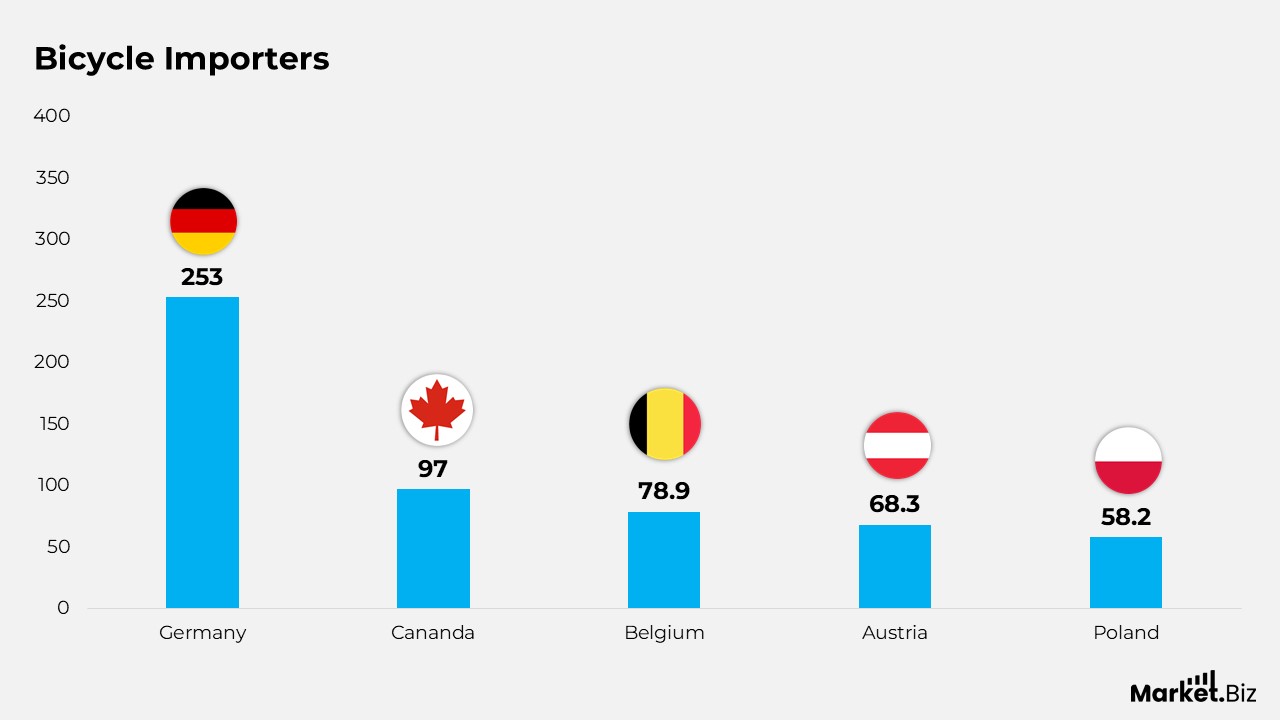
Bicycle Importers
- From 2021 to 2022, Germany emerged as the leading importer of bicycles, witnessing a remarkable increase of USD 253 million.
- Canada ranked second, with bicycle imports growing by USD 97 million.
- Belgium recorded a rise of USD 78.9 million, whereas Austria experienced an increase of USD 68.3 million.
- Poland also noted substantial growth, with bicycle imports rising by USD 58.2 million.
Recent Developments
- The worldwide bicycle market is anticipated to attain a value of $135.02 billion by the year 2030, showing a compound annual growth rate (CAGR) of 9.9% from 2025 to 2030.
- E-bikes are witnessing significant expansion, with certain forecasts suggesting a CAGR of 12.76% leading up to 2030.
- The Asia Pacific region commands the largest share of the market, while Europe is experiencing swift growth attributed to a strong cycling culture and supportive political measures.
- There is an increasing inclination towards cycling as a leisure activity and a means of fitness, with a growing number of individuals opting for bicycles for short-distance travel and outdoor pursuits.
- Applications and services based on smartphones are becoming more integrated with cycling, thereby improving safety, navigation, and the overall cycling experience.
Conclusion
In summary, the bicycle sector is experiencing growth and profitability. By the year 2027, the worldwide bicycle market is projected to attain $64.2 billion, accompanied by an annual growth rate of 4.3%. This expansion is fueled by a growing number of individuals opting for cycling as a means of transportation, recreation, and fitness.
Additionally, there is a notable increase in the popularity of electric bicycles, which is anticipated to further improve growth. Given the rising demand for bicycles, the industry is expected to sustain its profitability and continue its expansion for many years to come.
FAQs
The Netherlands is recognized as the country with the most extensive use of bicycles, boasting a significant percentage of trips conducted by bicycle and a robust cycling culture. Other nations with notable bicycle usage include Denmark and Germany, both of which possess well-established cycling infrastructure and vibrant cycling communities.
John Kemp Starley, the nephew of James Starley, created the first successful “safety bicycle,” known as the “Rover,” in 1885, which he chose not to patent. This bicycle was characterized by a steerable front wheel with considerable caster, wheels of equal size, and a chain drive connected to the rear wheel.
Bicycles of this type were referred to as safety bicycles because they were recognized for, and promoted as, being safer than the high wheel bicycles they replaced. Although contemporary bicycles share a similar design, the term has fallen out of common usage and is now considered outdated, except among those familiar with high wheel bicycles.