Introduction
Conversion Rate Optimization (CRO) Statistics: Conversion Rate Optimization (CRO) is crucial for businesses aiming to enhance their online presence by increasing the proportion of website visitors who complete desired actions, such as making a purchase or subscribing to a newsletter. CRO statistics offer valuable insights into how well various strategies are performing in terms of enhancing user experience, improving website design, and increasing conversions.
By using data-driven techniques like A/B testing and behavioral analytics, businesses can pinpoint areas for improvement and fine-tune user journeys. These statistics not only provide essential benchmarks to gauge industry standards but also help set clear goals, maintain a competitive edge, and drive long-term revenue growth in a digitally evolving landscape.
Editor’s Choice
- The average conversion rate in the SaaS sector is approximately 9.5%.
- In the B2B services sector, the typical conversion rate stands at around 4.94%.
- The finance industry boasts an average conversion rate of 10%.
- Desktop and tablet devices exhibit higher conversion rates compared to mobile devices.
- Social media platforms have an average conversion rate of 2.4%.
- A seamless user experience has the potential to increase conversions by up to 400%.
- The overall average conversion rate across various industries and sectors typically ranges between 2% and 3%.
- The mobile e-commerce market is expected to reach a value of over US$1.54 trillion by 2025 and is expected to grow to US$2.12 trillion by 2030.
- Mobile devices account for 79% of all visits to landing pages.
- Conversion rates are lowest on mobile devices (2.3%), compared to tablets (3.1%) and desktops (2.8%).
- Businesses with 10–15 landing pages experience a 55% rise in conversions, those with 21–40 landing pages see nearly a 300% rise, and businesses with more than 40 landing pages enjoy a 500%+ boost in conversions.
- Using multiple offers on a page can reduce conversions by as much as 266%.
- Around 77% of businesses use A/B testing as a method to enhance their conversion rates.
- Landing pages that lack a navigation menu tend to increase conversion rates by 336%.
- AI-driven personalized recommendations can lead to a 15–20% improvement in conversion rates.
- 20% of all mobile searches are now voice-based.
- Including videos on landing pages has been shown to increase conversion rates by 86%.
General Conversation Rate Statistics
- In April 2024, a significant rise in searches for conversion rate optimization was observed, indicating growing interest in improving website performance.
- The average conversion rate for landing pages across all industries is 2.35%.
- Desktop conversion rates average 4.14%, while mobile conversion rates drop to 1.53%.
- 50% of businesses view conversion rate optimization as a crucial element of their digital marketing strategy.
- An analysis of over 1.3 billion sessions reveals an average bounce rate of 50.9%, with agencies having the lowest conversion rate of 1.7%.
- 45% of visitors who land on a form page convert successfully.
- Reducing site load time by 0.85 seconds can increase conversions by 7%.
- Using red in CTAs can improve conversions by 21%.
- Personalized CTAs can result in a 42% higher conversion rate.
- Forms with just 3 fields tend to have the highest conversion rates.
- Google and Bing boast the highest customer conversion rates at around 8%.
- Companies spend an average of US$2,000 per month on conversion rate optimization tools.
- 46% of all Google searches have local intent, and 81% of consumers consider trust a key factor in purchasing decisions.
Moreover
- Websites that load in 2 seconds or less can see a 15% higher conversion rate on mobile devices.
- 50% of shoppers find images crucial when deciding what to buy.
- Blog posts with lists every 500 words generate 70% more traffic.
- Reducing form fields from 11 to 4 can increase conversions by up to 120%, while asking for a telephone number can decrease conversions by 5%.
- 64% of consumers are more likely to purchase after watching a branded video.
- 81% of sales are made after seven or more interactions.
- Social media has the lowest conversion rate, averaging 1.5%.
- User-generated content rises the likelihood of conversion by over 102%.
- The top 10% of highest-performing pop-ups have a conversion rate of 42.3%.
- The finance and insurance industries have a conversion rate of 15.6%.
- Companies with over 40 landing pages see an increase of more than 500% in conversion rates.
- The travel industry experiences an 8.5% conversion rate for organic search.
- The average win rate for sales leads turning into sales is 21%, with anything above this considered exceptional.
- Pages ranking first in search results typically have a 34%+ click-through rate.
- Adding more landing pages, such as from 10 to 15, can increase leads by 55%.
- Long-form pages can increase leads by 220%.
- Forms with only 3 fields increase conversions to 25%, compared to 15% with 6 fields.
- Most forms typically have 11 fields, and reducing this number to 4 can lead to a 120% increase in conversions.
(Source: Google Trends, Wordstream, Statista, Econsultancy, Matomo, Unbounce, Zuko, WebFx, HubSpot, Mindstamp, NotifyVisitors, Adweek/Motionbox, Semrush, Mailchimp, VWO, Automation Ninjas, Blogging Wizard, Forbes, Landingi, Customer Data Platform Institute, OptiMonk, Ruler Analytics, CrazyEgg, Content Marketing Institute, Jotform, KyLeads, Sixth City Marketing)
Customer Relationship Management Software Market Size
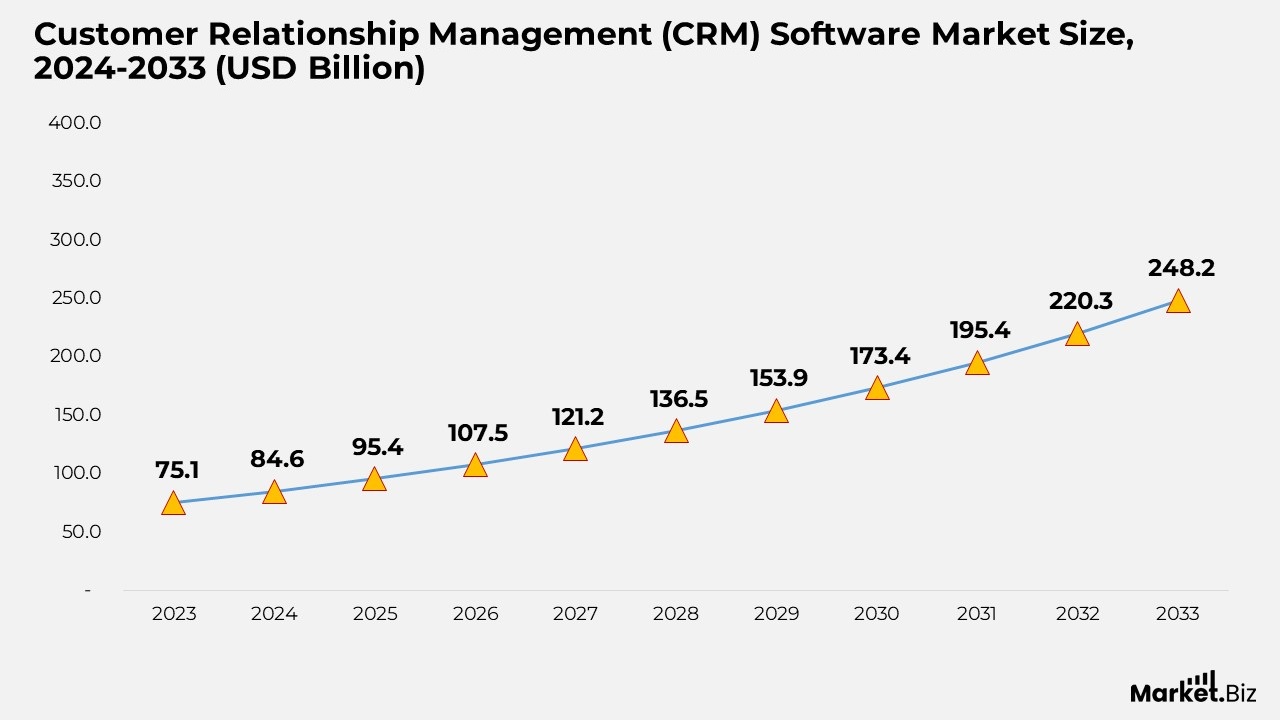
- According to Market.us, the global CRM software market is anticipated to increase from $84.6 billion in 2024 to $248.2 billion by 2033, representing a compound annual growth rate (CAGR) of 12.7% from 2024 to 2033.
- The growth of the market is driven by businesses’ increasing need to strengthen customer relationships, enhance sales efficiency, and gain deeper insights into customer behavior, thereby fueling the demand for advanced CRM solutions.
- In 2023, the customer service sector led the CRM software market with a share exceeding 24.5%, benefiting from businesses’ focus on improving customer support, retention, and overall satisfaction.
- The cloud-based segment arose as the leading positioning mode in the CRM software market in 2023, accounting for over 58.3% of the market share, due to its scalability, flexibility, cost-effectiveness, and the rise of remote work environments.
- In 2023, large enterprises made up more than 63.2% of the CRM software market, as they require powerful, enterprise-level solutions to manage complex customer relationships and vast amounts of data.
- The BFSI segment dominated the CRM software market in 2023, holding more than 23% of the share, driven by the need for efficient customer data management, regulatory compliance, and personalized service in the financial sector.
- In 2023, North America was the leading region in the CRM software market, taking over 37.9% of the market share, attributed to its advanced technological infrastructure, robust business ecosystem, and customer-focused approach, which accelerates CRM adoption.
(Source: Market.us)
CRO Adoption Statistics
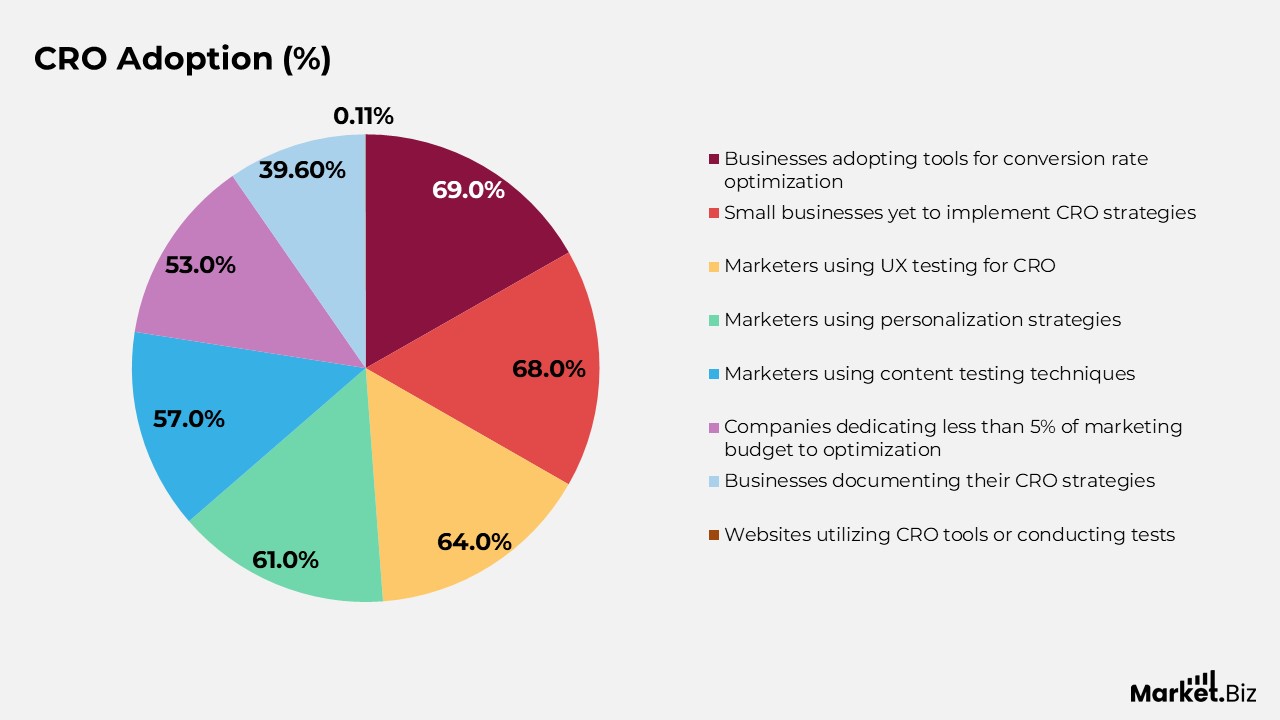
- 69% of businesses have adopted tools and techniques aimed at enhancing conversion rates and measuring user experiences.
- 68% of small businesses have yet to implement conversion rate optimization (CRO) strategies.
- Experience testing is the most frequently utilized content optimization tool by organizations.
- 64% of marketers use UX testing as a part of their conversion rate optimization efforts, while 61% employ personalization strategies, and 57% leverage content testing techniques.
- 53% of companies dedicate less than 5% of their marketing budget towards optimization activities.
- On average, organizations allocate approximately US$2,000 per month on CRO tools.
- 39.6% of global businesses document their CRO strategies.
- Less than 0.11% of websites worldwide utilize CRO tools or conduct tests to optimize their conversion rates.
(Source: DemandSage, Martech, 99 firms, Webfx, optimizely.com, Techreport, Invespro, Outgrow)
Marketers’ Spending on Conversion Rate Optimization (CRO)
- Conversion rate optimization (CRO) can account for nearly 30% of a marketer’s overall budget.
- The cost of CRO tools that assist with conversion rate management and optimization typically ranges from US$10 to US$500 per month.
- On average, companies invest approximately US$2,000 each month on CRO tools.
- Additionally, businesses spend between US$800 and US$10,000 monthly when engaging a CRO service agency.
- While the cost of CRO tools typically ranges between US$10 and US$500 per month, larger organizations tend to allocate an average of US$2,000 each month for both CRO tools and services.
- The global market for CRO software is expected to grow at a compound annual growth rate (CAGR) of 10%.
- In 2018, the CRO software market was valued at US$771 million, with projections indicating it will reach US$1,932 million by 2026.
- Companies utilizing CRO tools on average see a 223% return on investment (ROI).
- A survey by VentureBeat revealed that 173 marketers reported generating returns exceeding 1,000% after implementing CRO tools.
- Conversely, 5% of respondents in the same survey failed to achieve an ROI of even 223%.
(Source: DemandSage, Notify Visitors, WebFx, PPC masterminds, VWO )
Conversion Rates by Industry
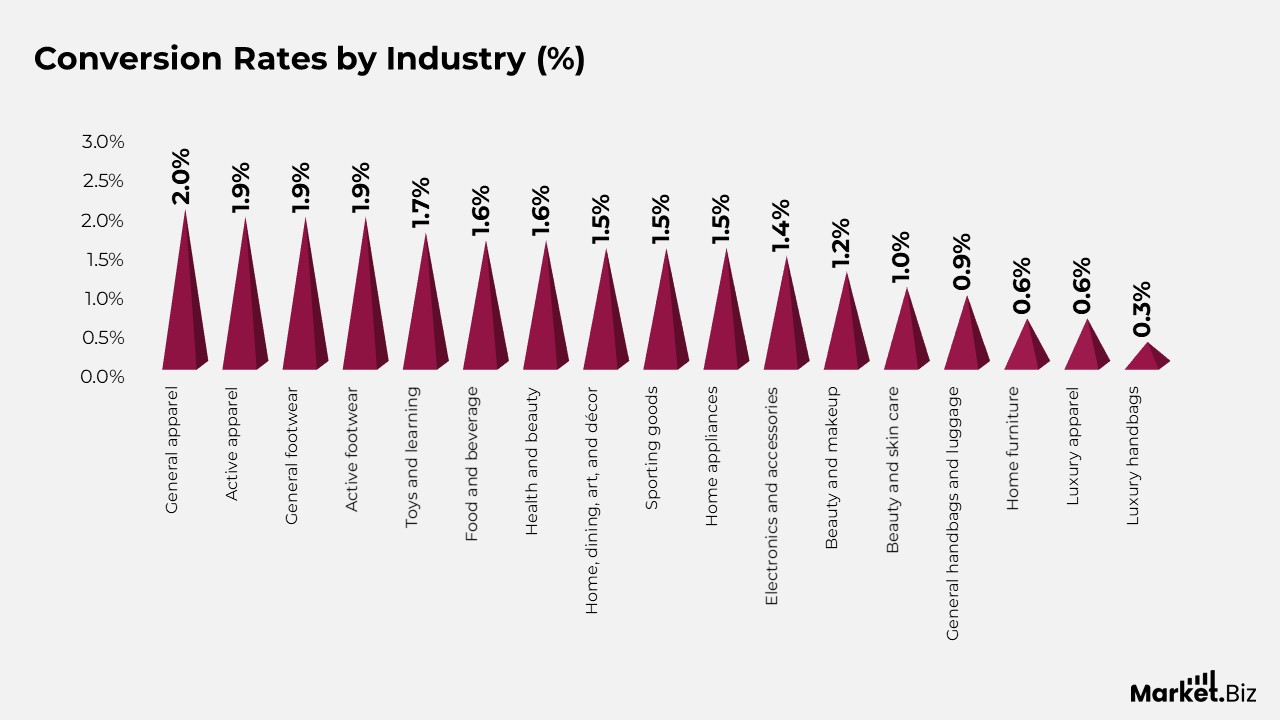
- General apparel had the highest conversion rate at 2% in Q1 2024.
- Active apparel, general footwear, and active footwear each recorded a conversion rate of 1.9%.
- Toys and learning saw a conversion rate of 1.7%.
- Food and beverage and health and beauty both achieved a conversion rate of 1.6%.
- Home, dining, art, décor, sporting goods, and home appliances all had a 1.5% conversion rate.
- Electronics and accessories had a slightly lower conversion rate of 1.4%.
- Beauty and makeup recorded a 1.2% conversion rate.
- Beauty and skin care achieved 1%.
- General handbags and luggage had a conversion rate of 0.9%.
- Home furniture and luxury apparel each saw a conversion rate of 0.6%.
- Luxury handbags had the lowest conversion rate at 0.3%.
(Source: Shopify, Statista )
Conversion Rate Strategies for Optimizing Performance Across Industries
- A bounce rate refers to the percentage of visitors who land on a website and leave without interacting with any other pages. Websites typically experience bounce rates ranging from 26% to 70%, with higher rates generally indicating lower conversion success.
- The average conversion rate for the B2B industry is 2.1%, while professional services lead with 4.6%. The finance industry follows at 3.1%, and travel has an average rate of 2.4%. Higher education and colleges report a 2.8% conversion rate.
- The art and craft industry boasts the highest conversion rate, ranging from 3.84% to 4.07%.
- Facebook ads achieve an average conversion rate of 8.24% across various industries. Conversion rates vary by industry, with fitness studios having the highest at 14.29%, followed by education at 2.78%, employment and jobs at 11.73%, and healthcare at 3.20%.
- 74% of marketing professionals consider lead conversion a top priority.
- Organic leads generate over 90% of website traffic, with a conversion rate of 53%, significantly outperforming paid leads, which have a conversion rate of 2.35%.
Moreover
- The average conversion rate from SEO for B2B sites is 2.1%, while B2C sites see a slightly higher average of 2.6%.
- Placing the Click-Through Rate (CTR) just already the fold can increase conversion rates by 317%.
- Titles that contain questions receive 15% more clicks compared to standard titles.
- Including clickable CTAs in blog posts can boost conversion rates by 121%.
- User-generated content serves as a powerful conversion driver, improving rates by 3.2%.
- B2C websites with a 1-second load time have 2.5 times higher conversion rates compared to those with longer loading times.
- Blog titles with 40 to 50 characters generate 8.5 times higher click-through rates.
- Removing the navigation bar from a landing page can double the conversion rate.
- Personalized CTAs result in a 202% higher conversion rate.
- Adding a floating coupon on landing pages increases the Click-Through Rate by 12%.
- Articles with 3,000 words tend to double conversion rates and receive 24% more shares compared to shorter articles.
- For every additional second it takes a page to load, ecommerce conversion rates drop by 0.3%.
- The average conversion rate for a blog visit to lead ranges from 1% to 3%.
(Source: Meetanshi Technologies LLP, Statista, DemandSage)
Conversion Rate Optimization Spending
- A survey found that over half of businesses allocate less than 5% of their total budget to conversion rate optimization (CRO), indicating that many companies are underinvesting in this crucial area.
- As awareness of the importance of CRO grows, 55% of businesses are planning to boost their CRO budgets shortly.
- CRO tools are gaining popularity, with companies now spending an average of US$2,000 on these tools to improve their conversion rates.
- The global market for CRO software was valued at US$771 million in 2018 and is projected to grow at a rate of 10%, reaching US$1,932 million by 2026.
- Integrating live chat features on websites has the potential to boost revenue by 40% and increase conversion rates by 48%.
- Adding exit pop-ups to a website can lead to a 2% to 5% increase in conversion rates by encouraging users to take action before they leave the site.
(Source: Meetanshi Technologies LLP, Statista, DemandSage)
Email Marketing Conversion Statistics
- Around 361 billion emails are sent worldwide daily, but only 3.61 billion emails result in conversions.
- The average conversion rate for email marketing is 17.75%.
- The conversion rate for email marketing campaigns, based on click-through rates, averages 15.22%.
- Emails with personalized subject lines are 22% more likely to be opened.
- Interestingly, emails without a subject line see an open rate 8% higher than those with a subject line.
- Cart recovery emails lead to conversions 8.24% of the time.
(Source: DemandSage, Adoric, Fit small businesses, Constant Contact, Porch Media, SNOV)
Bounce Rate Statistics
- The average bounce rate across all sectors on the web ranges from 26% to 70%.
- Mobile devices experience the highest bounce rate, with an average of 51%.
- The apparel industry, a leading niche, has an average bounce rate of 45%.
- A 1-3 second webpage load time can increase the likelihood of a bounce by 32%.
- A 1-6 seconds load time raises the bounce rate probability by 90%.
- If a webpage takes 1-10 seconds to load, the bounce rate probability increases by 123%.
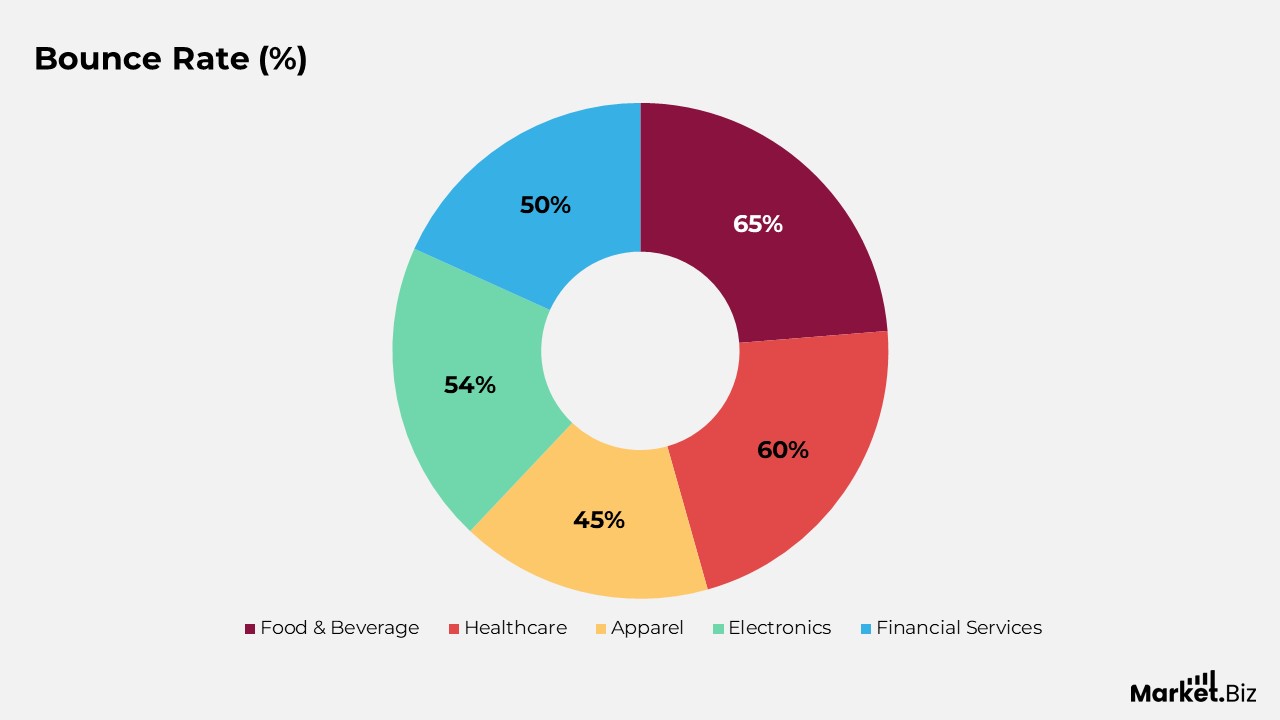
- The average bounce rate in the food and beverage industry ranges from 55% to 65%.
- In the healthcare sector, the bounce rate averages at 60%.
- Apparel websites experience an average bounce rate of 45%.
- The electronics industry sees a bounce rate of 54%.
- For financial services, the average bounce rate is 50%.
- The bounce rate for SaaS (Software as a Service) is typically 65%.
(Source: DemandSage, Hubspot, Semrush, Inc., Capturly, Nvisage Digital)
Average Conversion Rate
- Website conversion rates typically range from 2% to 5% on average.
- The top 25% of websites achieve conversion rates of 5.31% or higher.
- Landing pages of the top 10% of websites have conversion rates approaching 12% or above.
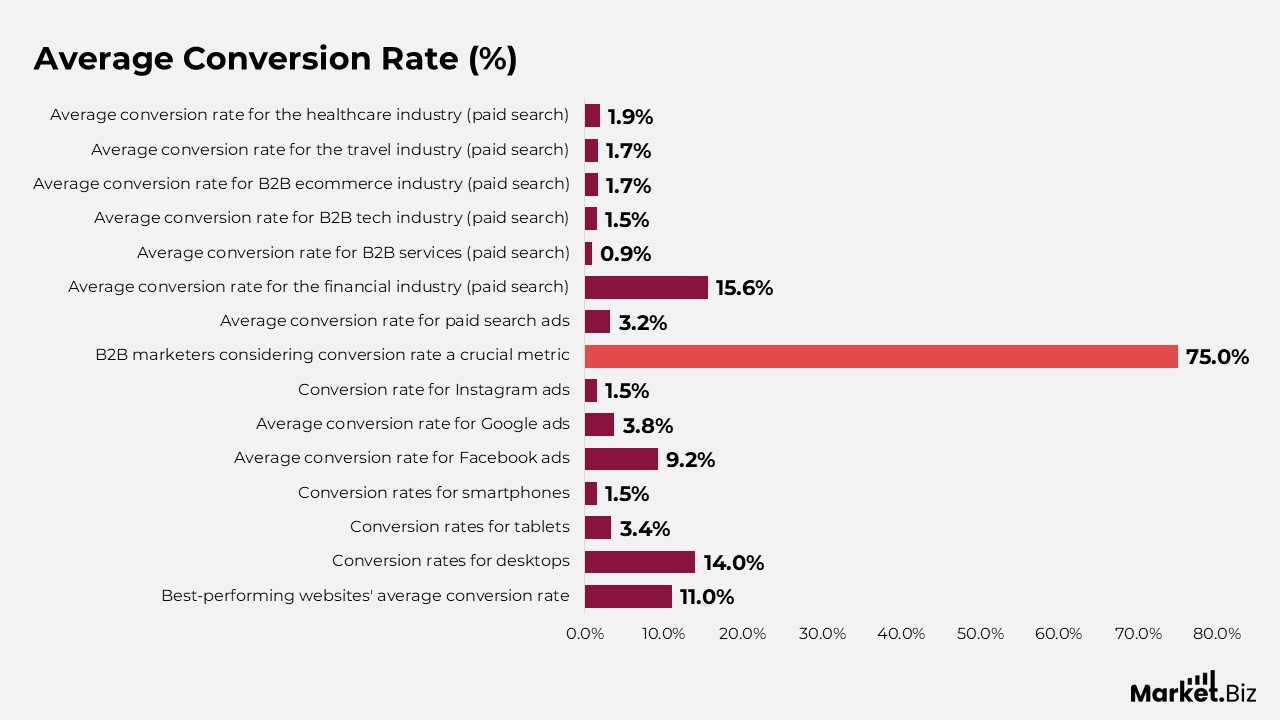
- The best-performing websites are noted to maintain an average conversion rate of 11%.
- Conversion rates for desktops are recorded at 14%, while tablets and smartphones have conversion rates of 3.36% and 1.53%, respectively.
- The average conversion rate for Facebook ads is 9.21%.
- Google ads see an average conversion rate of 3.75%, while Instagram ads have a conversion rate of 1.5%.
- 75% of B2B marketers consider conversion rate a crucial metric for assessing a landing page’s effectiveness.
- Paid search ads typically generate an average conversion rate of 3.2%.
- The financial industry records the highest paid search conversion rates, with an average of 15.6%.
- On the other hand, B2B services have the lowest paid search conversion rate, averaging only 0.9%. Other industries with similarly low conversion rates include:
- B2B tech industry: 1.5%
- B2B ecommerce industry: 1.7%
- Travel industry: 1.7%
- Healthcare industry: 1.9%
- Inbound marketing strategies can potentially boost conversion rates for an average website by 6% to 12%.
(Source: DemandSage, Geckoboard, Popsmart.com)
CRO Challenges Statistics
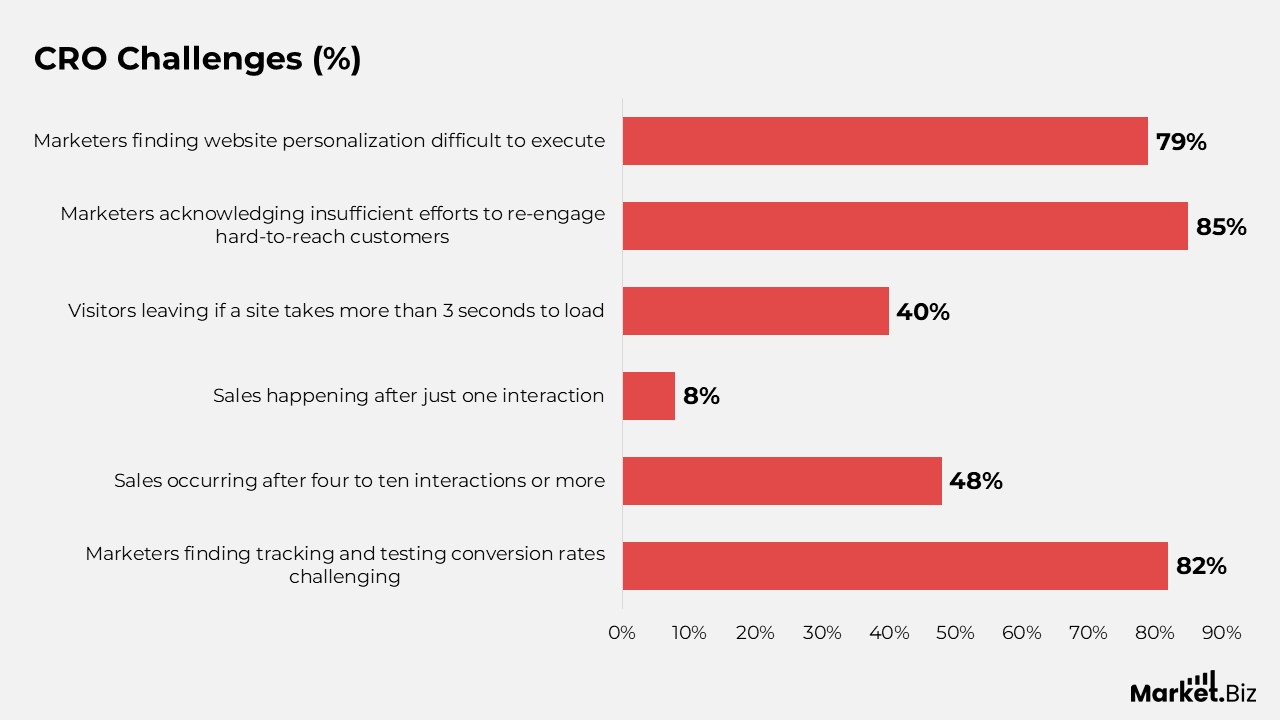
- 82% of marketers find tracking and testing conversion rates to be a highly or moderately challenging task.
- More than 48% of sales occur after four to ten interactions or more, while only 8% of sales happen after just one interaction.
- On average, over 40% of website visitors leave if the site takes more than 3 seconds to load, highlighting the critical need to improve website loading speed.
- 85% of marketers acknowledge they are not making enough effort to re-engage hard-to-reach customers on their websites.
- Post the Covid-19 pandemic, the two primary challenges in conversion rate optimization are securing buy-in from decision-makers and the necessity for improved processes.
- According to 79% of marketers, website personalization is either somewhat or very difficult to execute.
(Source: Transaction Agency, NotifyVisitors, RAIN Group, SwayHub, Kyleads, CXL, Econsultancy)
Conclusion
Conversion Rate Optimization (CRO) is an essential but challenging component of digital marketing. Marketers face difficulties in effectively tracking and testing conversion rates, as well as in re-engaging hard-to-reach customers. Site speed plays a critical role in retaining visitors, with even small delays leading to significant abandonment. Post-pandemic, businesses continue to grapple with securing support from decision-makers and refining their CRO processes.
Despite the recognition of personalization’s importance, many still find it difficult to implement effectively. These challenges underscore the need for businesses to continuously improve their CRO strategies to optimize website performance and drive better conversion outcomes..
FAQ’s
Conversion rate optimization (CRO) is the process of enhancing a website’s effectiveness by increasing the proportion of visitors who take specific actions, such as completing a purchase, subscribing to a newsletter, or submitting a contact form.
Marketers face challenges in tracking and testing conversion rates due to the complexity of analyzing user behavior across multiple channels and accurately interpreting data. Optimizing conversions requires continuous adjustments and data-driven strategies to drive meaningful improvements.
It generally takes multiple touchpoints to successfully close a sale, with most transactions happening after four or more interactions. This highlights the necessity for businesses to nurture relationships with potential customers throughout their buying journey.
Website loading speed is crucial to retaining visitors. A delay of just a few seconds can cause significant abandonment, leading to lower conversion rates. Ensuring fast page load times is essential for improving the user experience and increasing conversions.
Many marketers struggle to re-engage hard-to-reach customers due to factors like limited resources, lack of effective strategies, or failure to target the right segments. Re-engaging these customers requires a focused approach and sustained effort to capture their attention and encourage action.