
Introduction
E-Commerce Statistics: E-commerce has significantly transformed the global retail sector, altering consumer shopping habits and business operations. The transition to online shopping has been fueled by the increasing use of digital platforms, mobile commerce, and the convenience of shopping from anywhere at any time.
With consumers demanding more personalized and seamless experiences, companies are enhancing their online presence by incorporating technologies like artificial intelligence and machine learning to meet these expectations. This shift has also led to the rise of global marketplaces, enabling large retailers and small businesses to access a wider customer base.
Furthermore, improving logistics, payment systems, and cybersecurity has become crucial, as e-commerce continues to reshape traditional retail models. As consumer behavior evolves in this digital-first environment, businesses must remain flexible to capitalize on new opportunities and stay competitive in a rapidly growing online market.
Editor’s Choice
- The global number of online shoppers stands at 2.77 billion.
- By 2025, it is projected that 21% of retail purchases will be made online, with this share increasing to 22.6% by 2027.
- E-commerce sales are expected to exceed $6.8 trillion in 2025.
- There are currently over 28 million e-commerce stores worldwide.
- 52% of online shoppers search for products internationally.
- 34% of consumers make online purchases at least once a week.
- Almost 99% of online shoppers check reviews before making a purchase.
- Over a third of customers spend less than $200 on online shopping annually.
- 49% of shoppers begin and end their shopping experience on retailer websites or apps.
- More than 50% of consumers consider fast and reliable shipping as a top priority.
- 47% of shoppers seek help through live chat during their online shopping journey.
- 70% of shoppers prefer using smartphones for their online purchases.
- High prices are the leading cause of cart abandonment, affecting 34% of Millennials, 45% of Gen Z, and 32% of Gen X and Boomers.
- 24% of online shopping activity occurs during the holiday season.
- On the most recent Prime Day, Amazon sold over 100,000 items per minute.
- 85% of global consumers engage in online shopping.
- 53% of U.S. consumers shop on social media platforms at least once a week.
- China accounts for more than half of the global e-commerce retail sales.
- 40% of online shoppers have avoided purchasing from a brand due to concerns over personal data security.
E-commerce Market Size
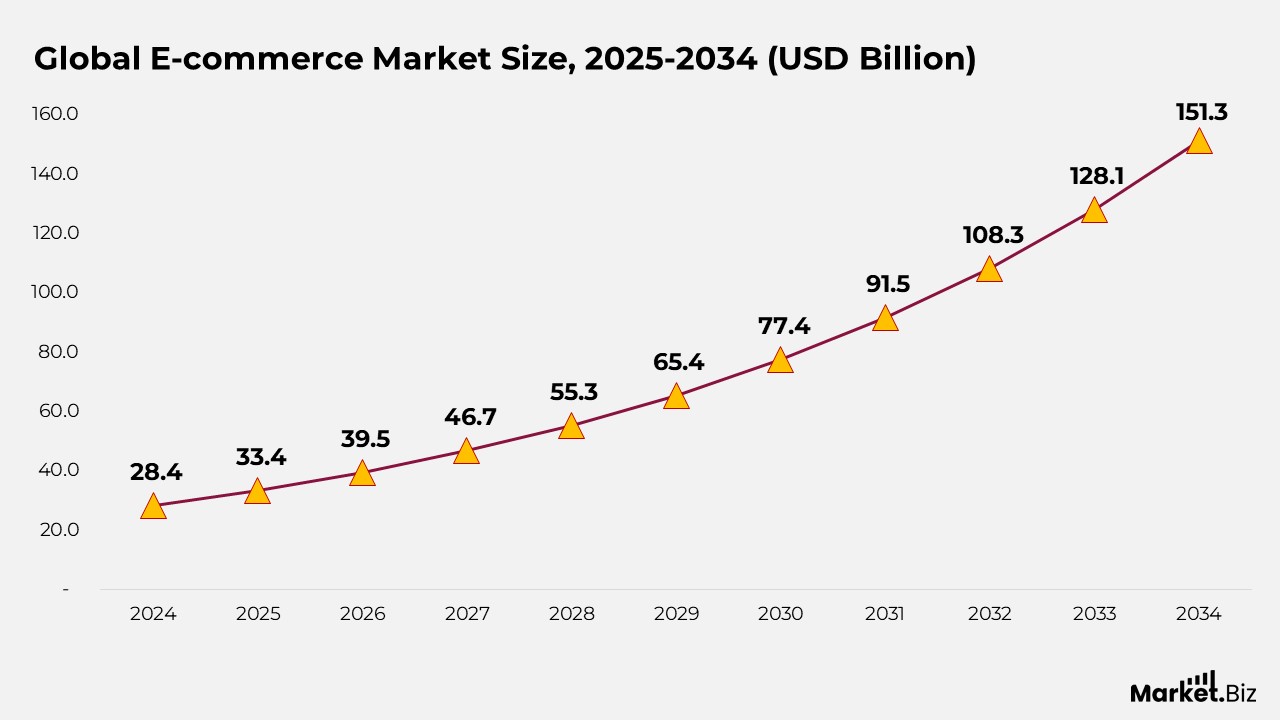
- According to Market.us, the global e-commerce market is expected to rise from $33.4 billion in 2025 to $151.3 billion by 2034, representing a compound annual growth rate (CAGR) of 18.29% from 2025 to 2034.
- The e-commerce market is fueled by greater internet accessibility, consumers’ growing preference for online shopping, and advancements in payment systems and mobile technology, which have made online shopping more user-friendly, convenient, and secure.
- In 2024, the B2B segment dominated the market with a share of 70.7%, underscoring its critical role in global commerce. This dominance is driven by the increasing need for businesses to optimize supply chains, lower operational costs, and expand their global reach through digital platforms.
- The home appliances segment held a significant 25.9% share of the e-commerce market in 2024, with the surge in demand for convenience, product variety, and the ability to compare prices and reviews online being key growth drivers.
- In 2024, Asia-Pacific (APAC) led the market with a share of 45.7%, generating $12.8 trillion in revenue. This growth is attributed to rapid urbanization, widespread technological adoption, and the expansion of the middle class in the region.
- North America captured 29.8%, while Europe accounted for 16.9% of the market share, bolstered by high consumer purchasing power, advanced digital infrastructure, and widespread internet penetration.
- The U.S. e-commerce market is expected to grow from $925 billion in 2023 to $1,415 billion by 2027, driven by the growth of mobile commerce, increasing consumer confidence in online transactions, and innovations in digital payment systems.
Moreover
- The average e-commerce conversion rate in the U.S. stands at 2.3%, with mobile commerce projected to nearly double to $710 billion by 2025, reflecting the increasing preference for mobile-first shopping and advancements in mobile payment technologies.
- The LAMEA region contributed 7.6% to the global e-commerce market, with growth fueled by rising internet access, smartphone penetration, and increased disposable income, especially in emerging markets such as Latin America and the Middle East.
- Global retail online sales are anticipated to reach $8.1 trillion by 2026, with over 26 million e-commerce stores globally, driven by easier market entry for small businesses and the growth of niche online markets.
- In 2023, approximately 2.64 billion people shopped online, representing 33.3% of the global population, supported by increased adoption of digital technologies and the ease of online shopping.
- 89% of consumers check reviews before making purchases, and 56% initiate their search on Amazon, highlighting the influence of peer reviews and the dominance of large e-commerce platforms in driving purchasing decisions.
- Mobile commerce accounted for 59.9% of global e-commerce revenue, while desktops contributed 37.5%, indicating the growing trend toward mobile-first shopping, offering consumers more flexibility and accessibility.
- Digital wallets represented 49% of global online sales, followed by credit cards at 21%, driven by the popularity of fast, secure, and convenient payment methods.
- Email marketing delivers an average return of $45 for every $1 invested, as businesses leverage personalized marketing strategies to engage customers and drive conversions.
(Source: Market.us)
E-commerce Security Market Size
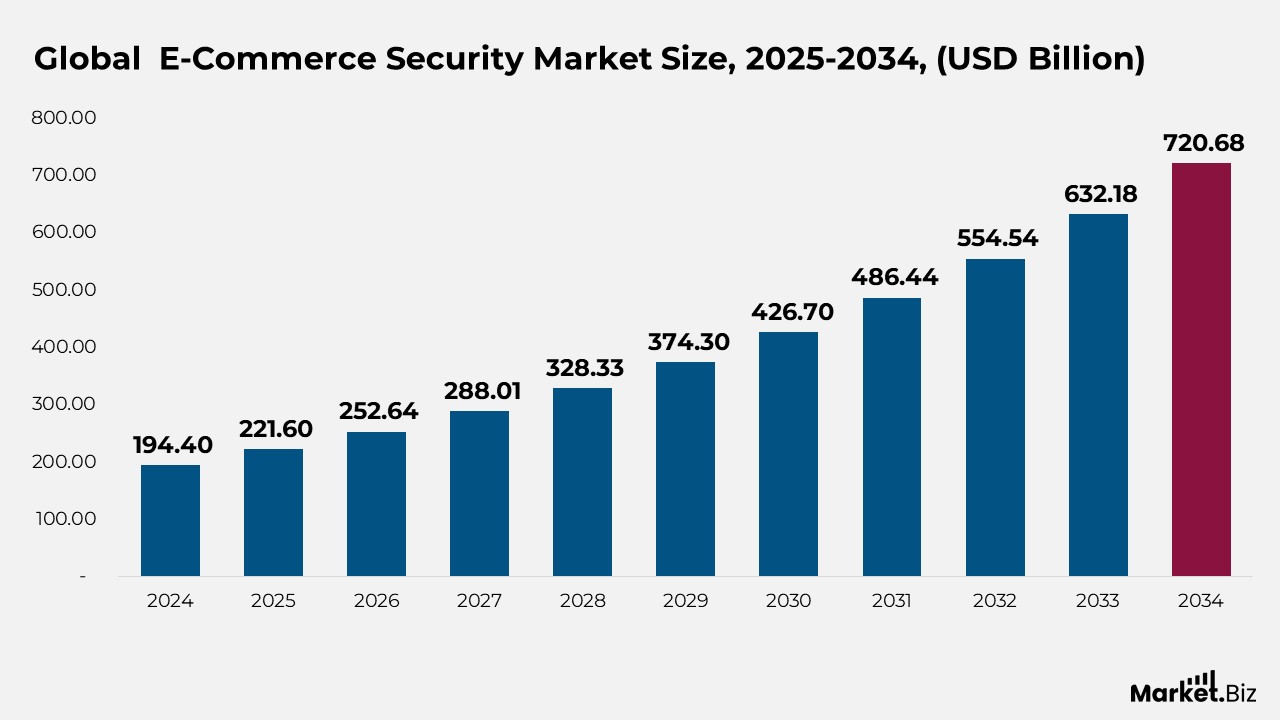
- According to Market.us, the global e-commerce security market is expected to rise from $221.60 billion in 2025 to $720.68 billion by 2034, representing a compound annual growth rate (CAGR) of 14% from 2025 to 2034.
- The e-commerce security market is growing due to the rise in cyberattacks and the expansion of online retail, with cyber threats like phishing, malware, and ransomware driving the need for stronger security measures.
- In 2024, the network security segment held a dominant share of 26% in the global e-commerce security market, driven by the need to protect platforms from sophisticated cyberattacks such as DDoS, malware, and unauthorized access.
- In 2024, the encryption segment captured 20% of the global e-commerce security market, driven by the need to secure sensitive customer data, including payment and personal information, from cybercriminals.
- In 2024, the retail segment held a dominant market position with a 40% share, driven by the growth of online retail and increased digital transactions, making it a prime target for cyberattacks like payment fraud and data breaches.
- In 2025, the B2C segment is expected to capture 56% of the global e-commerce security market, attributed to the growth of online retail consumers and the rise of digital payments, which increases exposure to threats like identity theft and payment fraud.
- In 2024, North America dominated the global e-commerce security market with a 33.5% share, generating USD 65 billion in revenue, driven by advanced technological infrastructure, high internet penetration, and widespread adoption of digital payment systems.
(Source: Market.us)
General E-commerce Statistics
- As of 2025, there are 2.77 billion online shoppers globally, representing 33% of the world’s population. This marks a 2.2% increase from the previous year.
- The number of online shoppers is projected to rise to 2.86 billion in 2026, driven by growing internet access and the convenience of online shopping.
- China leads the online shopping trend with 904.6 million online shoppers, while the U.S. has 288.45 million online buyers.
- In 2025, 21% of retail purchases are expected to be made online, the highest to date. This share is anticipated to increase to 22.6% by 2027, rising at an average rate of 0.32% annually since 2021.
- China has 904.6 million online shoppers, followed by the U.S. with 288.45 million, making up 33% of the global population of online shoppers.
- In 2023, there were 2.64 billion digital buyers, accounting for 33.3% of the global population, meaning one in every three people prefers to shop online.
- The number of online shoppers continues to grow, with 80 million more digital buyers in 2023 than in 2022, marking a 3.1% year-over-year increase.
- Approximately 80% of internet users in China shop online, contributing significantly to global retail e-commerce sales, owing to its population share of 18.47%.
Moreover
- As of September 2023, there are 26,780,716 e-commerce stores globally, with 26% of online retailers operating on Shopify.
- On average, online shoppers buy 4.95 products per order.
- The global conversion rate for online shoppers is 1.9%.
- High-performing retail businesses are more likely to invest a significant portion of their sales in digital and e-commerce initiatives.
- 68% of social media marketers use social media to drive traffic to their product pages on their websites.
- eMarketer predicts that grocery will become the largest e-commerce category in the U.S. by 2026.
- There was a 20% increase in consumers shifting to e-commerce channels in w.
- The average cart abandonment rate stands at 70.19%.
- Amazon is the largest e-commerce company worldwide, with a market cap of $1.34 trillion.
- 45% of shoppers are drawn to online shopping due to free delivery.
- Most marketers have an employee responsible for managing social commerce within their teams.
(Source: Statista, eMarketer, Boston Consulting Group, HubSpot, McKinsey, Baymard, Data Reportal, SellersCommerce, Hostinger, WAC, Forbes Media LLC, Semrush Inc.)
Social Media Ecommerce Statistics
- 87% of sellers report that social selling has been effective for their business this year.
- 59% of social sellers state that their company is achieving higher sales through social media this year compared to the previous year.
- High-performing salespeople are 12% more likely to leverage social media in their selling strategies.
- Over half of social media marketers utilise social platforms to sell products directly within the apps.
- 50% of marketers plan to increase their budget for selling products directly through social media apps in 2024.
- YouTube, Facebook, and Instagram are the most frequently used platforms by social media marketers for social selling.
- Instagram, Facebook, and TikTok offer the greatest return on investment (ROI) for social selling.
- Social media ranks 3rd in terms of the channels where consumers are most open to advertising.
- Social media marketers who sell products directly within apps indicate that Facebook and YouTube provide the highest ROI.
(Source: HubSpot, Integral Ad Science)
Online Shopping Behavior Statistics
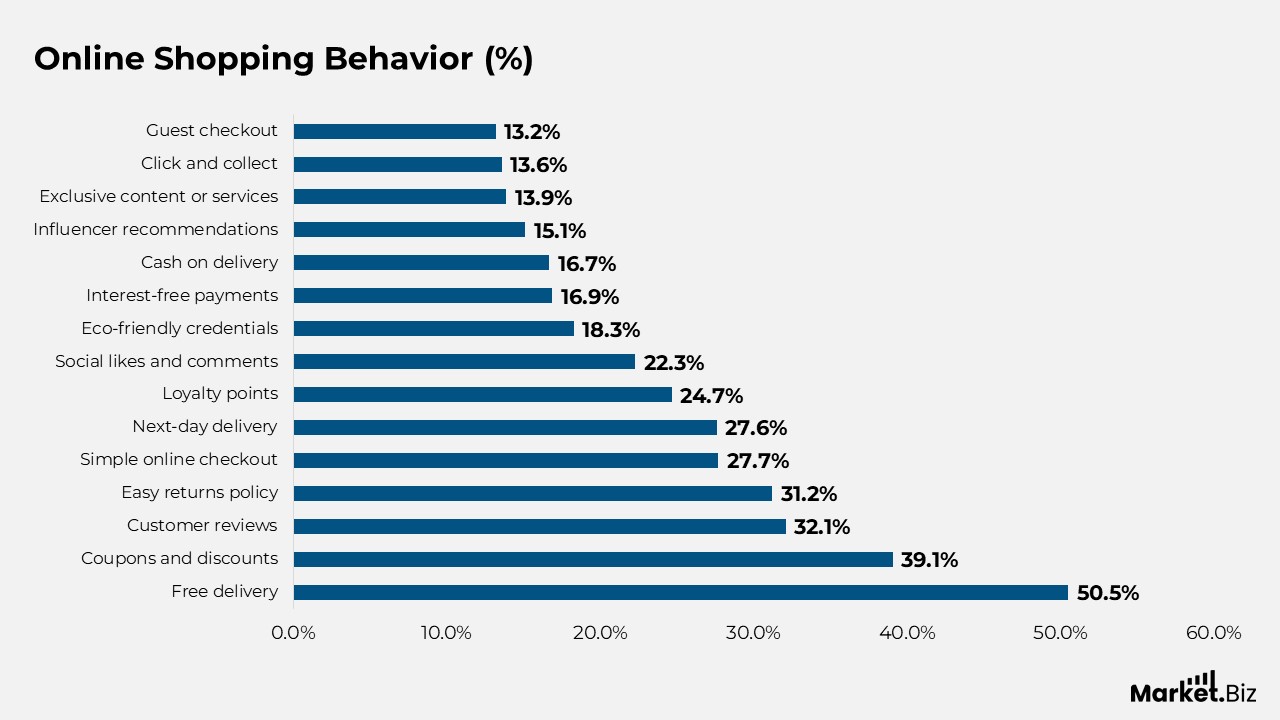
- 50.5% of online shoppers cite free delivery as a top driver for making purchases, followed by 39.1% who are motivated by coupons and discounts, and 32.1% who rely on customer reviews.
- 48% of U.S. consumers report that high additional costs, such as shipping, taxes, and fees, are the primary reason for abandoning shopping carts during checkout.
- Other common reasons for cart abandonment include the requirement to create an account (26%) and concerns about the security of credit card information (25%).
- 43% of U.S. Gen Z consumers indicate that marketplaces were their primary starting point when shopping online in 2024. Another 24% of shoppers start their journey through search engines, 18.5% via their preferred brand’s website, and 12.5% through social media.
- Over 70% of U.S. adults believe that home delivery, free shipping, and the availability of in-stock products are essential for a convenient online shopping experience.
- 66% of consumers consider free shipping a crucial factor when shopping online.
- 50% of shoppers factor in the ease of the checkout process on a retailer’s website or app when choosing where to shop online.
- As of March 2025, the global average shopping cart abandonment rate is 76.22%.
- Nearly 39% of U.S. consumers have already used generative AI during their online shopping experience.
- The most common uses of generative AI in online shopping include product recommendations (47%), finding deals (43%), product research (55%), and gift suggestions (35%).
(Source: DataReportal, Statista, Attest, eMarketer, PYMNTS, Dynamic Yield, Adobe, Semrush Inc)
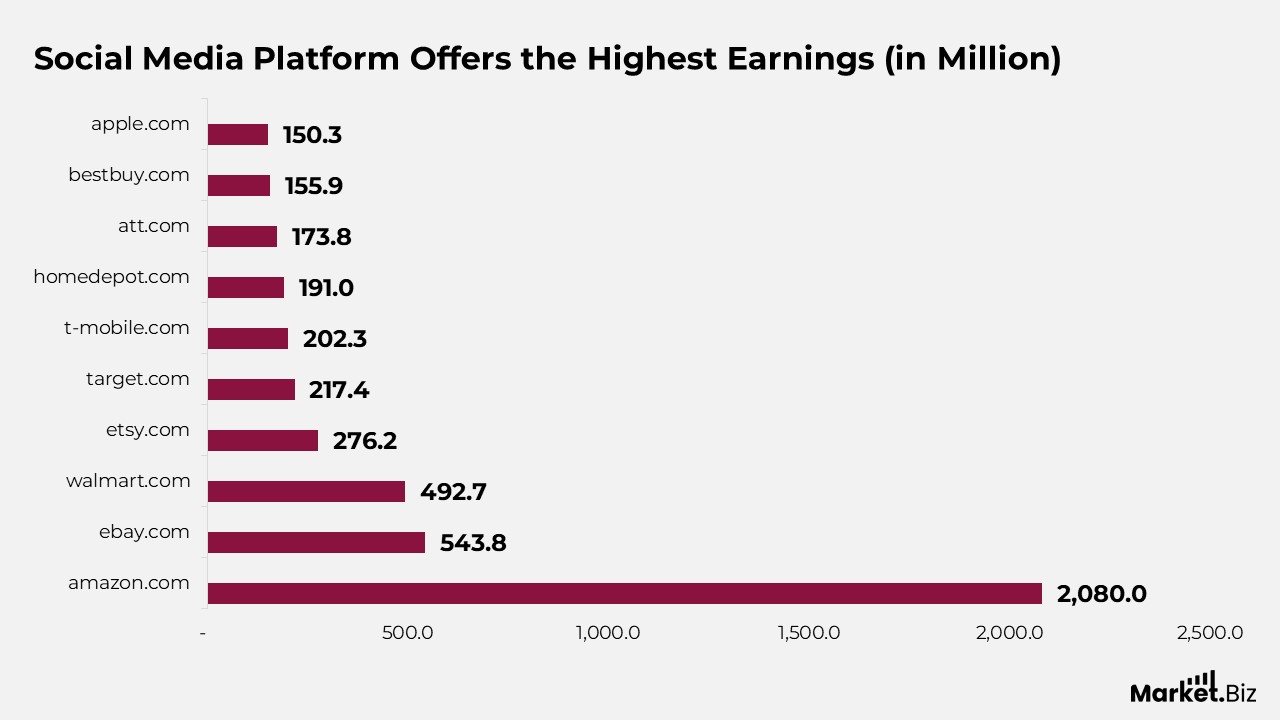
E-commerce Websites Statistics
- Amazon.com draws around 2.08 billion visitors each month.
- eBay.com attracts approximately 543.8 million visits monthly.
- Walmart.com has a monthly traffic of around 492.7 million visitors.
- Etsy.com experiences approximately 276.2 million visits per month.
- Target.com sees about 217.4 million visits every month.
- T-Mobile.com records roughly 202.3 million monthly visits.
- HomeDepot.com garners around 191.0 million visits each month.
- ATT.com has approximately 173.8 million monthly visitors.
- BestBuy.com draws around 155.9 million visits monthly.
- Apple.com receives about 150.3 million visitors every month.
(Source: DataReportal, Statista, Attest, eMarketer, PYMNTS, Dynamic Yield, Adobe, Semrush Inc)
Consumer Behavior and Trends in E-Commerce
- 19% of consumers have contacted customer service via direct messages on social media in the past three months, marking a 45% increase from 2022.
- The majority of consumers (82%) report satisfaction with their most recent social shopping experience.
- Adults aged 18 to 24 represent the largest group of e-commerce shoppers in the U.S.
- China leads the world with the highest number of consumers shopping on social networks.
- Online retail revenue in Asian countries reached 1.7 trillion USD in 2023.
- The most common reasons for cart abandonment are additional costs such as shipping and taxes, followed by the requirement to create an account.
- Gen Z, Millennials, and Gen X prefer discovering products on social media over any other platform.
- Only 47% of social media users feel comfortable making purchases directly through social media apps.
- 42% of consumers trust social media platforms with their personal card information.
- Facebook is the most popular platform for in-app purchases, offering the best shopping experience and earning the highest level of consumer trust.
- TikTok is considered the least trusted platform for in-app shopping.
- The majority of consumers are only somewhat confident that the products they purchase directly on social media will match their descriptions.
- The primary concern for consumers buying directly through social media platforms is the legitimacy of sellers, with many fearing scams.
(Source: HubSpot, Statista, Forbes.)
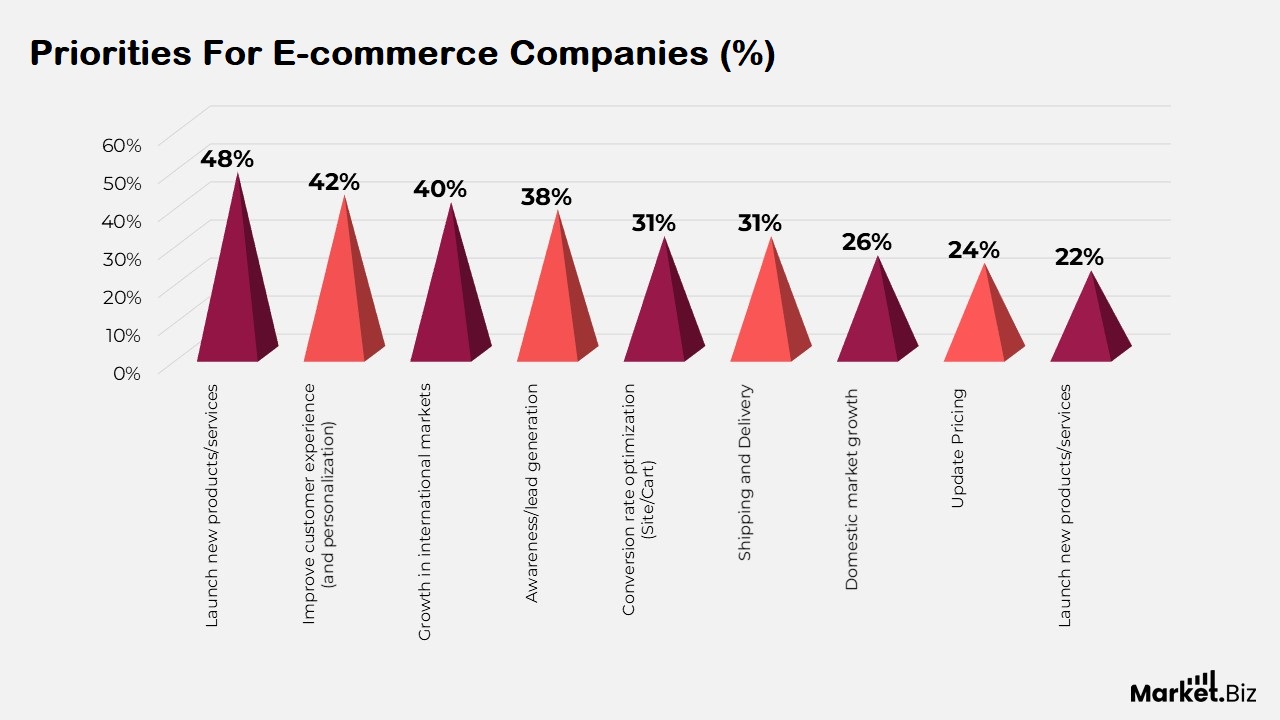
Priorities For E-commerce Companies
- 48% of e-commerce companies are focused on launching new products or services.
- 42% prioritize improving customer experience and personalizing services.
- 40% are targeting growth in international markets.
- 38% concentrate on raising awareness and generating leads.
- 31% work on optimizing conversion rates on their website and during checkout.
- 31% emphasize enhancing shipping and delivery services.
- 26% focus on growing within their domestic markets.
- 24% are committed to revising their pricing strategies.
(Source: Verifone, Semrush Inc)
E-commerce Challenges
- E-commerce businesses report that payment method localization is currently their greatest challenge.
- 52% of e-commerce companies consider payment localization their most significant issue.
- The average shopping cart abandonment rate stands at just over 70%.
- According to a poll of 4,384 U.S. adults, 48% stated they would abandon their carts upon encountering shipping, tax, and other additional fees.
- 74% of e-commerce companies have implemented a website personalization program.
- 40% of online shoppers admit to refusing a purchase from a brand due to concerns over personal data privacy.
- More than half (57%) of online shoppers express growing concern over how brands utilize their data, and 61% say they will only share it when necessary.
- 3.1% of global e-commerce revenue is lost to payment fraud.
(Source: Verifone, Baymard, Gartner & Yieldify, Shopify, Cybersource, Semrush Inc)
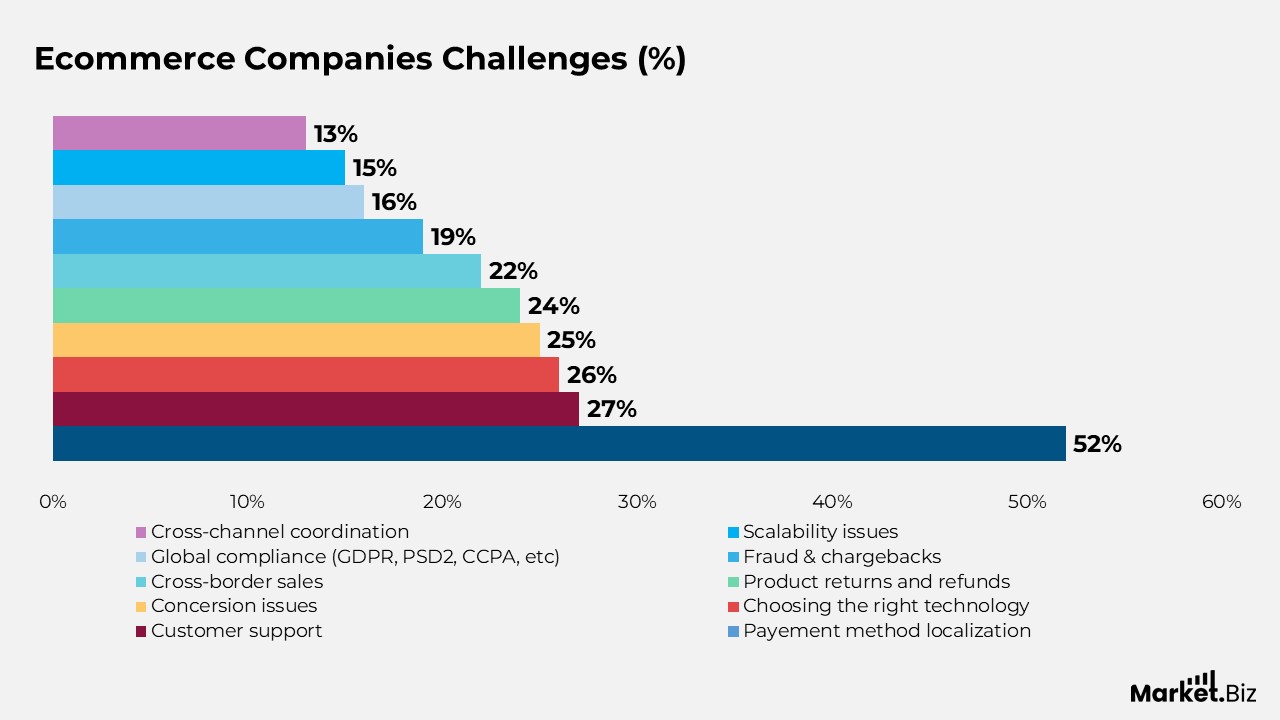
Ecommerce Companies Challenges
- 52% of e-commerce companies face challenges with payment method localization.
- 27% of businesses encounter difficulties in providing customer support.
- 26% of e-commerce companies struggle with selecting the appropriate technology.
- 25% of companies experience issues with conversion rates.
- 24% of businesses are affected by problems related to product returns and refunds.
- 22% of e-commerce companies face obstacles with cross-border sales.
- 19% of businesses deal with fraud and chargeback issues.
- 16% of e-commerce companies face challenges in adhering to global compliance regulations such as GDPR, PSD2, and CCPA.
- 15% of businesses encounter scalability challenges.
- 13% of companies find it difficult to manage coordination across various channels.
(Source: Verifone, Semrush Inc)
Conclusion
The e-commerce sector is experiencing significant growth, driven by factors such as increased internet connectivity, shifting consumer expectations for convenience, and ongoing technological innovations. Online shopping has become a core component of the global retail landscape, with mobile commerce playing a crucial role in this expansion. Consumers now expect more personalized experiences, prompting businesses to enhance user interfaces and strengthen payment security measures.
However, the industry faces challenges, including complex logistics, supply chain disruptions, and rising concerns about cybersecurity. To stay competitive, companies must prioritize technological advancements and deliver exceptional customer service. Looking ahead, the future of e-commerce appears bright, with trends like artificial intelligence, voice commerce, and sustainability shaping the market’s trajectory.
The adaptability of e-commerce, particularly in response to global uncertainties and evolving consumer behaviors, underscores its continuing importance in the global economy. Businesses that embrace innovation and optimize their operations are well-positioned to succeed in this ever-evolving market.
FAQ’s
The surge in e-commerce is mainly fueled by broader internet access, changing consumer preferences for convenience, and rapid technological progress. Additionally, the growing popularity of mobile commerce and tailored shopping experiences significantly contributes to this expansion.
Mobile commerce is a major catalyst in the e-commerce sector’s growth, with an increasing number of consumers using smartphones and tablets for shopping. This shift emphasizes the need for businesses to enhance mobile shopping platforms, ensuring smooth, intuitive interfaces and secure payment systems.
Despite its growth, the e-commerce industry encounters obstacles like complex logistics, ongoing supply chain disruptions, and mounting cybersecurity concerns. To maintain smooth operations and build consumer confidence, businesses must effectively address these challenges.
To remain competitive, e-commerce companies should embrace emerging technologies such as artificial intelligence and automation. Offering personalized customer experiences, improving support services, and ensuring robust data protection are critical to maintaining a competitive edge.
E-commerce is evolving rapidly, driven by trends like the use of artificial intelligence, the growing influence of voice commerce, and an increasing emphasis on sustainability. These developments are expected to transform the way businesses interact with consumers and deliver products and services.