
Introduction
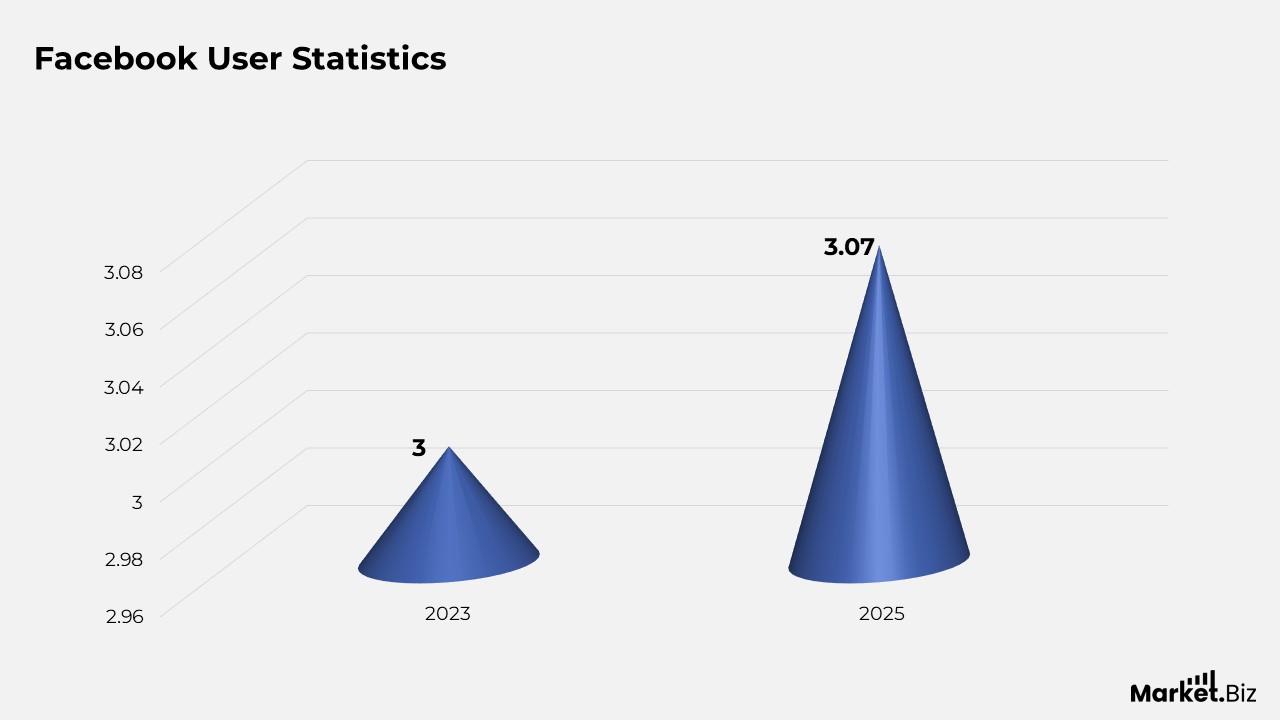
Facebook Statistics: On 2nd February 2025, Facebook celebrates its 21st anniversary as a social media giant. Over the past 20 years, the platform has changed online connections, increasing a staggering 3.07 billion monthly users globally. Currently, nearly 40% of the global population uses Facebook.
Its parent organization, Meta, holds a valuation of just under $1.3 trillion, with both its revenue and user base on an upward trajectory. A survey conducted in 2024 among marketers worldwide revealed that around 44% considered Facebook to be the most significant social media platform. In this article, we explore the most compelling Facebook statistics that social media managers should be aware of in 2025.
Editor’s Choice
- As of April 2025, Facebook has surpassed 3.07 billion monthly active users (MAUs).
- The number of users in the United States, Indonesia, and Brazil each exceeded 100 million.
- During this time, 7.6 million pieces of content were reported for bullying and harassment.
- Facebook’s user base represents approximately 37% of the world’s population, 56% of internet users, and 61% of social media users.
- In the United States, 24.20% of Facebook users are aged between 25 and 34.
- In the second quarter of 2025, Meta reported around four billion monthly active users across its Family of apps.
- According to statistics from Similarweb, 15.90% of Facebook users reported their age as being between 18 and 24.
- In particular, smartphones represent 52.63% of total Facebook usage, whereas desktop devices make up the remaining 47.37%.
- Every day, more than 1 billion Stories are shared via the Facebook app.
- Facebook currently hosts over 350 billion photos.
- The best times to post on Facebook are 7:00 AM, 8:00 AM, 9:00 AM, 10:00 AM, and 11:00 AM.
- Facebook has removed 5,057,300 pieces of content due to copyright and trademark violations.
- Almost 30% of B2B marketers indicate that Facebook offers the best value for their organizations.
- Facebook Reels represent 3.3% of all impressions on the platform.
General Facebook Statistics
- As of April 2025, Facebook has surpassed 3.07 billion monthly active users (MAUs).
- At the start of 2024, India had the largest user base on Facebook, totaling 378 million users.
- The number of users in the United States, Indonesia, and Brazil each exceeded 100 million.
- Approximately 20% of global Facebook users are men aged 25–34, while around 13% are women in the same age bracket.
- According to Facebook statistics, in the first quarter of 2024, 18.7% of the news feed content for U.S. users consisted of posts from friends.
- More than 31% of this news feed content was unrelated to any friends, pages, or groups of the user.
- Most of the content in the news feed does not include links.
- Facebook also faces challenges related to misinformation and harmful content.
- In the last quarter of 2023, 1.1 billion accounts were deleted.
- During this time, 7.6 million pieces of content were reported for bullying and harassment.
- A survey conducted in 2024 revealed that 44% of participants viewed Facebook as the most essential social media platform for marketers.
- Approximately 83% of marketers identified increased exposure as the primary advantage of social media marketing.
- There were significant benefits in terms of traffic and acquiring new customers.
- About 38% of marketers intended to improve their marketing efforts through Facebook.
- Social media companies, including Facebook, are exploring alternative revenue streams beyond advertising.
- Subscribers now have the option to pay for ad-free versions of Meta’s services.
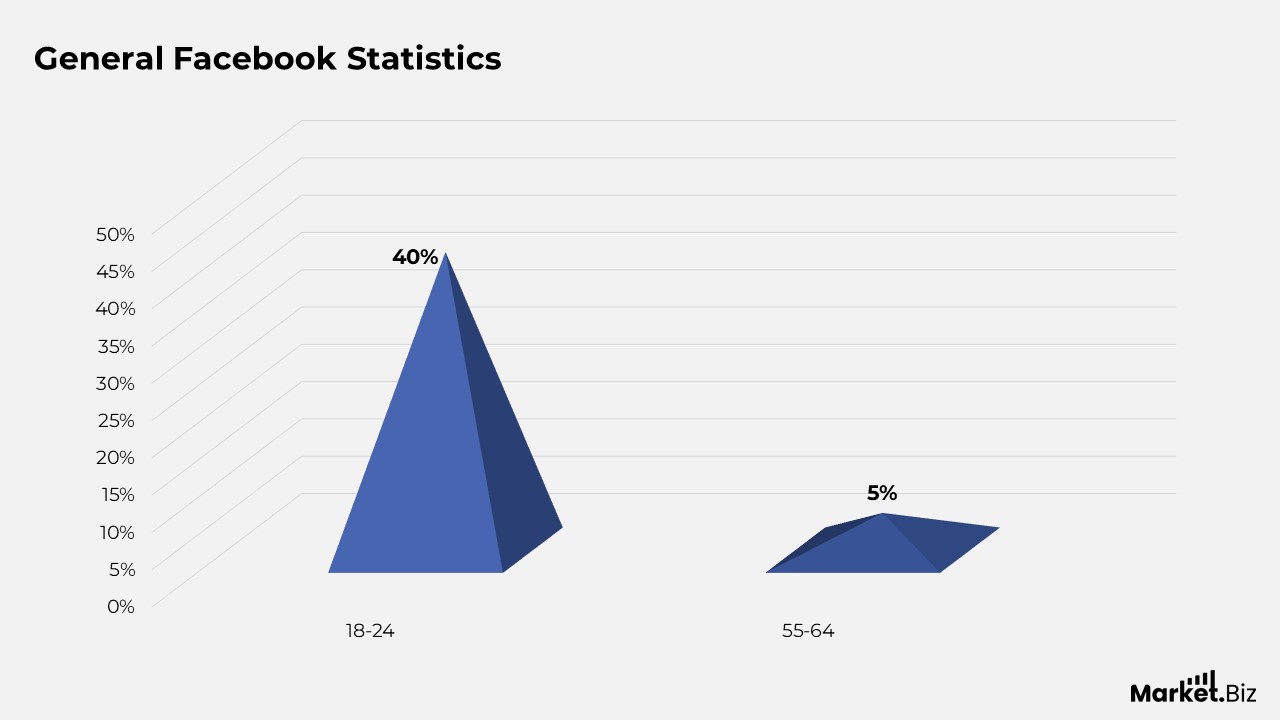
- Statistics from Facebook indicate that younger users are the most active, with 40% of U.S. users aged 18-24 willing to pay, compared to only 5% of those aged 55–64.
- Facebook is currently facing competition from TikTok and evolving user expectations.
- The emergence of Generation Z will necessitate that Facebook provide more personalized and engaging content.
Facebook User Statistics
- There are over 3.07 billion users of Facebook globally.
- Facebook’s user base represents approximately 37% of the world’s population, 56% of internet users, and 61% of social media users.
- Meta, the parent company of Facebook, boasts nearly four billion monthly active users across its social platforms, which include Facebook, WhatsApp, and Instagram, as well as the Facebook applications Facebook Messenger and Facebook Marketplace.
- India leads the world in the number of Facebook users. As of 2024, India has 448.1 million monthly active users on Facebook, with an adoption rate of 38.1%.
- In its top four countries, India, the United States, Indonesia, and Brazil, Facebook’s monthly active user count surpasses 100 million.
Statistics of Facebook Usage
- Facebook is the most frequently used social media platform on a daily basis. On average, users dedicate 19 hours and 47 minutes each month to the platform, with TikTok and Twitter following closely behind.
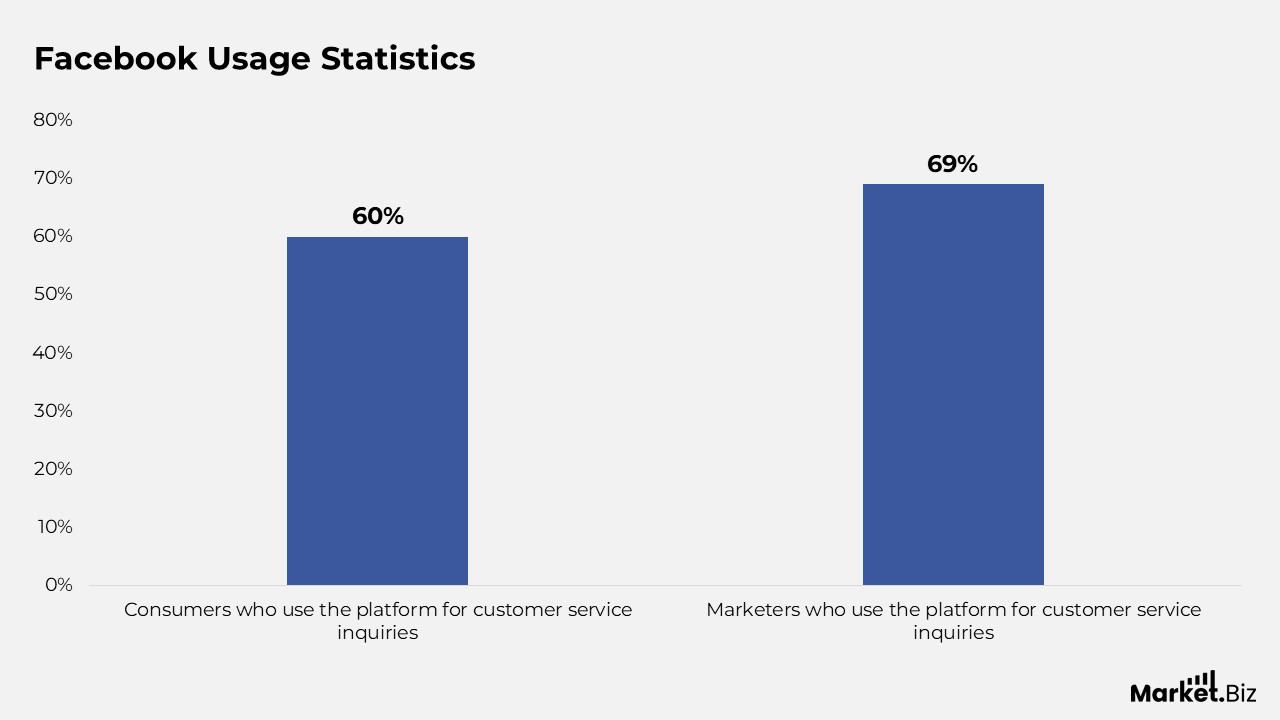
- 60% of consumers use the platform for customer service inquiries, while 69% of marketers leverage it for the same purpose.
- An impressive 98.50% of Facebook users access the platform via various mobile devices. Among them, 81.8% prefer using their phones, whereas 1.50% opt for laptops and desktops.
- India ranks first globally with over 581,580,800 million Facebook users projected for 2025, followed by the United States with nearly 279,809.3 million users. Other significant countries include Indonesia and Brazil, each boasting more than 100 million users.
- In the United States, 24.20% of Facebook users are aged between 25 and 34.
- On average, users log into Facebook 8 times each day.
- 72.4% of users engage with the platform to connect with family and friends, while 58.2% use it to remain informed about current news and events.
- Every month, 1.8 billion individuals use Facebook Groups, with half of the users participating in five or more groups.
- Over 1 billion stories are shared daily across the Facebook application.
Facebook Benchmark Statistics
- Meta Platforms has 4 of the largest social media platforms, each having over 1 billion monthly active users: Facebook, Instagram, Facebook Messenger, and WhatsApp.
- In the second quarter of 2025, Meta reported around four billion monthly active users across its Family of apps.
- Instagram led the charge with a year-on-year audience growth surpassing 5.5%. Pinterest saw a 10.6% increase, while LinkedIn experienced a growth of 17% during the same period.
- YouTube reached a penetration of 39%, while Facebook achieved a reach of 64%. Gmail was used by 68% of U.S. mobile users. TikTok had a reach of 32.9%.
- In March 2025, Facebook represented 56% of all social media visits in the United States, reinforcing its position as the leading platform. Pinterest followed with a 16% share, while Instagram secured 14% of visits.
Demographic
Gender
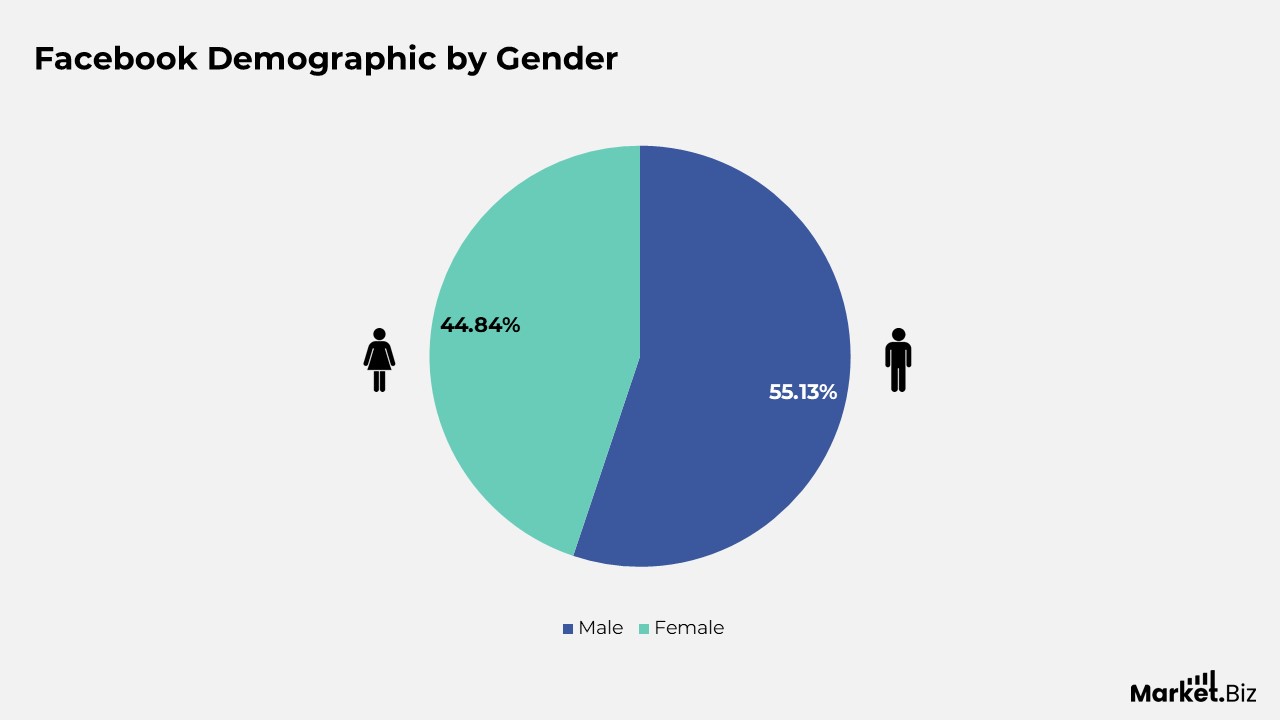
- According to Similarweb, approximately 55.13% of Facebook users are male.
- In contrast, the remaining 44.84% of users are female.
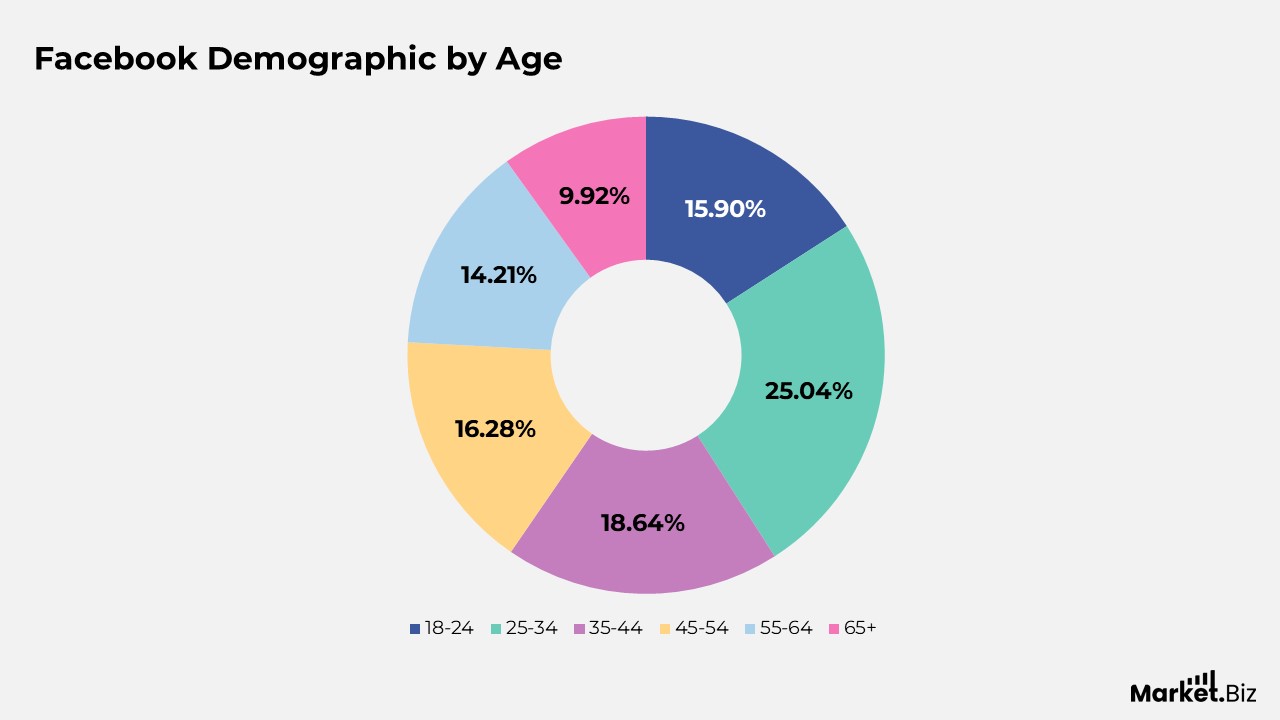
Age
- According to statistics from Similarweb, 15.90% of Facebook users reported their age as being between 18 and 24.
- In total, 25.04% of Facebook users belong to the 25 to 34 age group, while 18.64% are categorized as being between 35 and 44 years old.
- 16.28% of users are aged between 45 and 54 years,
- Additionally, 14.21% of Facebook users fall within the 55 to 64 age range, and 9.92% of users are over 65 years old.
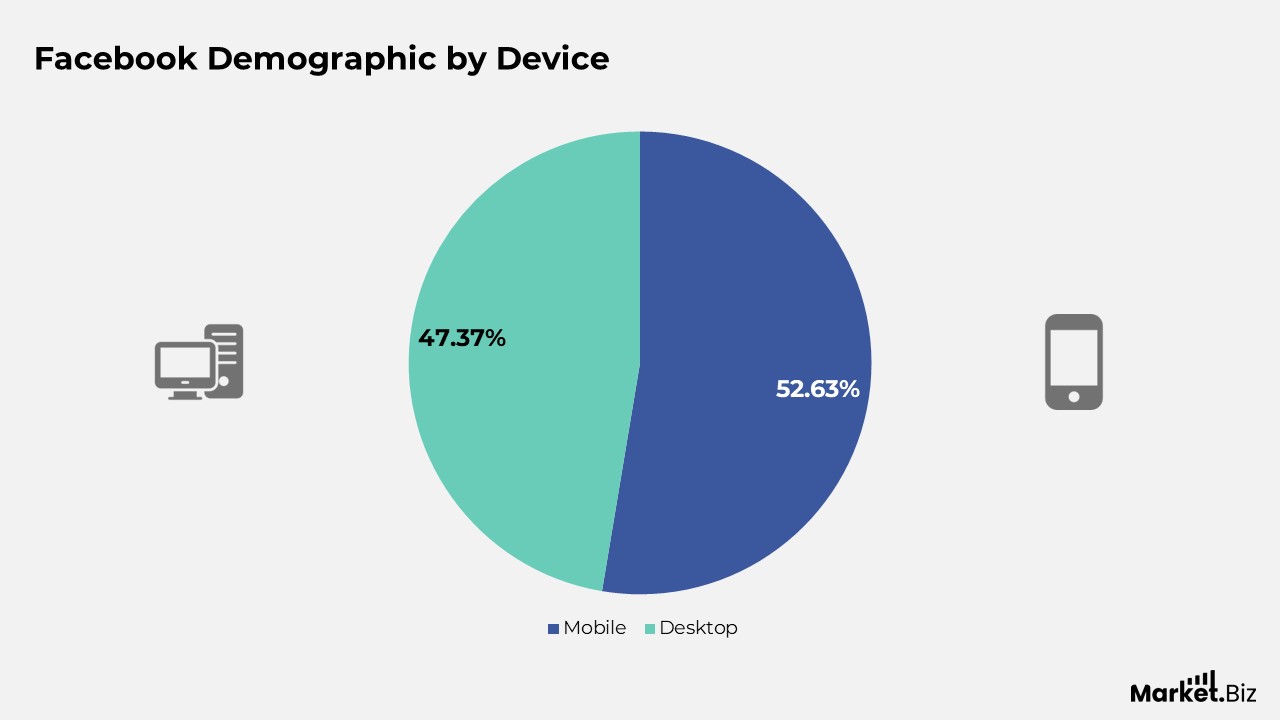
Device
- In particular, smartphones represent 52.63% of total Facebook usage, whereas desktop devices make up the remaining 47.37%.
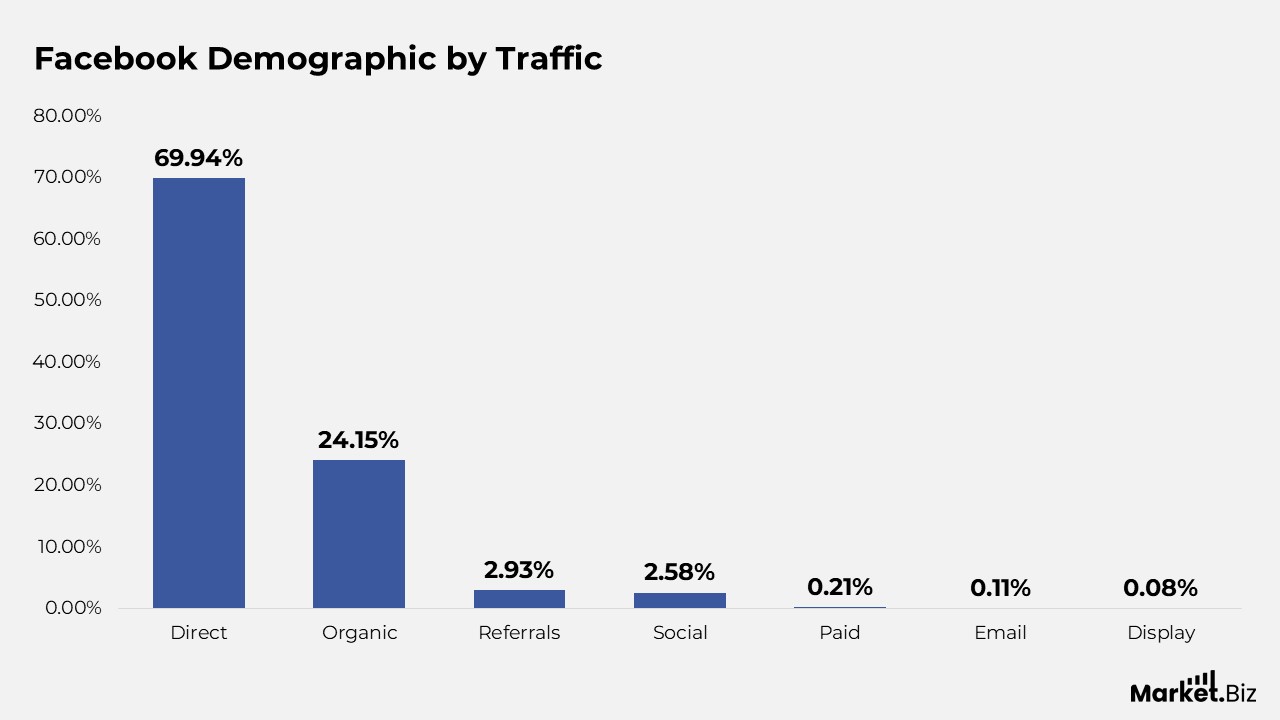
Traffic Source
- Direct search constitutes the largest portion of traffic to Facebook.com, accounting for 69.94% of the website’s traffic, with desktop contributing 52.47% and mobile devices contributing 47.53%.
- Approximately 24.15% of the traffic share originates from organic searches, while 2.93% is derived from referrals.
- Data from SimilarWeb further indicates that the remaining sources include paid search (0.21%), social media (2.58%), email (0.11%), and display advertising (0.08%).
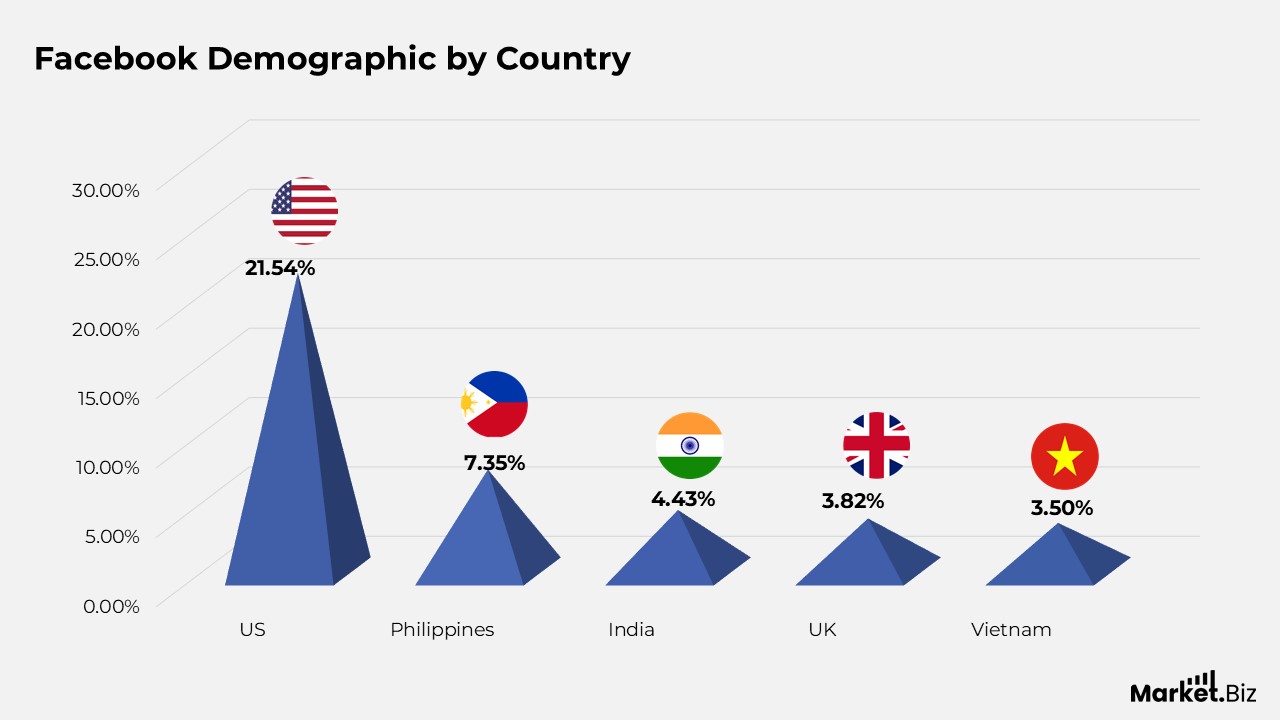
By Country
- US: 21.54% with a change rate of -0.12%
- Philippines: 7.35% with a change rate of -4.67%
- India: 4.43% with a change rate of -3.74%
- UK: 3.82% with a change rate of +0.10%
- Vietnam: 3.50% with a change rate of -1.17%
Facebook Engagement Statistics
- Every day, more than 1 billion Stories are shared via the Facebook app.
- Facebook Groups experience engagement from an astounding 1.8 billion users each month.
- Approximately 57% of brands consider Facebook Stories to be effective for product promotion.
- Video posts on Facebook can enhance engagement by an impressive 600%.
- A notable 90% of Facebook profile pages incorporate native videos.
- The typical engagement rate for a Facebook page post is 0.07%.
- On average, a standard user receives 12 likes, 5 comments, and 1 share monthly.
- Facebook logs over 4 billion video views each day.
- An astonishing 4 million likes are produced on Facebook every minute.
- Roughly 35 million individuals update their Facebook statuses every minute.
- Facebook currently hosts over 350 billion photos.
- Live video engagement on Facebook is at 26%, exceeding that of other social media platforms.
- In the US, 26% of adults favor Facebook Live as their platform for live-stream shopping.
- Facebook Gaming watch hours fell from 1.29 billion hours in Q3 2021 to 382 million hours in Q3 2022.
- Facebook videos that include captions can boost watch time by 12%.
- The most recent Facebook statistics reveal that 49.9% of all posts are link posts, making them the predominant content type, followed by images and videos.
- Status posts show a 0.14% engagement rate, the highest among all content types on Facebook.
- The average engagement rate for Facebook posts is 3.91%.
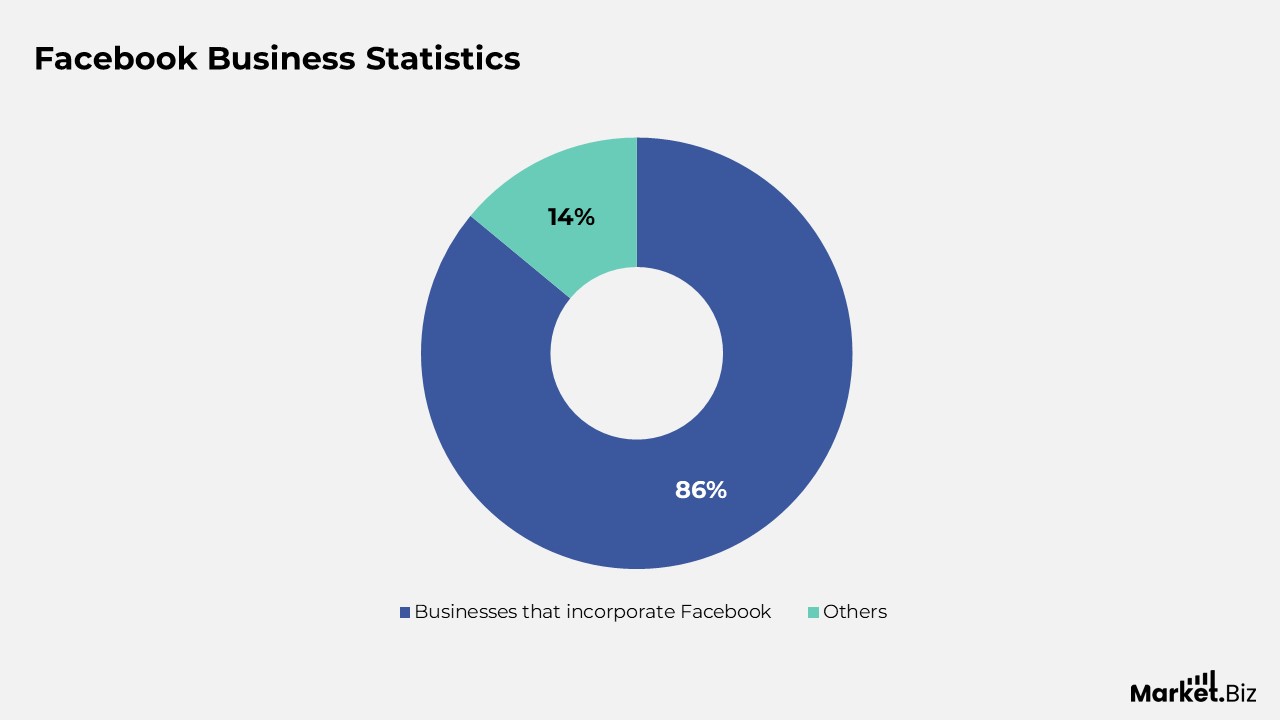
Statistics of Facebook Business
- 86% of marketers incorporate Facebook into their digital marketing strategies.
- Approximately 15% of Facebook users engage in shopping on the platform.
- There are 250 million active Facebook Shops available.
- According to a Facebook study, 89% of customers are more likely to make a purchase following an interaction with the brand.
- Facebook Messenger ranks as the third most popular application, boasting 1.01 million active users.
- Facebook serves as the platform for 200 million small businesses.
- 60% of users in the United States discover new products on Facebook.
- 40% of shoppers claim that Facebook significantly influences their purchasing decisions.
- Facebook Messenger enjoys an open rate of 88% and a click-through rate of 56%.
- 51% of B2C marketers and 44% of B2B marketers use Facebook.
- Facebook continues to expand rapidly, with over 1 billion stories shared daily.
- Nearly 49.90% of Facebook users are proficient in English.
- Facebook supports 112 different languages.
- The best times to post on Facebook are 7:00 AM, 8:00 AM, 9:00 AM, 10:00 AM, and 11:00 AM.
- The least favorable times to upload on Facebook are 12:00 AM, 2:00 AM, 3:00 AM, 4:00 AM, and 5:00 AM.
Moreover
- Mondays, Wednesdays, and Fridays are considered the best days to post on Facebook.
- The Facebook marketplace attracts 1 billion visitors each month.
- 87% of adults in the United States express concerns regarding their privacy if Facebook successfully develops the metaverse.
- Facebook has removed 5,057,300 pieces of content due to copyright and trademark violations.
- In the first quarter of 2024, 60% of users dedicate their time to watching videos on Facebook.
- 40.80% of users show increased interest in a product after viewing a video on Facebook.
- Live videos on Facebook generate more engagement (0.92%) compared to pre-recorded videos (1.59%).
- Facebook has surpassed 10 billion downloads on the Google Play Store.
- Facebook has eliminated 100 million fake pages from its platform.
- 72% of Facebook users also use YouTube, WhatsApp, and Instagram.
- Facebook ranks as the 7th most valuable brand globally.
- 56% of Gen Z users intend to leave Facebook by the fourth quarter of 2024.
Facebook Ad Statistics
- Facebook has a total potential advertising reach of 2.19 billion users.
- Facebook derives 97.5% of its revenue from advertising, achieving $131.948 billion in 2023.
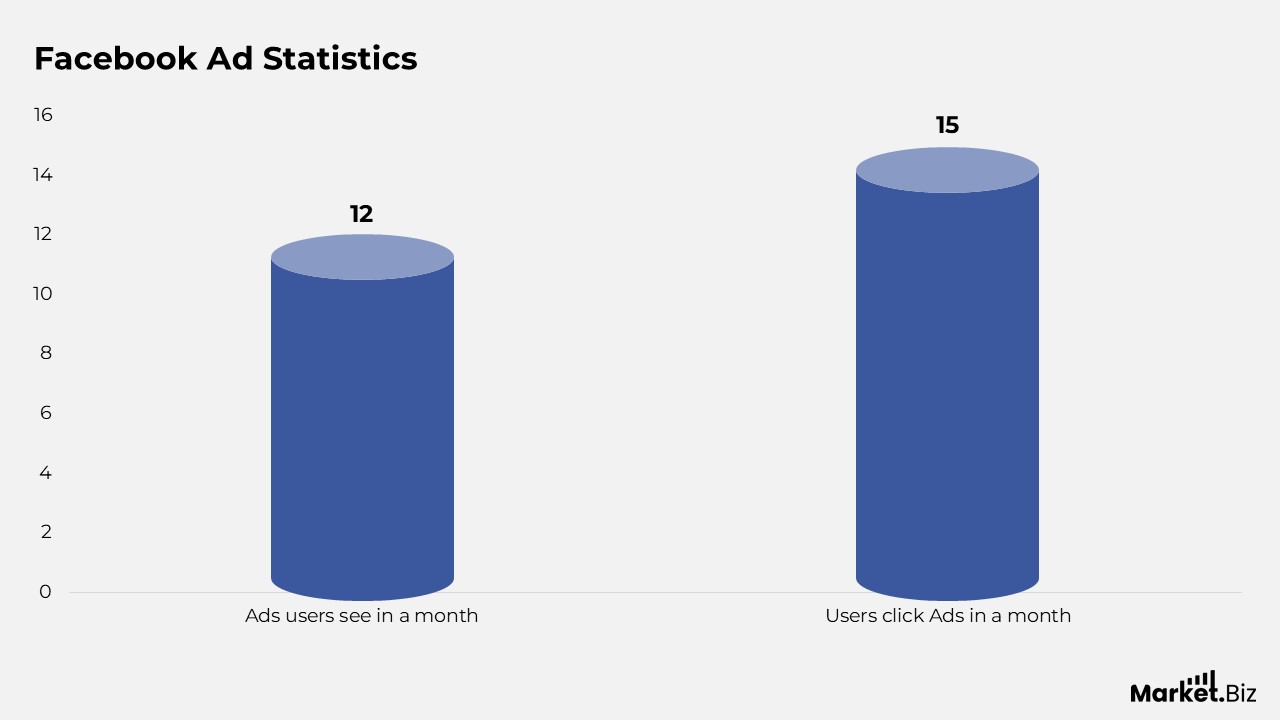
- On average, a Facebook user views 12 advertisements each month, while women tend to click on approximately 15 ads monthly.
- More than 8 million active advertisers are using Meta across all its platforms.
- 42.4% of Facebook ad campaigns aim to enhance audience engagement and interaction.
- App Promotion campaigns incur the highest average investment cost, with an expenditure of US$1,856.64 per campaign.
- Brand Awareness campaigns generate the most impressions (37.7% of total impressions), followed by Engagement (18.6%), Traffic (24.6% of impressions), and Leads (9.5%).
- The average cost per click (CPC) for Facebook ad campaigns is US$0.075647, with the UK showing the highest average CPC at US$0.38.
- Regarding campaign objectives, app promotion has the highest average CPC at US$0.32, while traffic generation has the lowest at US$0.04.
- The dental services industry has the highest CPC for traffic generation, averaging US$1.27, whereas the travel industry has the lowest CPC at US$0.43.
- Across all sectors, traffic campaigns achieved an average click-through rate (CTR) of 1.51%.
- The Arts & Entertainment sector holds the highest CTR for traffic campaigns at 2.55%, followed by real estate at 2.45% and restaurants & food at 2.29%.
- For lead generation campaigns, the average CTR across all industries stands at 2.5%.
- Lead generation ad campaigns in the travel industry recorded the highest CTR at 6.62%, followed by arts & entertainment at 3.70% and real estate at 3.69%.
- Attorneys & legal services command the highest CPC in lead generation campaigns at US$5.42, while the arts & entertainment sector has the lowest lead generation CPC at US$0.96.
- For all Facebook ad campaigns, the average conversion rate is 8.25%.
Statistics Facebook Marketing
- Among the social media marketers surveyed, 22% believe that Facebook provides the highest return on investment (ROI) compared to all other social platforms. This positions Facebook behind YouTube, which stands at 25%, but ahead of Instagram at 21% and TikTok at 14%.
- The average frequency of Facebook posts made by brands each week is 4.69.
- More than 20% of marketing professionals consider Facebook to be effective for influencer marketing.
- Among the surveyed social media marketers, 18% assert that Facebook presents the greatest opportunity for brands to expand their audiences in 2024.
- Almost 30% of B2B marketers indicate that Facebook offers the best value for their organizations.
- Over 30% of marketers claim that Facebook is the social platform that most significantly contributes to their sales.
- More than half of B2B companies and nearly three-quarters of B2C companies use Facebook for their social media marketing efforts.
- One-quarter of marketers believe that Facebook is the optimal platform for community growth.
- More than 20% of brands intend to allocate the majority of their investment to Facebook in 2024.
Facebook Videos Statistics
- A significant portion of the time that users dedicate to Facebook and Instagram is spent watching videos.
- Facebook videos receive an astounding 8 billion views daily.
- A remarkable 85% of all videos on Facebook are viewed without sound.
- Incorporating captions in Facebook video advertisements enhances viewing time by 12% compared to those without captions.
- Vertical Reels that include audio achieve a 35% higher click-through rate than other types of video content.
- Each month, 4 million advertisers use Stories ads on Facebook.
- 58% of Facebook users report that they have explored a brand’s website after encountering a Story advertisement.
- Meta Reels accumulate 200 billion views daily across both Facebook and Instagram.
- 79% of Facebook users aged between 18 and 24 have made a purchase after viewing a Reel on either Facebook or Instagram.
- Facebook Reels represent 3.3% of all impressions on the platform.
- Users on Facebook are more inclined to watch and interact with live videos compared to pre-recorded ones.
- 20% of the videos on Facebook are live broadcasts.
Facebook Employee Statistics
- In 2005, the total had risen to 15 employees; then it increased tenfold to 150 employees a year later.
- The subsequent years resulted in rapid growth, with workforces reaching 450 in 2007 and nearly doubling to 850 in 2008. At the end of that decade, specifically in 2009, Facebook had a workforce of 1,218 employees.
- As the company broadened its services to connect with more individuals across various nations, the employee count increased correspondingly. In 2010, Facebook’s workforce grew to 2,127 individuals.
- The number more than doubled to over 4,619 in 2012, following the initial public offering (IPO). In 2014, this impressive figure reached 9,199, and it further escalated by approximately 8,000 in 2016, ending in a total of 17,048 employees.
- In 2017, the company had surpassed 25,000 employees. This number surged sharply to 44,942 in 2019. The workforce was substantial enough that, in 2020, Facebook employed 58,604 individuals.
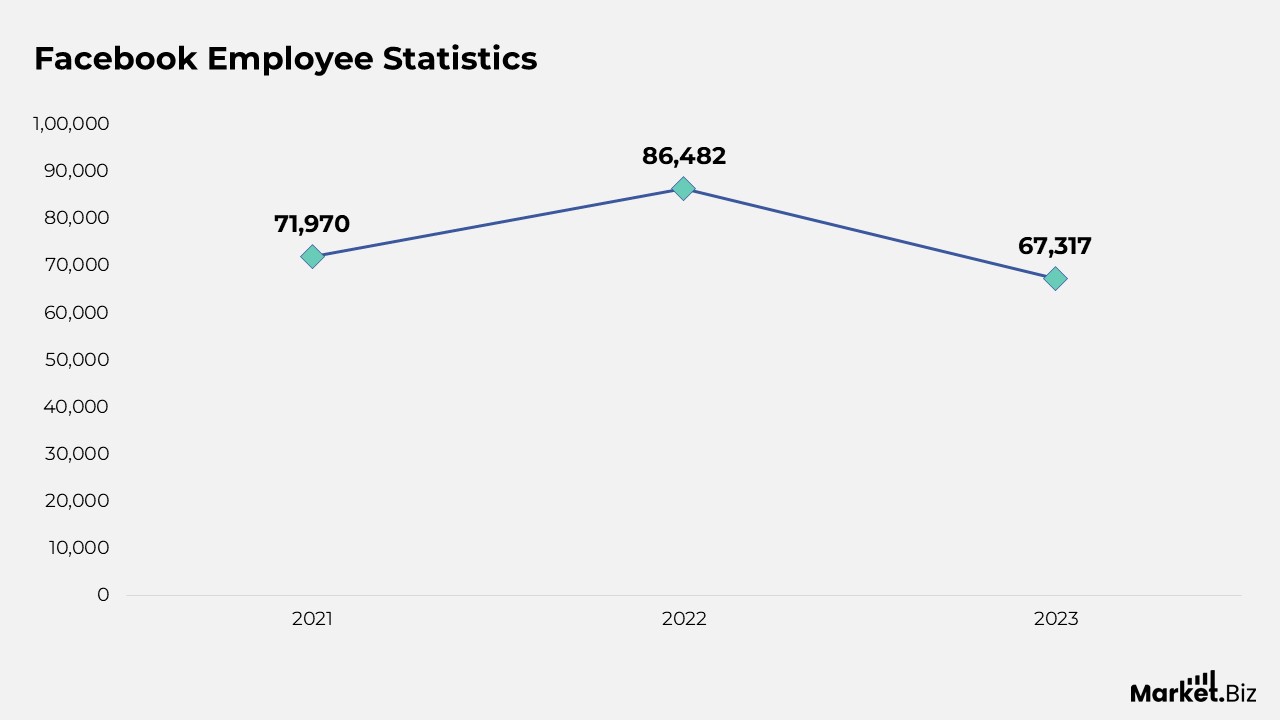
- This total increased to 71,970 in 2021, peaking at 86,482 in 2022.
- However, in 2023, the company underwent some strategic changes and restructuring, resulting in a reduction of its workforce to 67,317, a consequence of rapid expansion.
Conclusion
With the emergence and expansion of numerous social media platforms, competition for Facebook is expected to intensify, necessitating ongoing adaptations to retain its leading status in social networking.
According to Facebook’s statistics, it occupies a central role in the industry; however, it is the relentless innovations that will ensure this giant remains pertinent in the ever-evolving landscape of social media.
It can continue to be the preferred platform for users seeking to discover new products, connect with friends, and access news. Consequently, if Facebook is already integrated into your marketing strategy, there are always avenues to refine and enhance your approach to maximize growth and engagement.
FAQs
Meta Platforms, Inc. is primarily owned by its founder, chairman, and CEO, Mark Zuckerberg. While he owns a significant 13.67% stake, other major shareholders include institutional investors like Vanguard and BlackRock
In order to monetize a Facebook page, it is essential to first verify that your page meets the eligibility criteria for monetization, followed by selecting an appropriate monetization method. Facebook provides various options such as in-stream advertisements, subscriptions, and bonuses. Additionally, it is necessary to establish your payout account.
Facebook began as a Harvard University project called Facemash in 2003, created by Mark Zuckerberg and some of his fellow students. It quickly evolved into “thefacebook.com”, a social network for Harvard students, and eventually expanded to other universities. The site’s popularity grew rapidly, leading to its expansion to high schools and eventually the general public, with the name changing to Facebook in 2005.