
Introduction
Restaurant industry statistics provide a data-driven snapshot of how one of the most dynamic consumer sectors is evolving, capturing trends across dining formats, service models, consumer spending behavior, technology adoption, workforce dynamics, and regional performance.
As eating habits shift due to urbanization, changing lifestyles, digital ordering, and growing demand for convenience and experience-focused dining, these statistics help identify where growth is concentrating and where operational pressures are intensifying.
Data spanning quick-service, fast-casual, full-service, and fine-dining establishments highlights differences in revenue contribution, customer frequency, pricing sensitivity, and efficiency.
At the same time, insights into online delivery, contactless payments, loyalty programs, and sustainability reflect how operators adapt to rising costs and changing customer expectations, offering a clear foundation for understanding competition and long-term structural change in the restaurant industry.
Editor’s Choice
- As of 2024, the US had 150,115 single-location full-service restaurants, highlighting the strong presence of independently operated dining establishments.
- Nearly 9 out of 10 restaurants operate with fewer than 50 employees, reflecting the small-business nature of the restaurant industry.
- Around 7 out of 10 restaurants function as single-unit operations, indicating limited multi-location expansion among operators
- There were 140,517 chain restaurants in 2024, underscoring the significant footprint of branded and multi-unit operators.
- San Francisco, California, recorded the highest restaurant density in the country, with 3.9 restaurants per 10,000 households.
- US households spend an average of $2,375 annually on dining out and takeout purchases, signalling strong consumer demand for food-away-from-home
- Inventory management emerged as the leading financial strain in 2024, cited by 26% of restaurant owners.
Moreover
- Full-service restaurant operators carried an average debt of $51,040 in 2024, reflecting ongoing capital and operating cost pressures.
- Expansion plans remained strong, with 97% of full-service restaurants aiming to grow their business in some form in 2025
- The US foodservice market is projected to reach $1,767.54 billion by 2030, driven by sustained consumer spending and service innovation.
- The US had 7,606 ghost kitchen businesses in operation, highlighting the continued rise of delivery-focused foodservice models.
- Urban consumers in India are eating out more frequently, averaging 5 dining occasions per month, with this figure expected to rise to 7-8 per month by 2030, driven largely by Gen Z, which accounts for nearly 40% of total consumption.
- Digital adoption is transforming restaurant operations, with POS systems, QR code menus, self-service kiosks, and mobile apps improving operational efficiency and increasing average customer spend.
- Online food delivery continues to surge, led by Zomato with a 58% market share and Swiggy with 34%, while mobile payments and UPI have become the preferred transaction methods across platforms.
(Sources: IBISWorld, National Restaurant Association, Finances Online, Motley Fool, 2025 State of Restaurants Report)
Restaurant Sales Statistics
- Total restaurant sales in the US are expected to reach $1.5 trillion by the end of 2025, reflecting sustained consumer demand despite inflationary pressures.
- Full-service restaurants generated an average annual revenue of $1,911,710 in 2024, highlighting stable topline performance across the segment.
- The average profit margin for full-service restaurants stands at 9.8%, indicating moderate profitability amid rising operating costs.
- Nearly 47% of restaurants raised menu prices in 2024 to offset higher food, labor, and utility expenses.
- Online ordering now accounts for 22% of total restaurant business on average, underscoring its growing role in the sales mix.
- Restaurants that adopted online ordering reported an average sales increase of 16%, demonstrating its direct impact on revenue.
- Diners spent 5% more at US restaurants compared to 2023, signalling resilient discretionary spending.
- The average dine-in check size in the US reached $54, reflecting higher menu pricing and upselling.
- The average spend for takeout orders remained lower at $38, driven by convenience-focused purchases.
- Loyalty program members deliver 12% to 18% higher incremental revenue growth annually compared to non-members.
(Sources: National Restaurant Association, 2025 State of Restaurants Report, 2025 Diner Trends Report, 2024 Restaurant Trend Report, Deliverect Loyalty Stats, TouchBistro)
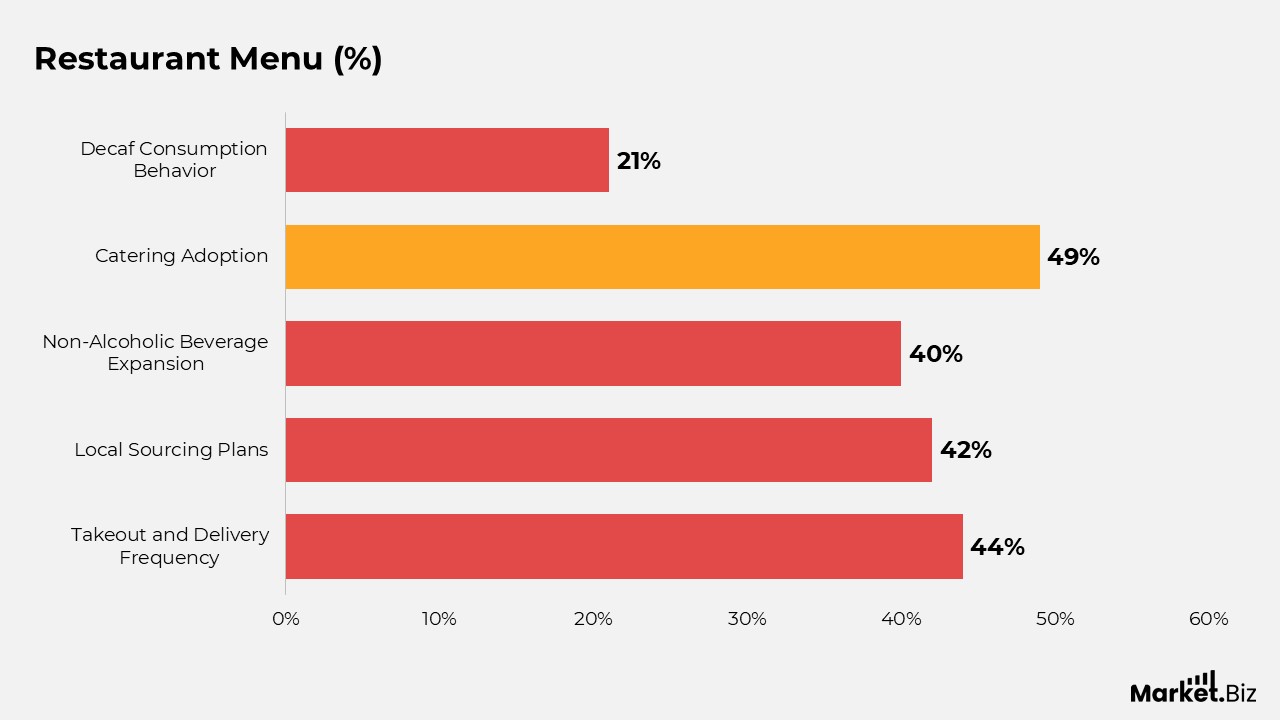
Restaurant Menu Statistics
- About 44% of diners order takeout or delivery at least once per week, highlighting strong off-premise demand.
- Fridays and Saturdays remain the most popular days for food orders, driven by leisure and social dining.
- Mondays generate the highest volume of morning food orders, reflecting weekday breakfast routines.
- The peak ordering time across restaurants is 6 p.m., aligning with traditional dinner hours.
- Around 42% of restaurants plan to add more locally sourced ingredients to their menus in 2025
- Nearly 40% of operators aim to expand their non-alcoholic beverage offerings in 2025
- Catering services are expected to grow, with 49% of restaurants planning to add catering options.
- Customers placed nearly 1.3 million birria orders in a single year, highlighting demand for regional and speciality cuisines.
- About 21% of decaf coffee orders were placed after lunch, indicating shifting caffeine consumption habits.
- Consumers ordered approximately 1.6 million family meals in 2024, reflecting demand for group dining solutions.
(Sources: Diner Trends Report, 2024 Restaurant Online Ordering Trends, 2025 State of Restaurants Report, Grubhub Delivered Trend Report 2024, TouchBistro)
Restaurant Labor Statistics
- Roughly 79% of restaurants reported being understaffed by at least one position in 2024
- Bartenders are the most in-demand role, with 29% of full-service restaurants reporting shortages.
- Nearly 99% of operators reported higher labour costs compared to the previous year.
- About 30% of operators cross-trained or repurposed staff to manage labour expenses
- Training a new restaurant employee costs an average of $3,560, adding financial pressure to hiring decisions.
- Employee turnover at full-service restaurants averages 26%, highlighting retention challenges.
- The average employee tenure across restaurants is just 110 days, indicating short job durations.
- Around 34% of staff cite wages as their primary reason for leaving or planning to leave.
- Nearly 82% of restaurants spend more than $2,000 to train each new employee.
- About 46% of restaurants adopted QR code menus to help reduce labour requirements.
- Staff turnover ranked as the top labour concern for 44% of operators
- After implementing automation, 41% of restaurants reported more efficient front-of-house teams.
Moreover
- As of August 2024, employment in full-service restaurants stood at 234,000 jobs, about 4% below pre-pandemic levels recorded in February 2020, reflecting a slower recovery than in other foodservice segments.
- Full-service dining experienced the steepest employment decline during the early stages of the pandemic and continues to show the longest recovery timeline within the restaurant industry.
- The total workforce across the US restaurant and foodservice industry is approximately 9.2 million, underscoring its role as a major national employer.
- Career mobility remains strong, with nearly 9 out of 10 restaurant managers having begun their careers in entry-level positions.
- The restaurant sector has employed a broad share of the population, with around 63% of American adults having worked in the industry at some point.
- Restaurants demonstrate high workforce diversity, employing more minority managers than any other industry, while minority entrepreneurs own about 41.2% of restaurant businesses.
- As of October 2024, the average hourly wage for restaurant workers in the US reached $17.11, reflecting gradual wage growth amid labour shortages.
- Employment growth is projected to remain steady, with the industry expected to add an average of 150,000 jobs annually between 2024 and 2032
- By 2032, total employment in the restaurant industry is forecast to reach approximately 16.9 million workers.
- In 2024, bars and taverns added 32,000 jobs, representing a 7% increase compared to pre-pandemic employment levels.
- Quick-service and fast-casual restaurants added roughly 164,000 jobs, marking a 4% gain over pre-pandemic employment.
- Labour shortages persist, with nearly 57% of restaurant operators reporting staffing levels more than 10% below requirements.
- Hiring activity remains high, with 82% of restaurants actively seeking new employees, and chefs and cooks accounting for about 30% of open positions.
(Sources: State of Restaurants Report, Restaurant Employee Retention Study by 7shifts, TouchBistro)
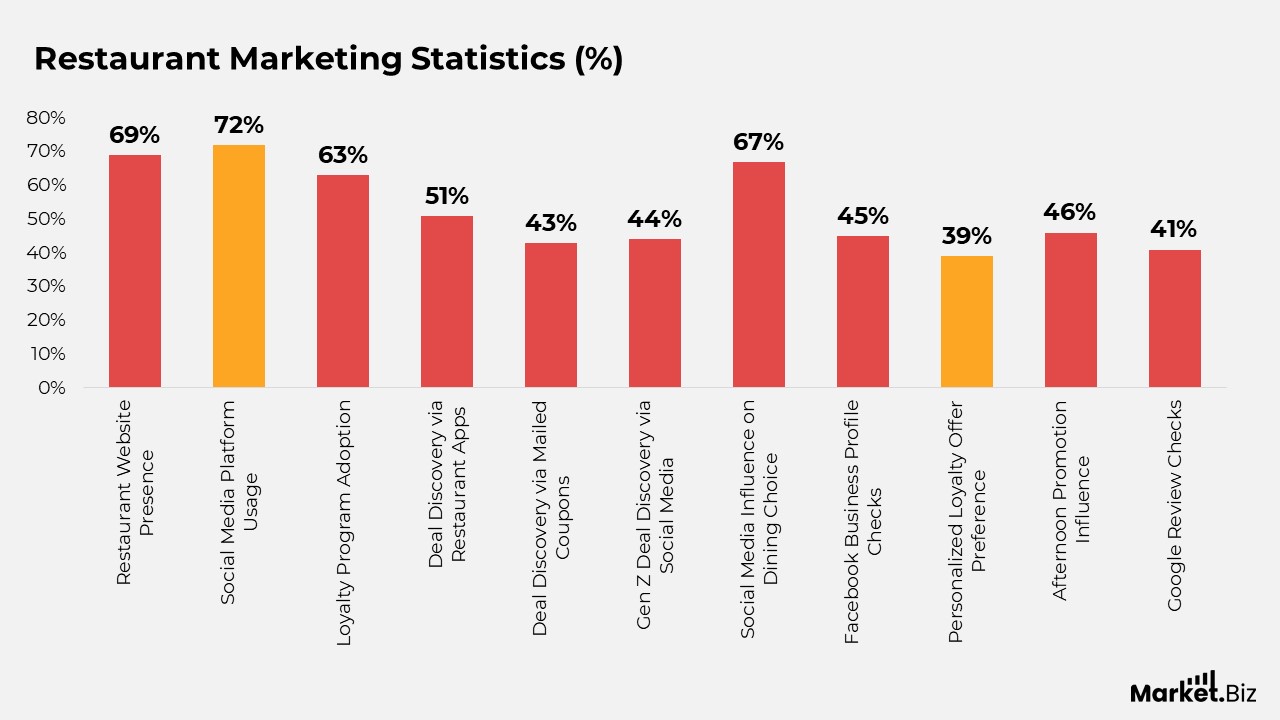
Restaurant Marketing Statistics
- About 69% of restaurants operate a dedicated website to support online presence and discovery.
- Facebook remains the leading marketing platform, used by 72% of restaurateurs.
- Loyalty programs are offered by 63% of full-service restaurants
- Around 51% of customers find deals through restaurant apps, while 43% rely on mailed coupons
- Social media plays a major role for younger audiences, with 44% of Gen Z diners discovering deals there
- About 67% of Gen Z and Millennials use social media to choose where to eat
- Roughly 45% of diners check a restaurant’s Facebook business profile before visiting
- Personalised loyalty offers appeal to 39% of diners
- Afternoon promotions influence 46% of customers to visit coffee shops
- Online reputation matters: 41% of diners checked Google reviews in the past 3 months.
(Sources: State of Restaurants Report, 2025 Diner Trends Report, Bluedot The State of What Feeds Us, TouchBistro)
Restaurant Technology Statistics
- Nearly 95% of operators use some form of AI technology in restaurant operations.
- Automated inventory management is used by 50% of restaurants
- Email marketing automation has been adopted by 53% of restaurateurs
- Staff scheduling automation is in place at 47% of restaurants
- High upfront costs remain a barrier to automation for 28% of operators
- Cloud-based POS systems are used by 63% of restaurants, while 34% still rely on legacy systems
- About 86% of full-service operators use the same POS system across all locations
- Ease of use is the top POS selection factor for 30% of restaurateurs
- Multi-location management capability is the most important factor for 34% of operators
- Nearly 99% of restaurants use at least one online ordering platform, with most using three on average
- Around 48% of diners are comfortable with AI-generated offers and discounts
- Technology comfort levels are high, with 59% of diners expressing confidence using restaurant tech.
(Sources: State of Restaurants Report, 2025 Diner Trends Report, Bluedot The State of What Feeds Us, TouchBistro)
Restaurant Consumer Statistics
- About 42% of diners eat out at least once a week or more
- Roughly 61% of diners report no change in their tipping habits
- Price sensitivity is high, with 91% of diners noticing menu price increases
- Portion size concerns are rising, as 77% of consumers feel they pay the same for smaller servings
- Value menus are increasingly popular, with 73% of diners ordering from them more often
- Customer satisfaction remains the top reason diners tip more
- Fast food is the most frequently visited format for 27% of diners
- Food quality is the top dining priority for 58% of consumers
- Location influences restaurant choice for 50% of diners
- Walk-in pickup is preferred by 40% of customers for takeout
- Nearly 48% of diners are enrolled in at least one restaurant loyalty program
- Limited-time offers motivate 62% of diners to visit a restaurant
- Drive-thru remains relevant, with 21% of diners using it for to-go orders
- About 73% of Americans use DoorDash for food ordering
- Roughly 33% of diners rarely make reservations
- Long wait times matter, as 42% of diners avoid restaurants with waits over 30 minutes.
(Sources: Diner Trends Report, Bluedot The State of What Feeds Us, TouchBistro)
Online Ordering and Delivery Trends
- Online food ordering continues to accelerate, growing nearly 300% faster than in-house dining and reshaping how consumers access restaurant meals.
- About 77% of consumers place takeout or delivery orders at least once every month.
- Roughly 34% of Americans spend an average of $50 per order when purchasing food online.
- Consumer behaviour studies show that 13% of customers order delivery more often now, while an additional 10% order delivery significantly more often than before the pandemic.
- In the US, nearly 60% of consumers choose delivery or takeout at least once per week.
- Third-party platforms see strong repeat usage, with 31% of users placing delivery orders at least twice weekly.
- In a single month, 77% of consumers ordered delivery, 76% picked up takeout, and 61% dined inside a restaurant.
- Convenience and the desire to stay in are the primary reasons consumers prefer delivery, while faster service drives preference for takeout.
- Speed and menu variety influence delivery decisions for 77% of customers
- Trust also plays a role, as 76% of diners prefer ordering from restaurants they already know and rely on
- The busiest window for delivery orders falls between 6:00 p.m. and 9:00 p.m.
- Friday is the most popular day for online food orders, followed closely by Saturday.
- French fries rank as the most frequently ordered food item online in the US, followed by chicken quesadillas and mozzarella sticks.
(Sources: WebstaurantStore, USDA)
Restaurant Technology and Digital Engagement Statistics
- Digital discovery dominates restaurant selection, with 90% of consumers researching restaurants online before ordering or visiting
- Social platforms are a key research channel, used by 72% of consumers to evaluate dining options
- QR code ordering continues to gain acceptance, with 78% of customers finding it easy and convenient
- Online reviews strongly influence decisions, as 85% of consumers trust them as much as personal recommendations
- Social media exposure drives trial, with 45% of diners trying a restaurant for the first time after seeing a post online
- Repeat visits are also influenced digitally, with 22% of diners returning to restaurants due to engaging social media content
- Reputation management is widespread, as 94% of restaurants actively monitor online reviews and social engagement
- Around 10% of restaurants outsource social media management to third-party agencies
- Engagement matters, with 56% of consumers favouring businesses that respond to customer reviews
- Restaurants with efficient ordering systems and quick social responses are more likely to be recommended by 71% of consumers
- On Instagram, fast-food brands generate higher engagement than full-service restaurants, reflecting stronger follower interaction
- Foodservice conversations dominate social chatter, with 32% of all tweets referencing restaurants or food brands
- TikTok influences dining decisions, as 55% of users visit a restaurant after discovering its menu on the platform
- Food content drives engagement on Instagram, with 38% of users browsing food posts and 27% sharing them
- Facebook remains a core engagement platform, used by over 50 million small and medium-sized businesses
- Contactless payments are now preferred by 87% of consumers, reinforcing the shift toward digital and mobile transactions.
(Sources: WebstaurantStore, USDA, Statista)
Restaurant Financials Statistics
- Restaurant sales in the US continue to trend upward, though growth remains uneven month to month.
- In November 2024, US restaurant sales totalled $96.7 billion, up 1.9% year over year.
- Total annual sales for the US restaurant industry in 2024 are estimated at approximately $1.1 trillion.
- Over the longer term, restaurant sales increased by 33.5% between January 2022 and November 2024, rising from $72.7 billion to $97.1 billion.
- Average profit margins stabilized at 9.8%, showing a slight improvement compared to 2023, though still below levels seen in 2021 and 2022
- Rising debt remains a concern, with 78% of operators reporting outstanding debt, up 10% from the previous year.
- The average debt carried by restaurant operators stands at roughly $50,000
- Revenue diversification has become a key strategy, with 37% of operators adding new sales channels such as catering and events to support growth.
(Sources: TouchBistro, Kroll, Statista, Restaurant365)
Restaurant Delivery Statistics
- In 2025, takeout and delivery continue to gain momentum, increasingly serving as substitutes for dine-in meals due to perceived affordability and convenience.
- About 82% of restaurants reported higher takeout and delivery sales compared to the prior year.
- For 25% of operators, online sales increased significantly, with an average growth rate of 32%, while none reported a decline.
- Digital adoption is nearly universal, with 99% of restaurants using at least one online ordering platform and an average of three platforms per operator.
- Reliability ranks as the most important factor when selecting online ordering solutions, cited by 28% of restaurants, ahead of cost.
- Mobile and digital channels are expected to account for nearly 30% of total US restaurant sales by 2025
- Global online food delivery spending is projected to grow from $1.41 trillion in 2025 to $1.91 trillion by 2029
- Restaurant-specific delivery revenue is forecast to increase from $164.2 billion in 2025 to $185.4 billion by 2029
- Third-party delivery platforms contribute meaningfully to revenue, with 45% of operators generating between 11% and 30% of sales from these services.
(Sources: TouchBistro, Kroll, Statista, Restaurant365)
Restaurant Technology Statistics
- Technology adoption continues to reshape restaurant operations, with automation and AI increasingly viewed as essential rather than optional.
- Millennials show the highest comfort level with restaurant technology, with 85% preferring smartphone-based ordering, 82% favoring contactless payments, and 80% using digital wallets.
- Payment technology is viewed as the area with the greatest potential to improve dining experiences, especially among Gen X and Baby Boomers, cited by 38% of respondents.
- While 76% of operators believe technology provides a competitive advantage, only 13% report satisfaction with their current technology stack
- POS systems remain foundational, with 97% of restaurants using one as the core of their operations
- Software integration is improving, as 67% of operator’s report that most of their tools connect directly with their POS.
- When selecting POS solutions, 35% of operators prioritize comprehensive functionality over individual features.
- Automation adoption is widespread, with 95% or more of restaurants either automating or planning to automate functions such as ordering, invoicing, marketing, inventory, and staff scheduling.
- Improved staff productivity and higher sales rank are the leading benefits of automation.
- Sentiment toward AI remains highly positive, with 89% of operators expressing optimism.
- Nearly 95% of restaurants already use AI in some capacity, most commonly for inventory management (35%), menu optimization (35%), and reservations (32%).
(Sources: National Restaurant Association, TouchBistro)
Restaurant Industry Statistics
- Around 29% of diners eat out at least once a week, while an additional 5% dine out roughly once every six months.
- The Restaurant Performance Index stood at 100.4 in October 2024, signalling expansion since values above 100 indicate industry growth.
- Annual restaurant industry sales are projected at approximately $1.1 trillion, accounting for nearly 3.8% of the US gross domestic product.
- The share of household food spending allocated to restaurants has grown significantly, rising from 25% in 1955 to 56% in 2023
- On average, US consumers allocate 33% of their income to housing, 17% to transportation, and 13% to food.
- Restaurants serve as a key entry point to the workforce, with 1 in 3 Americans getting their first job in the industry and 6 in 10 adults having worked in restaurants at some point.
- Cost pressures remain high, as 52% of restaurant professionals identify elevated food and operating expenses as a top business priority.
(Sources: National Restaurant Association, US Bureau of Economic Analysis, Bureau of Labour Statistics)
Restaurant Employment Statistics
- More than 9 out of 10 restaurants operate with fewer than 50 employees, reinforcing the industry’s small-business structure.
- Staffing challenges remain widespread, with 51% of operators citing labour availability as a key obstacle and 35% citing difficulties with staff training.
- The restaurant industry currently employs approximately 15.5 million workers nationwide.
- Total employment in the sector is expected to reach about 17 million jobs by 2030
- Employee turnover remains exceptionally high, approaching 80%, placing pressure on hiring and training budgets.
- Restaurants employ a higher share of women and minority managers than any other major industry.
- Hiring and training a new hourly employee can cost as much as $5,864, while replacing a manager may cost up to $15,000
- As of November 2024, the US unemployment rate remained relatively low at 4.2%, intensifying labour market competition.
- Wage increases have forced 47% of operators to reduce employee hours over the past year.
- 16% of restaurants have implemented hiring freezes to control rising labour costs.
- Degree attainment trends also affect hiring, with more than 2 million bachelor’s degrees awarded annually, reducing the pool of candidates for entry-level restaurant roles.
- Formal workforce development practices are uneven, with 68% of restaurants providing employee handbooks.
- Only 32% offer sexual harassment training, while 46% support mentorship programs
- Food safety and alcohol certification training is provided by 53% of restaurants.
(Sources: National Restaurant Association, Bureau of Labour Statistics, US Department of Education)
Restaurant Promotion Statistics
- Since 2019, about 67% of restaurants have planned to invest in paid social media advertising.
- Community engagement remains a priority, with 53% of operators planning to sponsor local events or charitable initiatives.
- Facebook and Instagram dominate restaurant marketing, with 91% and 78% of restaurants using them, respectively.
- Instagram and TikTok have seen rapid adoption as promotional tools, especially for reaching younger audiences.
- YouTube remains underutilised, with only 14% of restaurants using it for marketing.
- When responding to negative feedback, 23% of restaurateurs contact customers directly.
- Performance management plays a role in feedback response, as 15% use guest feedback in employee evaluations.
- A small portion of operators, around 2%, report taking no action when receiving negative customer feedback.
(Sources: National Restaurant Association, Restaurant Owner Surveys)
Restaurant Sales and Operations Statistics
- Menu pricing pressure continues, with 71% of restaurants increasing prices due to rising minimum wages.
- Sales monitoring practices vary, as 68% of operators regularly review sales reports.
- Labour reports are reviewed consistently by 45% of restaurant professionals.
- Menu performance reports are tracked by 32% of operators
- A notable 17% of restaurateurs admit they do not regularly review sales, labour, or menu data
- When given additional capital, 47% of restaurant owners say they would prioritise equipment repairs or upgrades.
(Sources: National Restaurant Association, Restaurant Owner Surveys)
QR Code Menus and Contactless Ordering Trends
- About 52% of restaurants in the US have already adopted QR code menus, and adoption is expected to expand further as operators prioritize efficiency and flexibility.
- A strong majority of restaurant operators, around 76%, indicate they plan to continue using contactless technologies as part of their long-term operations.
- Consumer sentiment toward QR menus is largely positive, with 51% of surveyed diners stating that viewing menus via QR codes improves their overall dining satisfaction.
- Digital ordering preferences are rising: 79% of customers favour online ordering and self-service kiosks, while 78% prefer QR code menu ordering.
- The shift toward QR-based menus and ordering accelerated during the pandemic and has since become a standard feature in many dining environments.
(Sources: Square, PYMNTS, Eater, Industry Trend Reports)
Contactless Payment Statistics and Adoption
- One-quarter of consumers now prefer digital or contactless payment methods over traditional cash or physical card transactions.
- QR code–based payments are projected to grow by 240% by 2025, driven by the widespread shift toward cashless transactions.
- Contactless use is already mainstream, with 51% of Americans using options like tap-to-pay cards or mobile wallets.
- Restaurant payment preferences are showing strong momentum: 58% of consumers prefer paying via QR codes, and 70% report positive experiences using them.
- Younger demographics lead adoption, with 43% of Millennials and Gen Z diners choosing contactless payment methods when eating out.
- Online and mobile payment platforms play a central role, with PayPal ranking as the most widely used digital payment service in the US.
- The number of proximity mobile payment users in the US has reached approximately 92.3 million, highlighting rapid penetration.
- Contactless payment transactions have surged by 150% across the US market.
- Global consumer behaviour reflects similar trends, with 8 out of 10 respondents reporting first-time QR code payment usage in early 2021
- Beyond restaurants, 58% of consumers say they prefer having QR code payment options available while dining out and grocery shopping.
(Sources: Deloitte, Mastercard, Datassential, Statista, Visa, HubSpot)
Conclusion
Restaurant industry statistics highlight a sector that is adjusting quickly to new economic realities, evolving dining habits, and accelerating digital adoption. While full-service restaurants continue to anchor overall industry activity, faster growth in quick-service formats, delivery models, and cloud kitchens reflects a clear shift toward convenience-led consumption. Data also points to ongoing pressure from labour shortages, wage growth, and operational costs, pushing operators to rely more heavily on automation and technology.
At the consumer level, increased dining frequency, greater sensitivity to value, and stronger engagement through online platforms and loyalty programs are reshaping how restaurants attract and retain customers. Overall, the statistics portray an industry that remains resilient but increasingly depends on efficiency, digital integration, and the ability to respond quickly to changing customer expectations.
FAQ’s
Restaurant industry statistics are structured data points that measure performance, behaviour, and trends across the foodservice sector. They are important because they provide an objective basis for understanding market dynamics, consumer demand patterns, operational efficiency, and long-term structural changes within the industry.
Restaurant industry statistics typically yield insights into revenue performance, segment contribution, pricing behaviour, labour trends, technology adoption, and consumer preferences. These insights help explain how different forces interact to shape industry growth and competitive positioning.
Restaurant industry statistics often mirror wider economic conditions, such as inflation, employment levels, and disposable income, as well as social trends like urbanization, lifestyle shifts, and digital consumption. Changes in dining frequency, delivery usage, and spending patterns provide measurable signals of these broader influences.
In market analysis, restaurant industry statistics are used to assess market size, segment performance, growth drivers, and risk factors. Researchers rely on these data points to build forecasts, evaluate competitive intensity, and identify emerging opportunities across formats and regions.
Restaurant industry statistics support strategic planning by providing evidence-based inputs for decisions on expansion, pricing strategies, technology investments, staffing models, and customer engagement. They reduce uncertainty by grounding business decisions in measurable industry behaviour.