
Introduction
Shared Mobility Statistics: The Global Shared Mobility Market is currently undergoing substantial expansion, influenced by various factors including urbanization, rising traffic congestion, environmental issues, and a transition towards sustainable transportation options.
Services related to shared mobility, such as ride-hailing, car-sharing, bike-sharing, and scooter-sharing, are becoming increasingly popular due to their convenience, affordability, and adaptability. Projecting market participants like Uber, Lyft, Didi Chuxing, and Lime are broadening their services on a global scale, while conventional automotive manufacturers are also venturing into the shared mobility sector.
The market is experiencing technological innovations, including the incorporation of AI, IoT, and electric vehicles, aimed at improving user experience and operational effectiveness. Government initiatives that support shared mobility, along with the emergence of Mobility as a Service (MaaS) platforms, are additionally propelling market growth and influencing the future landscape of transportation.
Editor’s Choice
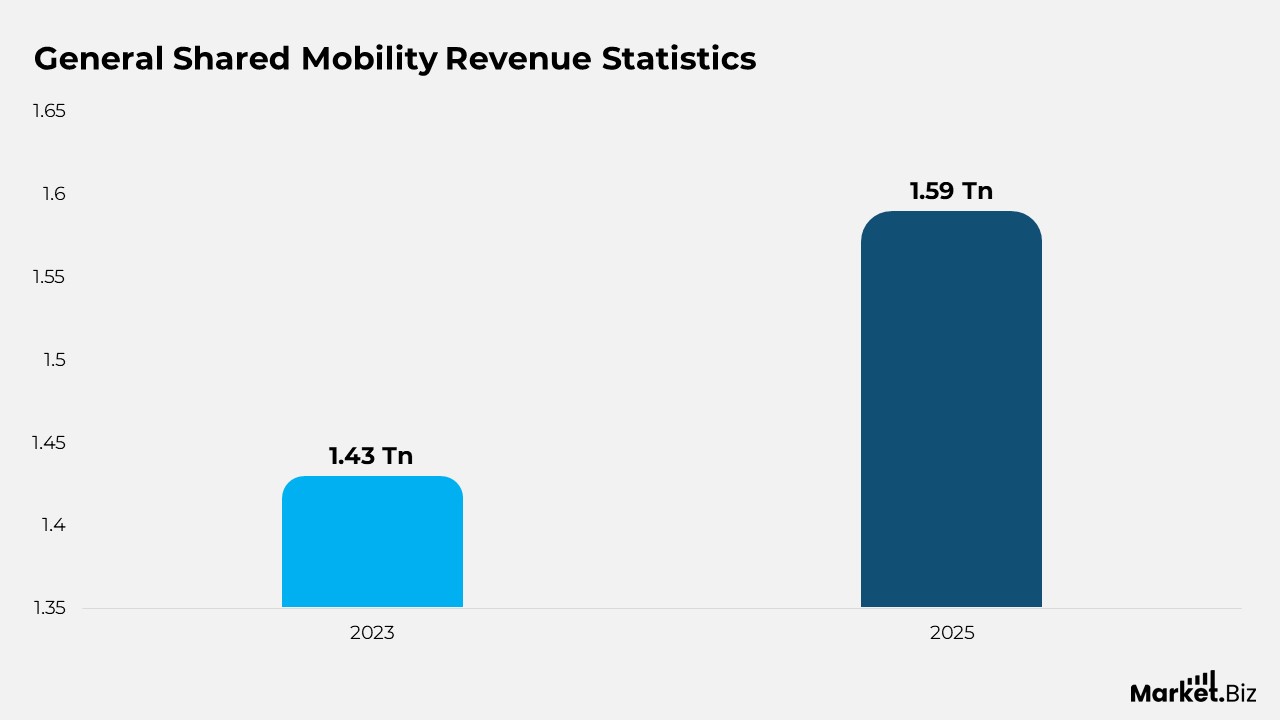
- The worldwide revenue for the shared mobility sector is expected to reach US$1.43 trillion in 2023.
- The market is predicted to see an annual growth rate of 5.06% (CAGR from 2025 to 2030), resulting in an estimated market volume of US$2.04 trillion by 2030.
- The Global Shared Mobility User Base, categorized by Type (in millions of users), has exhibited notable fluctuations from 2017 to 2029.
- The Global Shared Mobility Market Revenue has undergone considerable transformations from 2017 to 2029, with a compound annual growth rate (CAGR) of 3.51%.
- In Asia, Japan has a revenue share of USD 44 billion, with South Korea trailing at USD 25 billion.
- The utilization of shared car services has increased by 22% from the third quarter of 2022 to the third quarter of 2023.
- The global user base for ride-hailing and taxi services has experienced steady growth from 2020 to 2029.
What is Shared Mobility?
Shared mobility is a concept that encompasses transportation methods in which a vehicle is owned by an operator, allowing the public to rent it for personal use over a specified duration. Users have the opportunity to share a vehicle as a personal rental when needed, opting to rent the entire vehicle; this distinguishes it from traditional public transport.
By utilizing shared mobility, users are relieved from the obligation of purchasing a vehicle, as the operator retains ownership and permits others to rent it for a designated timeframe. This arrangement enables users to collectively share the expenses related to vehicle ownership, thus forming a blend of private vehicle usage and mass or public transportation.
General Shared Mobility Statistics
- The worldwide revenue for the shared mobility sector is expected to reach US$1.43 trillion in 2023.
- It is estimated that shared mobility will represent 7% of all urban transport trips globally by 2030, up from 3% in 2023.
- The shared mobility industry is projected to generate a revenue of US$1.59 trillion worldwide by 2025.
- The market is predicted to see an annual growth rate of 5.06% (CAGR from 2025 to 2030), resulting in an estimated market volume of US$2.04 trillion by 2030.
- Flights are expected to be the largest segment, with a market volume anticipated to reach US$685.12 billion by 2025.
- By 2030, the number of users in public transportation is forecasted to increase to 4.99 billion.
- In the shared mobility sector, the user perception rate is projected to rise from 67.6% in 2025 to 75.7% by 2030.
- The average revenue per user is anticipated to be US$300.06.
- In contrast to other nations, China is projected to yield the highest revenue, amounting to US$382 billion by 2025.
- Notwithstanding the COVID-19 pandemic, shared mobility services are continuing to prosper in countries like Germany, France, and the United States.
Moreover
- The global shared mobility market is anticipated to expand at a compound annual growth rate (CAGR) of 41.65% from 2023 to 2030.
- It was estimated that over nine million individuals earned income from shared mobility services in 2023, with projections indicating an increase to 16 million by 2030.
- In the shared vehicles sector, the user base is projected to reach 5.09 billion by the year 2027.
- The anticipated average revenue per user (ARPU) is estimated to be US$180.90 in 2023.
- In a global context, the majority of revenue from shared mobility is produced in China, amounting to US$358 billion in 2023.
- Africa exhibits the most significant income growth from shared mobility services, with job opportunities expected to rise by 113% between 2023 and 2030.
- Ride-hailing drivers generally earn more than the minimum wage in Europe, with increases of 37% in Berlin and 91% in Tallinn, and they also earn more than those in similar skill-level jobs in Africa, with earnings up to 130% higher in South Africa and Nigeria.
Shared Mobility Users Statistics
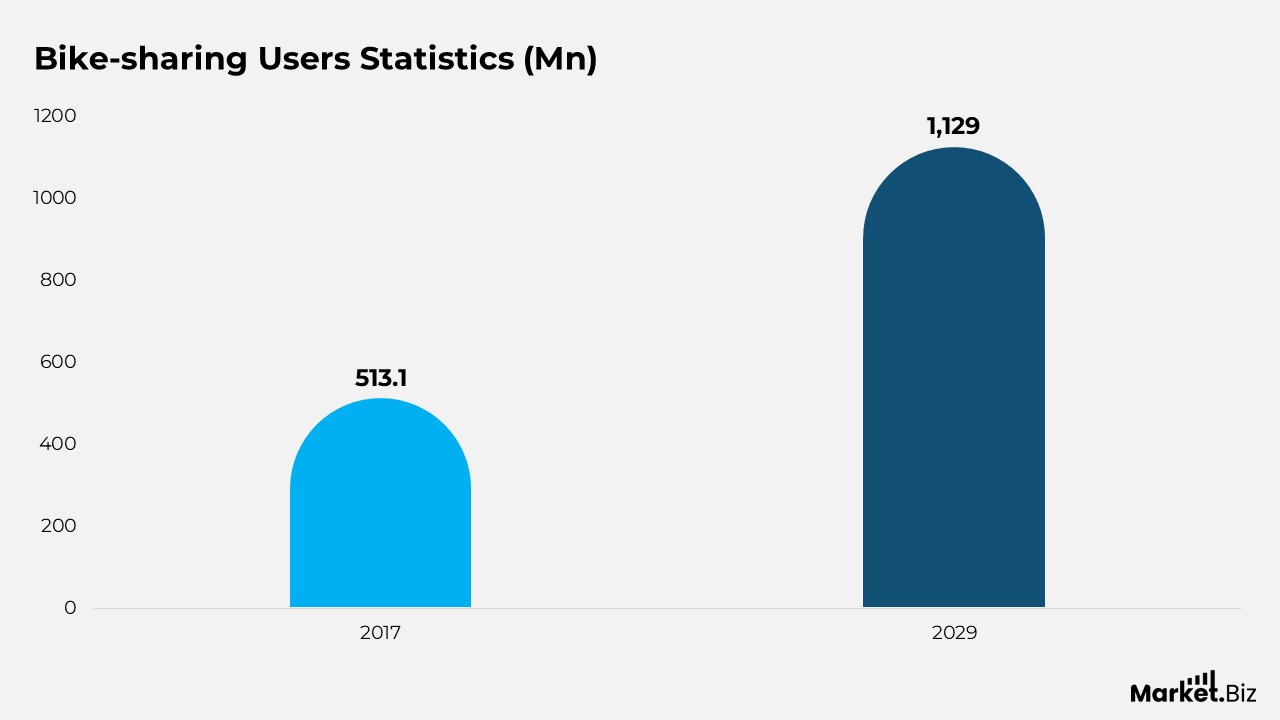
- The Global Shared Mobility User Base, categorized by Type (in millions of users), has exhibited notable fluctuations from 2017 to 2029.
- Bike-sharing experienced consistent growth, increasing from 513.1 million users in 2017 to an anticipated 1,129 million users in 2029, which reflects its growing popularity.
- Bus ticket usage saw a modest rise from 471.3 million users in 2017 to 604 million users in 2029, indicating a steady demand.
- In contrast, car rentals faced a decline to 284.6 million users in 2020 but are projected to recover to 815.3 million users by 2029.
- Car-sharing commenced with 36.04 million users in 2017 and gradually expanded to 68.19 million users by 2029, while e-scooter-sharing experienced a remarkable increase from just 0.52 million users in 2017 to an expected 107.4 million users in 2029, signifying rapid adoption.
- The flight sector saw a significant drop to 371.1 million users in 2020 due to pandemic-related restrictions, but is forecasted to rebound robustly to 1,391 million users by 2029.
- Moped-sharing demonstrated exponential growth, rising from 0.25 million users in 2017 to 45.68 million users by 2029.
- Public transportation maintained its status as the largest segment, growing from 4,066 million users in 2017 to 5,174 million users by 2029, recovering from a dip to 3,659 million users in 2021.
- Ride-hailing services experienced a steady increase in users, rising from 1,310 million in 2017 to a projected 2,305 million in 2029.
- Conversely, taxi services showed a downward trend, decreasing from 1,375 million users in 2017 to 995.2 million users in 2029.
Shared Mobility Market Size
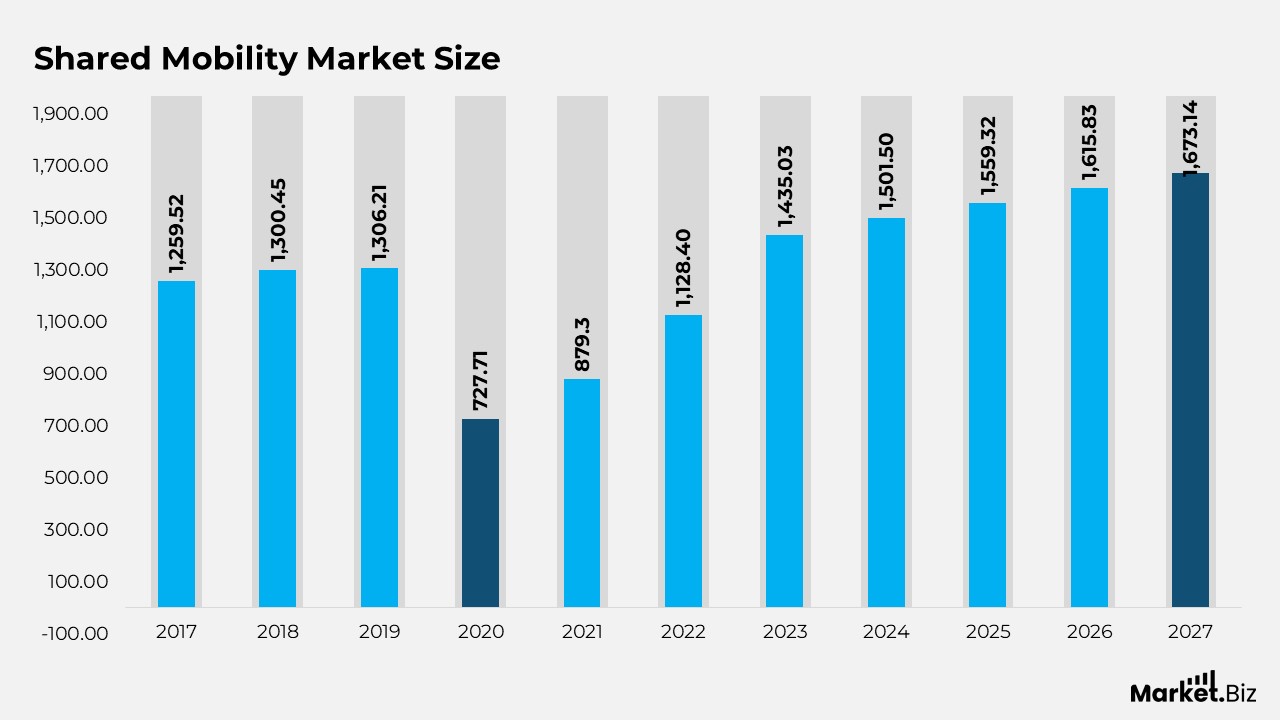
- The Global Shared Mobility Market Revenue has undergone considerable transformations from 2017 to 2029, with a compound annual growth rate (CAGR) of 3.51%.
- Beginning at USD 1,259.52 billion in 2017, the market demonstrated steady growth in 2018, reaching USD 1,300.45 billion, and further increased to USD 1,306.21 billion in 2019.
- However, in 2020, there was a significant decline in revenue to USD 727.71 billion, largely attributed to the global repercussions of the COVID-19 pandemic.
- In 2021, the market initiated its recovery, achieving USD 879.3 billion, followed by a remarkable rise in 2022 to USD 1,128.4 billion.
- By 2023, the market revenue escalated to USD 1,435.03 billion, indicating strong growth.
- This upward trajectory is expected to persist, with revenues projected at USD 1,501.5 billion in 2024, USD 1,559.32 billion in 2025, and USD 1,615.83 billion in 2026.
- Additional growth is anticipated through 2027 and 2028, with revenues expected to reach USD 1,673.14 billion and USD 1,727.28 billion, respectively.
- By 2029, the market is forecasted to attain USD 1,784.22 billion, signifying steady expansion throughout the forecast period.
Country-wise Shared Mobility Market
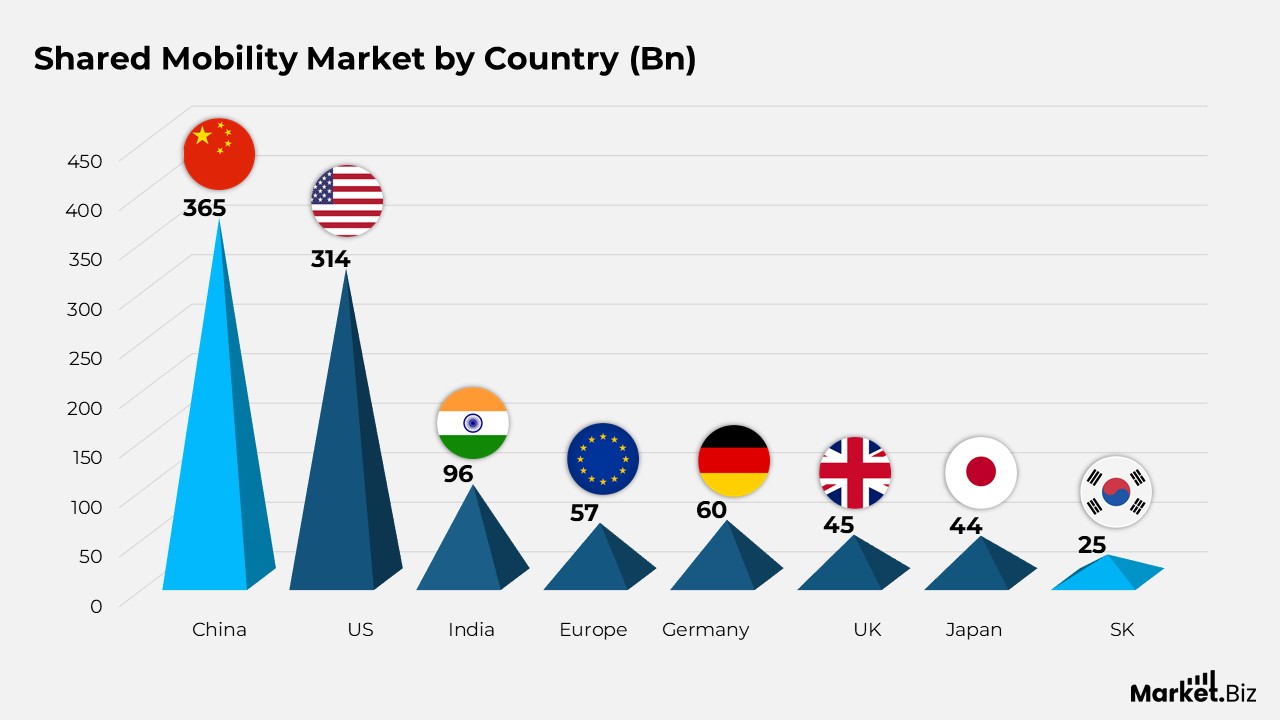
- The revenue generated by the Global Shared Mobility Market by Country for 2024 underscores China’s leading role, with a projected revenue of USD 365 billion, closely trailed by the United States at USD 314 billion, highlighting their substantial contributions to the market.
- India holds the third position with USD 96 billion, indicating the increasing adoption of shared mobility services in the area.
- In Europe, Germany and the United Kingdom report revenues of USD 57 billion and USD 60 billion, individually, while France contributes an additional USD 45 billion to the overall total.
- In Asia, Japan has a revenue share of USD 44 billion, with South Korea trailing at USD 25 billion.
- Russia adds USD 34 billion, showcasing its position among the leading markets.
- Canada in North America contributes USD 21 billion, and Australia completes the list with USD 20 billion.
Shared Mobility Market by Region
- The global shared mobility market size across various regions has exhibited diverse trends from 2017 to 2029, showcasing notable growth in Europe, the Middle East, Africa (EMEA), Latin America, Asia Pacific, and North America.
- In 2017, the market size was recorded at $407 billion in EMEA, $84.44 billion in Latin America, $504.1 billion in Asia Pacific, and $282.1 billion in North America.
- In 2019, Asia Pacific achieved a market size of $539.9 billion, EMEA reached $410.6 billion, Latin America experienced a slight decline to $76.59 billion, and North America increased to $297.9 billion.
- The pandemic in 2020 had a profound effect on the market, causing Asia Pacific to contract to $344 billion, EMEA to $218.7 billion, Latin America to $35.93 billion, and North America to $138.1 billion. Recovery commenced in 2021, with Asia Pacific rebounding to $390.9 billion, EMEA at $249.2 billion, and North America recovering to $208.9 billion.
- By 2022, the Asia Pacific region surged to $448.8 billion, while EMEA and North America expanded to $328.6 billion and $301 billion, respectively. Projections for 2023 suggest that Asia Pacific will reach $612.8 billion, EMEA will be at $414.7 billion, North America will attain $347.4 billion, and Latin America will be at $82.61 billion.
- The market is anticipated to experience steady growth through 2029, with Asia Pacific leading at $799.2 billion, followed by EMEA at $509.5 billion, North America at $396.1 billion, and Latin America at $105.3 billion.
Cars in Shared Mobility Statistics
- The utilization of shared car services has increased by 22% from the third quarter of 2022 to the third quarter of 2023.
- The car-sharing industry was valued at USD 2.9 billion in 2022 and is expected to show a compound annual growth rate (CAGR) of approximately 20% from 2023 to 2032.
- In 2023, Riga experienced the most significant rise in car ridership in Europe, attributed to the launch of Bolt Drive. Antwerp followed closely, ranking second in growth due to the introduction of Miles Mobility.
- German cities remain at the forefront of the rankings for total ridership per city. In Berlin, the number of shared vehicles on the streets has increased by 30% compared to 2022.
- Globally, the ride-hailing market is expected to expand by 6.97% from 2023 to 2028, leading to a market volume of USD 215.70 billion by 2028.
- Ride-hailing services are projected to reach a record number of users in 2023, with an additional 6.6 million users in the United States, marking a 10.1% increase and finally recovering from the losses incurred during the pandemic.
- In the United States, ride-hailing services are reported to be utilized more frequently than traditional taxis, with approximately 20% of survey respondents indicating they are occasional users of ride-sharing services.
Ride-Hailing & Taxi in Shared Mobility
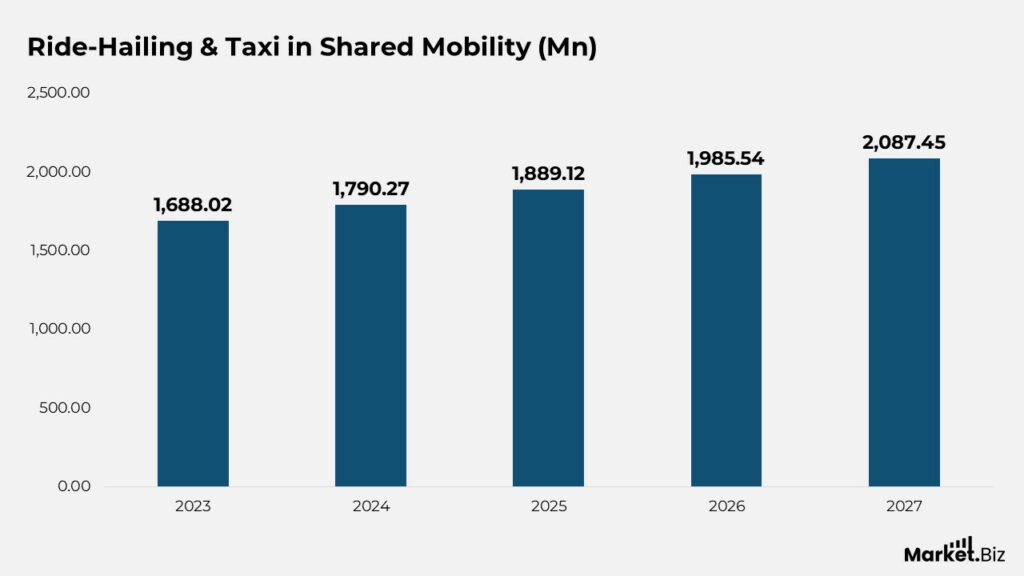
- The global user base for ride-hailing and taxi services has experienced steady growth from 2020 to 2029.
- In 2020, the number of users was recorded at 1,505.72 million, which increased to 1,569.88 million in 2021 and further rose to 1,626.47 million in 2022.
- By 2023, the total user count reached 1,688.02 million, indicating a rising global demand for ride-hailing and taxi services.
- This upward trajectory is expected to persist into the forecast years, with projections indicating that the user count will reach 1,790.27 million in 2024, exceeding 1,889.12 million in 2025.
- By 2026, the user base is anticipated to expand to 1,985.54 million, surpassing the 2 billion threshold in 2027 at 2,087.45 million.
- The growth is expected to accelerate further in 2028, with an estimated 2,194.21 million users, culminating in a total of 2,305.32 million users by 2029.
Conclusion
Shared mobility represents a swiftly expanding global market, anticipated to attain a value in the hundreds of billions of dollars by the early 2030s. This growth is propelled by factors such as urbanization, cost efficiency, and heightened environmental consciousness.
Notable statistics highlight its substantial role in decreasing vehicle kilometers traveled and emissions through enhanced fleet utilization, coupled with a robust movement towards sustainability via electric vehicles and digital platforms.
However, challenges persist, including critiques regarding increased congestion and emissions resulting from additional trips, as well as the platform economy’s effects on labor. Nevertheless, shared mobility is generally regarded as a vital solution for providing efficient, cost-effective, and environmentally sustainable urban transportation.
FAQs
Mobility denotes the ability to move freely. If a basketball injury leads to a reduction in mobility in your knee, it signifies that you are unable to move it efficiently. Mobility generally relates to the capacity to move an injured body part, such as a limb or joint, but it can also refer to movement in a more general context.
According to Statista, the global number of car-sharing users is projected to reach approximately 73.2 million by 2030, driven by the lifestyle preferences of millennials and advancements in technology. ABI research predicts that by 2030, 400 million people will rely on Robotic Car Sharing.
Shared Autonomous Vehicles (SAVs) are either standard vehicles that have been adapted to provide autonomous features or vehicles specifically designed for the secure transport of individuals from one place to another. The key difference between SAVs and driverless cars is that SAVs are meant for use by multiple passengers.