
Introduction
TikTok Engagement Statistics: With 2.66 billion users globally, TikTok ranks as the 5th most popular social media platform. It has primarily attracted the interest of Gen Z demographics. TikTok has changed from a viral social media site into a significant player in digital marketing, entertainment, and e-commerce.
Although it is banned in India, TikTok has over a billion users and some of the highest engagement rates among social platforms, continuing to redefine how brands engage with their audiences.
Its AI-driven recommendation system, short-form video format, and interactive features have established it as the preferred platform for content consumption, product discovery, and influencer marketing. Currently, TikTok is used by 30.95% of social media users worldwide and 29.15% of Internet users.
Editor’s Choice
- In 2024, the average engagement rate for TikTok content was recorded at 4.64%, down from 5.77% in 2023.
- Users of TikTok spend approximately 58 minutes daily on the application, reflecting high levels of engagement.
- TikTok’s engagement rate has shown relative stability, with a minor decline from 2.65% in 2023 to 2.5% in 2024, marking a 5.6% decrease year-over-year.
- TikTok generated $23 billion in revenue, with 80% resulting from advertising.
- In the United States, TikTok achieved $10 billion in revenue.
- The use of TikTok among social media marketers has risen by 15% annually.
- The typical user dedicates 58.4 minutes daily to the app.
- 73% of TikTok users engage with content recommended by the algorithm.
General TikTok Engagement Statistics
- TikTok is anticipated to have a user base of 1.6 billion monthly active users in 2025, an increase from 1 billion in 2023.
- In the United States, it is projected that TikTok will reach 117.9 million monthly active users in 2025, representing 32.9% of the population.
- Users of TikTok spend approximately 58 minutes daily on the application, reflecting high levels of engagement.
- The platform has an average engagement rate of 2.5% based on follower count, establishing it as the most engaging social media platform available.
- TikTok’s engagement rate has shown relative stability, with a minor decline from 2.65% in 2023 to 2.5% in 2024, marking a 5.6% decrease year-over-year.
- Influencers with fewer than 15,000 followers on TikTok enjoy an average engagement rate of 17.96%, which is significantly higher than that of macro-influencers.
- Between March and August 2023, TikTok videos exceeding 54 seconds in length garnered an average engagement rate of around 6.7%.
- In 2024, the average engagement rate for TikTok content was recorded at 4.64%, down from 5.77% in 2023.
Moreover
- Approximately 55% of TikTok’s user demographic is under the age of 30, with 25% falling within the 18–24 age range and 35% within the 25–34 age range.
- The user base of TikTok consists of 54.8% females and 45.2% males.
- 39% of purchases are influenced by TikTok, underscoring its effect on consumer behaviour.
- TikTok advertisements reached 1.59 billion users in January 2025, which is equivalent to 19.4% of the global population.
- In 2024, TikTok’s average engagement rate saw a 40% decline year-over-year, stabilizing at 3.30%.
- Despite an overall engagement drop of 35% in the past year, TikTok still has the highest engagement rate among social media platforms at 2.65%.
- The U.S. user base of TikTok grew from 150 million in February 2023 to 170 million in January 2024.
- TikTok ranks as the second most downloaded application, with nearly 4.1 billion downloads overall.
- As of May 2024, the Asia-Pacific region comprises 28.62% of TikTok’s monthly active users, followed by the Middle East and Africa at 22.55%.
- In January 2025, TikTok’s advertising reach expanded by 31.2 million users (+2.0%) compared to January 2024.
- In 2024, brands using TikTok achieved an average engagement rate of around 3-5%, surpassing the usual 1-2% observed on other social media platforms.
TikTok Growth Statistics
- TikTok’s advertising planning tools indicate that the global potential audience reach for TikTok rose by 2.0% in the 12 months previous the production of this report.
- Marketers were able to engage with 31.2 million additional users through TikTok advertisements in January 2025 compared to the same month the previous year.
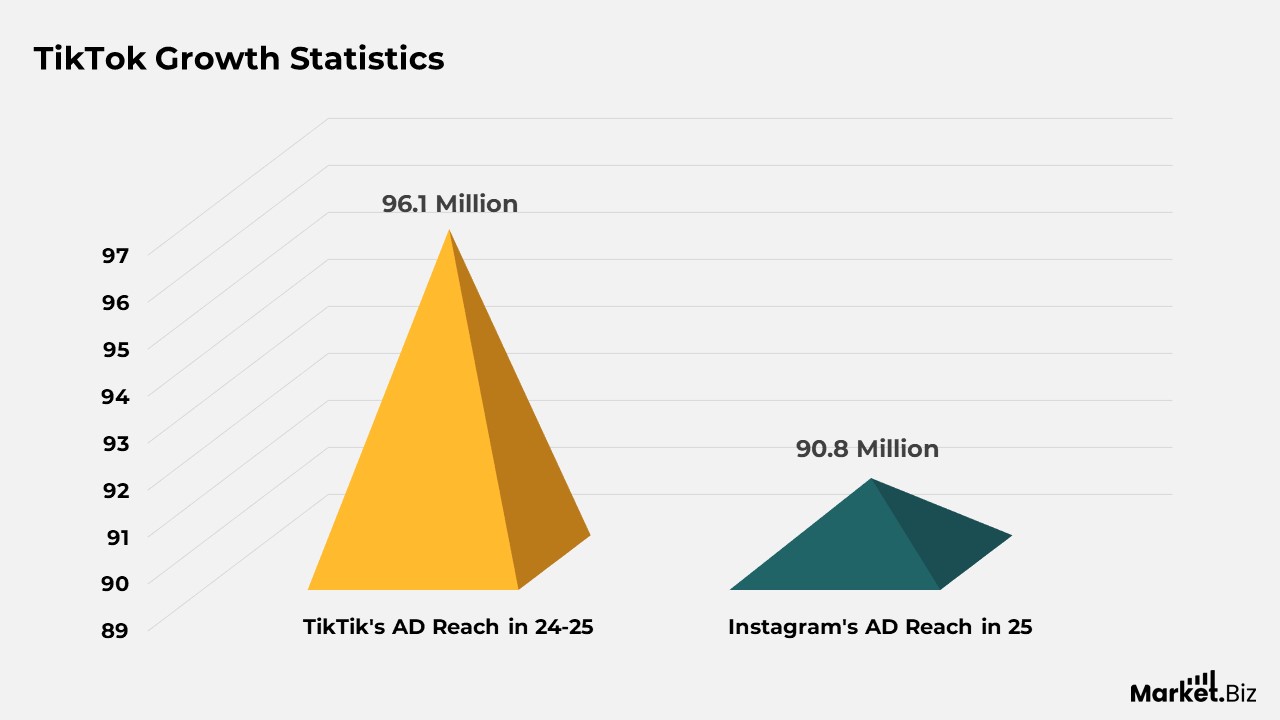
- However, TikTok’s potential advertising reach saw a decline of 96.1 million (-5.7%) during the three months from October 2024 to January 2025.
- In contrast, Instagram’s global advertising reach grew by around 5.5% or 90.8 million in the 12 months in January 2025. Suggesting that TikTok’s reported reach expanded at a slower rate than that of Instagram during this timeframe.
- Additionally, data from Snapchat’s advertising planning tools reveals that the platform’s full potential reach improved by 4.6% from 31.1 million in January 2024 to January 2025. Further indicating that TikTok’s reported reach grew at a slower pace than Snapchat’s reported reach over the past year.
Statistics of TikTok Business
- TikTok generated $23 billion in revenue, with 80% resulting from advertising.
- In the United States, TikTok achieved $10 billion in revenue.
- 7 billion businesses are using TikTok in the US.
- TikTok hosts 225,000 business brands.
- The platform generated $14.7 billion for small and medium-sized enterprises, contributing an additional $24.2 billion in overall economic activity.
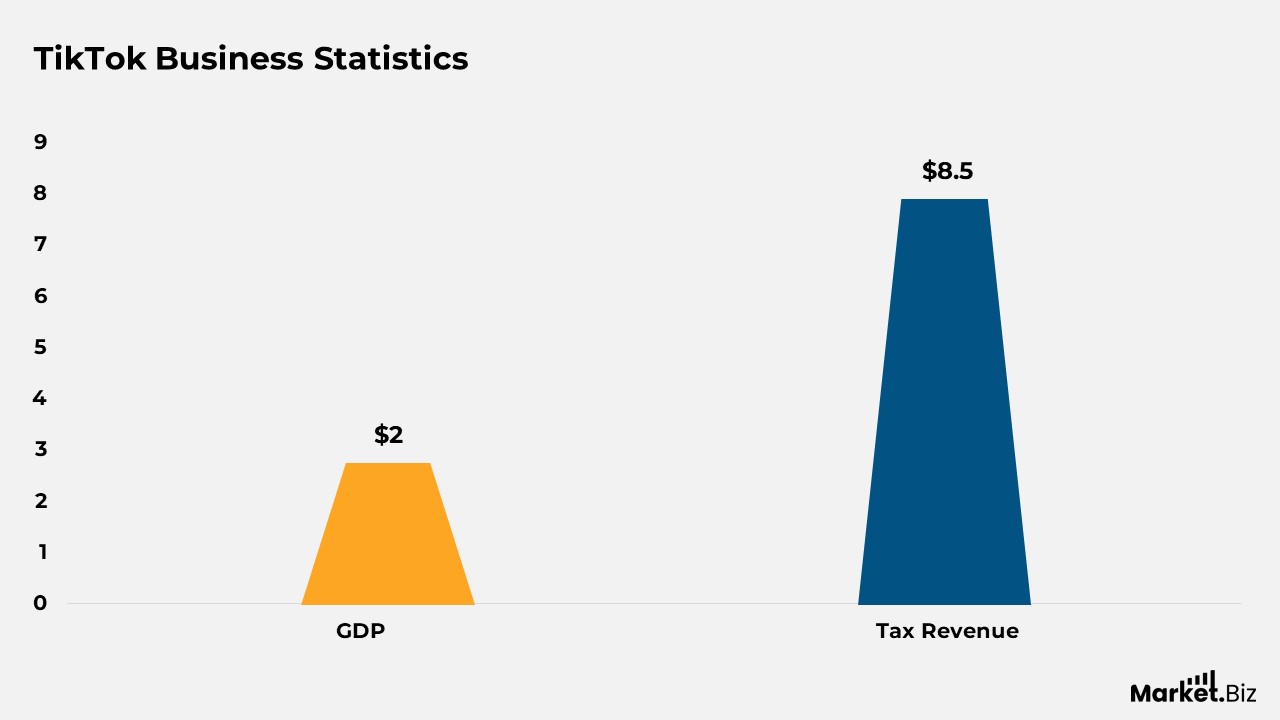
- TikTok’s operations in the US contributed $8.5 billion to the GDP and $2 billion in tax revenue.
- A significant 81% of TikTok users report that the platform has introduced them to interests they were previously unaware of.
- TikTok is ranked 4th in terms of marketer ROI confidence.
- 62% of TikTok users believe that brands should analyse comments to better understand their audience.
- US TikTok ad revenue is projected to reach $9.5 billion in 2025, reflecting a 22.9% annual growth.
- The total potential reach for advertisements on TikTok includes 1.5 billion adults.
TikTok Marketing Statistics
- The use of TikTok among social media marketers has risen by 15% annually.
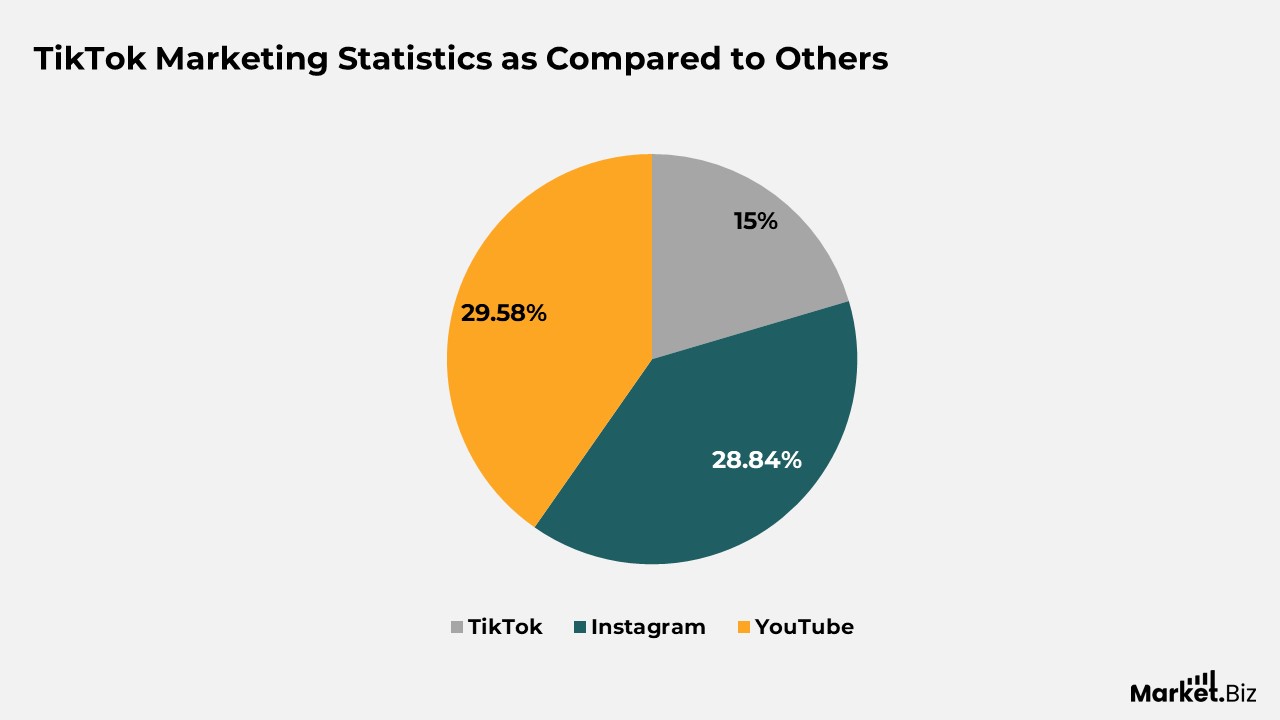
- 27% of marketers plan to boost their investment in TikTok in 2025, trailing behind Instagram (28.84%) and YouTube (29.58%).
- The optimal times for posting on the platform are between 6-9 p.m., 3-6 p.m., and 12-3 p.m., with Friday being the most favorable day.
- A study indicates that one in ten Gen-Z individuals is more inclined to depend on TikTok rather than Google.
- More than 40% of Americans use TikTok as a search engine.
- According to marketers, TikTok boasts the third-highest engagement rate. Among those surveyed, 13% indicated that TikTok has the highest engagement rate. With Facebook (22%), YouTube (23%), and Instagram (23%) ranking above it.
- In the fourth quarter of 2024, TikTok video downloads reached 186 million.
- TikTok has stated that a select number of U.S.-based employees can “heat” videos, meaning they can intervene to enhance their viewership.
TikTok User Behavior
- According to Oberlo, the typical user dedicates 58.4 minutes daily to the app.
- 73% of TikTok users engage with content recommended by the algorithm.
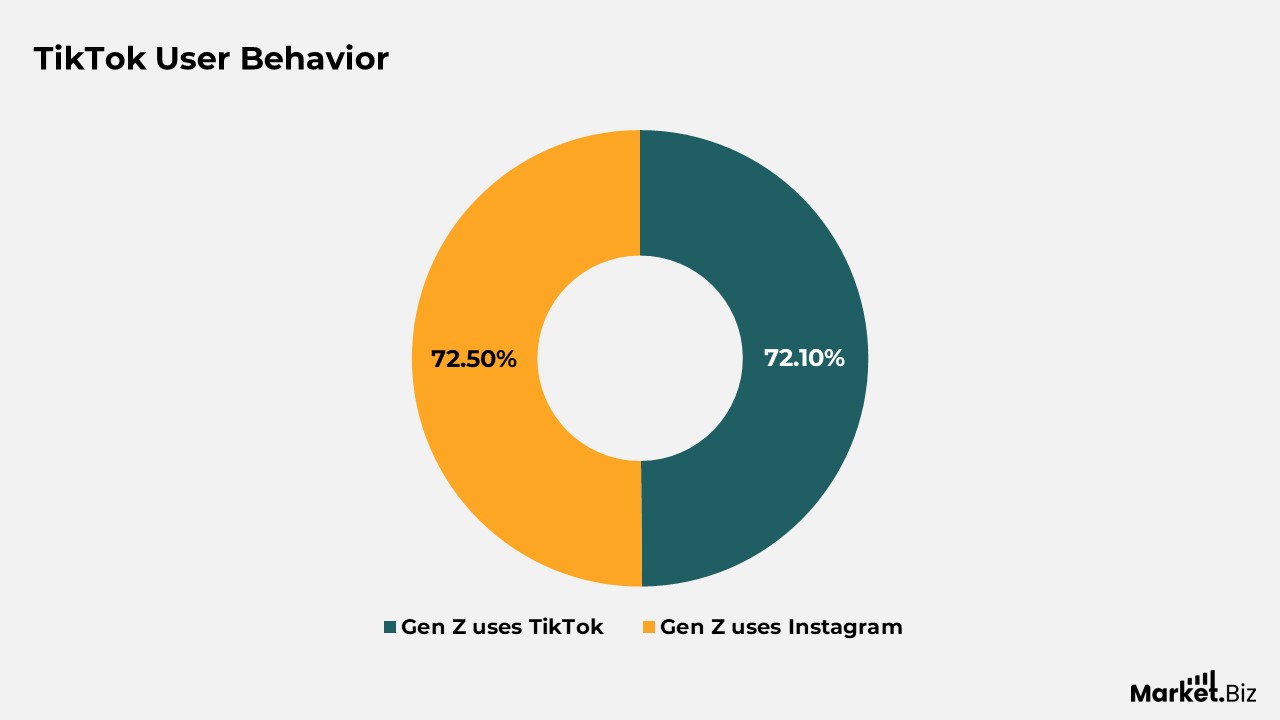
- Currently, 72.1% of Generation Z is active on TikTok, while 72.5% use Instagram.
- Viewers show a 41% increase in trust towards a brand after encountering an advertisement on TikTok, and they are 31% more inclined to demonstrate brand loyalty.
- Users of TikTok are 1.5 times more inclined to purchase products they discover on the platform.
- Individuals are 1.8 times more likely to concur that TikTok exposes them to new subjects they were previously unaware of enjoying.
- TikTok is 20% more likely to capture a user’s complete attention compared to other video streaming services.
- Millennial users of TikTok are 2.3 times more likely than their counterparts to create a post and tag a brand.
- One-fourth of U.S. adults under the age of 30 frequently obtain news through TikTok.
- 52% of U.S. adults on TikTok have never uploaded a video to the platform.
- On TikTok, around 25% of the most active U.S. adults account for 98% of the public content produced.
- The most searched topics by consumers on TikTok include new recipes (36%), followed by new music (35%) and DIY tips (34%).
Engagement Rate of TikTok by Follower
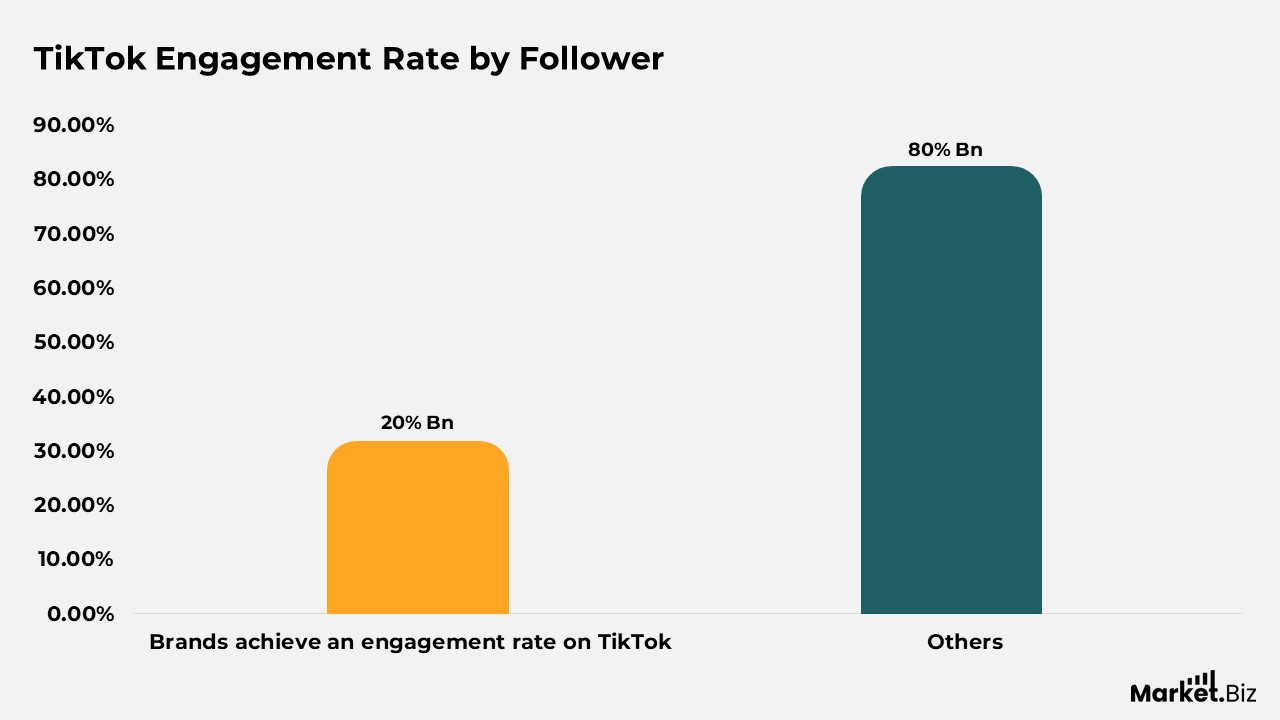
- Approximately 20% of brands achieve an engagement rate by followers of 8% or higher.
- Equally, nearly half of the brands analyzed displayed an engagement rate of less than 2%.
- Accounts with fewer than 50,000 followers experience average engagement rates of around 3%.
- On the other hand, larger accounts having over 1 million followers report their per-video average engagement per follower at just below 2%.
- The Food & Beverage sector, with an average engagement rate of 4%, completes the top three industries.
- Brands in the Health & Beauty and Fashion categories perform significantly below the cross-industry average.
- This year on TikTok, the platform averaged an impressive 42.4% engagement rate by follower, along with over 20 million views per video.
TikTok Engagement by Follower Count
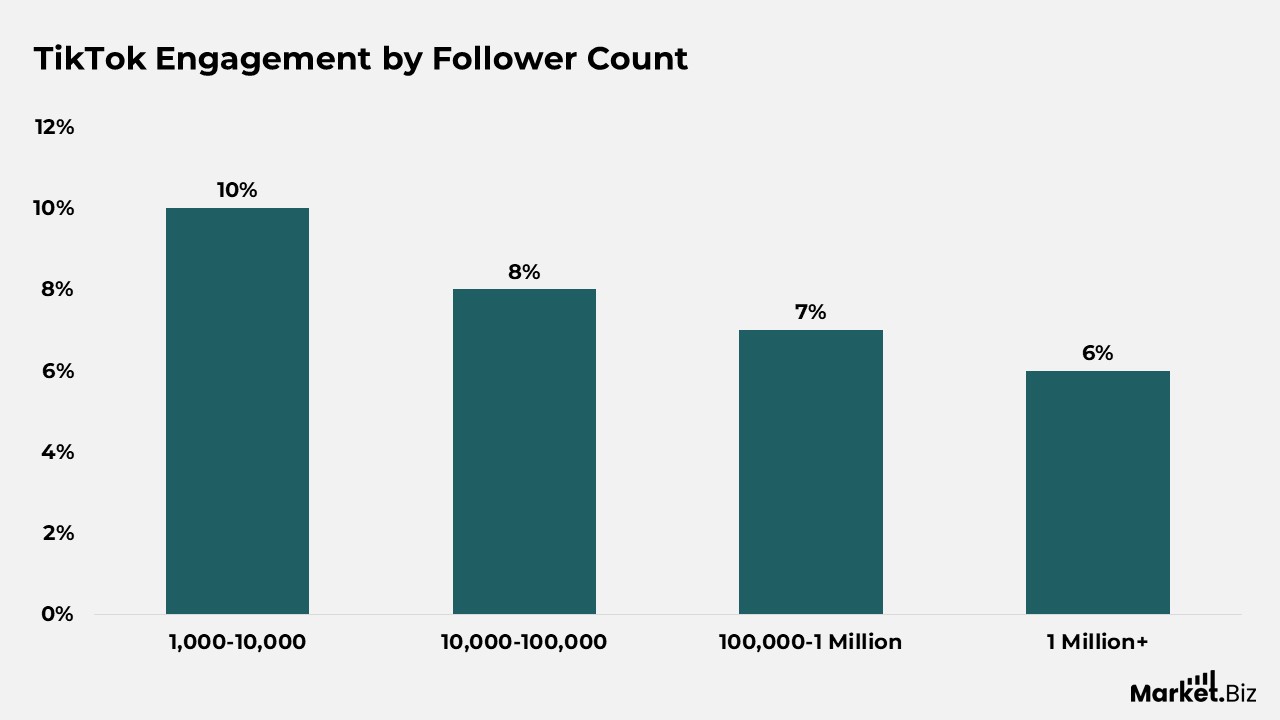
- For a micro influencer with a follower count ranging from 1,000 to 10,000, an engagement rate of approximately 10% or more is anticipated.
- In the case of mid-tier influencers, who have between 10,000 and 100,000 followers, a good engagement rate would be around 6% to 8%.
- When one enters the realm of macro-influencers, defined as having between 100,000 and 1 million followers. An engagement rate of 5% to 7% is deemed satisfactory.
- Upon reaching the status of a mega-influencer, characterized by having over 1 million followers, a solid engagement rate would fall between 4% and 6%.
- It is noteworthy that smaller accounts tend to experience higher engagement rates due to the establishment of more personal connections. Therefore, as follower counts increase, while the overall engagement may be significantly higher, the engagement rate itself is likely to decrease.
Viral Trends and Influencers on TikTok
- As of January 2025, Khaby-Lame holds the title of the most followed creator on TikTok, boasting 162.4 million followers. Close behind is Charlie D’Amelio, with 155.8 million followers.
- Among marketers collaborating with influencers or creators, 67% engage with micro-influencers. Defined as those with 10,000 to 99,999 followers or subscribers. In contrast, only 17% choose to work with mega influencers, who have over 1 million followers or subscribers.
- When selecting influencers to partner with, 47% of marketers prioritize the quality of the influencer’s content.
- In 2024, 90% of marketers plan to either sustain or increase their investment in influencer marketing.
- Advertisements featuring creators on TikTok have resulted in a 26% rise in brand favorability among users of social and video platforms.
- In the United States, there are 27 million paid content creators, with 44% of them working full-time.
- Warner Music Group collaborated with six TikTok influencers, garnering over 1.5 million likes. Achieving an average engagement rate of 17% and generating 13.4K user-generated videos.
Conclusion
TikTok Engagement Statistics: TikTok’s continuous growth and ongoing engagement rates have established it as a leading tool in the world of digital entertainment and marketing. As the platform continues to provide unmatched projections for brands, creators, and advertisers, its dynamic character necessitates continual adjustment.
With engagement rates varying and rivalry from platforms such as YouTube Shorts and Instagram Reels growing stronger, companies are required to improve their content strategies to stay relevant.
The rising use of AI-powered recommendations, in-app shopping features, and interactive advertising formats indicates a transition towards more profound audience engagement and all-in-one integration of e-commerce.
FAQs
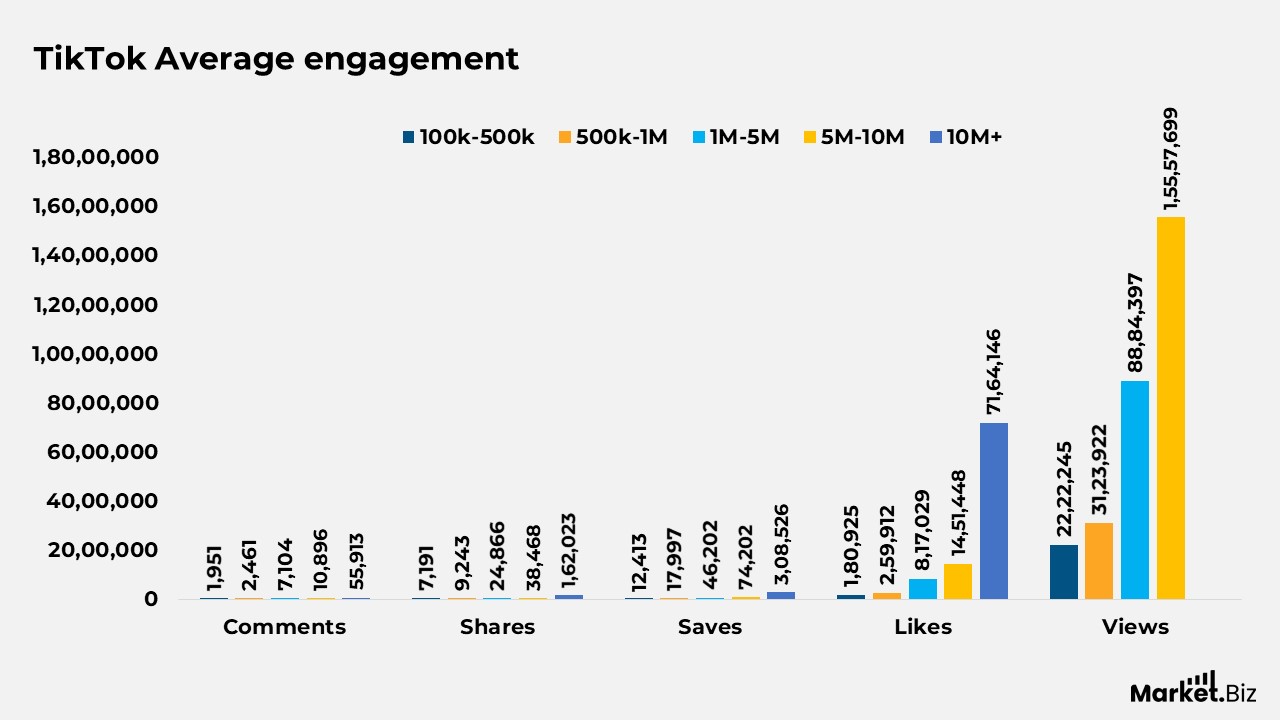
On TikTok, the engagement rate encompasses likes, comments, shares, and saves. It is generally calculated by summing the total engagement (comments, shares, likes, and saves) and dividing that figure by the total number of views, subsequently multiplying by 100 to express it as a percentage.
Engagement rates on TikTok can fluctuate based on various factors, including follower count and the specific industry. The median engagement rate serves as a valuable benchmark for assessing your performance relative to industry norms. Typically, a good engagement rate falls within the range of 6-10%, although this can differ based on the size of your account.
A “good” engagement rate can differ, but in general, any rate exceeding 3% is deemed strong, while 6% or more is considered excellent. Nonetheless, it is essential to take into account factors such as your industry, the platform utilized, and the demographics of your audience, as perceptions of what constitutes a good rate can vary. For instance, a niche audience may exhibit a lower engagement rate yet possess a highly dedicated following.