
Introduction
Instagram Stories statistics: Instagram Stories have grown in users, reaching over 500 million daily active users. Indicating their significant tool in moment-by-moment content consumption. Brands have found a way to stay relevant: posting as much as 5 times a day can achieve a solid 70% retention of views, highlighting the frequency and storytelling strategy at work to keep the viewer engaged.
About 36% of businesses now consider themselves active in the stories environment, and one-third of the most viewed stories are from brands, highlighting growth in a form of media seen as effective for visibility, conversion, and purchase opportunities. These statistics are telling for both marketers and creators alike, specifically the stories of real-time reach, engagement, and brand impact.
Editor’s Choice
- Instagram stories are utilized by 500 million users daily (Instagram internal data, January 2019)
- 71.9% of brand content on Instagram is found in Stories.
- Instagram’s advertising revenue increased from $3.4 billion in 2017 to $61.1 billion in 2023.
- Instagram stands as the leading platform for fashion brands to creatively display their products.
- Macro-influencers with 500K- 1M charges around $370-$5,000.
- Mega-influencers with more than 1M start at $1,210, with higher rates unlisted.
- Frames numbering between 1 and 3 account for about 60% of brand engagement.
- Small brands with less than 10k followers will usually encounter that more than 3x followers view their posts than their stories.
General Instagram Stories Statistics
- Instagram stories are utilized by 500 million users daily (Instagram internal data, January 2019)
- One-third (1/3) of the most viewed Instagram Stories originate from businesses
- 50% of global businesses on Instagram have created at least one story in a typical month
- 96% of surveyed US marketers intend to continue utilizing Stories ads in the upcoming 6 months
- The average Instagram Story is viewed by fewer than 1 person, compared with 11 users per Reel and 7.8 users per carousel.
- 71.9% of brand content on Instagram is found in Stories.
- Between 15% and 25% of individuals click on links within branded stories.
- Over half a million individuals engage with Instagram Stories each day.
- 70% of Instagram users view stories daily.
- Instagram Stories Statistics indicate that approximately 86.6% of Instagram users share their posts and stories.
- 36% of businesses leverage Instagram Stories to market their products.
Moreover
- Almost 49% of Gen Z users utilize stories to discover products and services.
- According to studies, 70% of viewers see Instagram stories with their devices’ sound.
- Brands with substantial audiences generally achieve a 12% reach rate for posts and 2% for stories.
- Approximately 98% of fashion brands are active on Instagram.
- Up to 49% of Instagram influencers’ followers may be inauthentic.
- Instagram’s advertising revenue increased from $3.4 billion in 2017 to $61.1 billion in 2023.
- In 2023, Instagram Stories ads produced $20.03 billion, reflecting consistent growth since 2019.
- The brand value of Instagram is anticipated to reach $70.4 billion in 2024.
- In December 2023, Instagram.com recorded 6.9 billion visits globally.
- 70% of Instagram users engage with Stories daily.
- 6% of Instagram users regularly post Stories.
- Among Instagram users, about 49% use Instagram Stories to discover new products and services.
- 36% of businesses use Instagram Stories to advertise their products and services or other offers.
(Source: socialmediacurve, wp-content)
Instagram Stories Usage
- The majority of individuals utilize Instagram Stories daily, whether for personal expression or for promoting their businesses.
- Approximately 27% of brands opt to use a single frame for their Stories, while 20% employ seven or more frames.
- It is advisable to include at least two frames in a Story to maintain audience engagement, as an excessive number of frames may lead to viewer disinterest.
- Instagram Stories are favoured by millennials more than those on Snapchat and Facebook.
- The predominant demographic of Story viewers falls within the age range of 25 to 34, with men accounting for 16.4% and women for 14.8%.
- Stories serve as a way for businesses to capture viewers’ attention and generate interest in their offerings.
- Instagram allows Stories to last a full minute, giving users more time to engage their audience.
- The inclusion of audio in Stories is crucial, as it enhances user engagement, particularly through music or trending sounds.
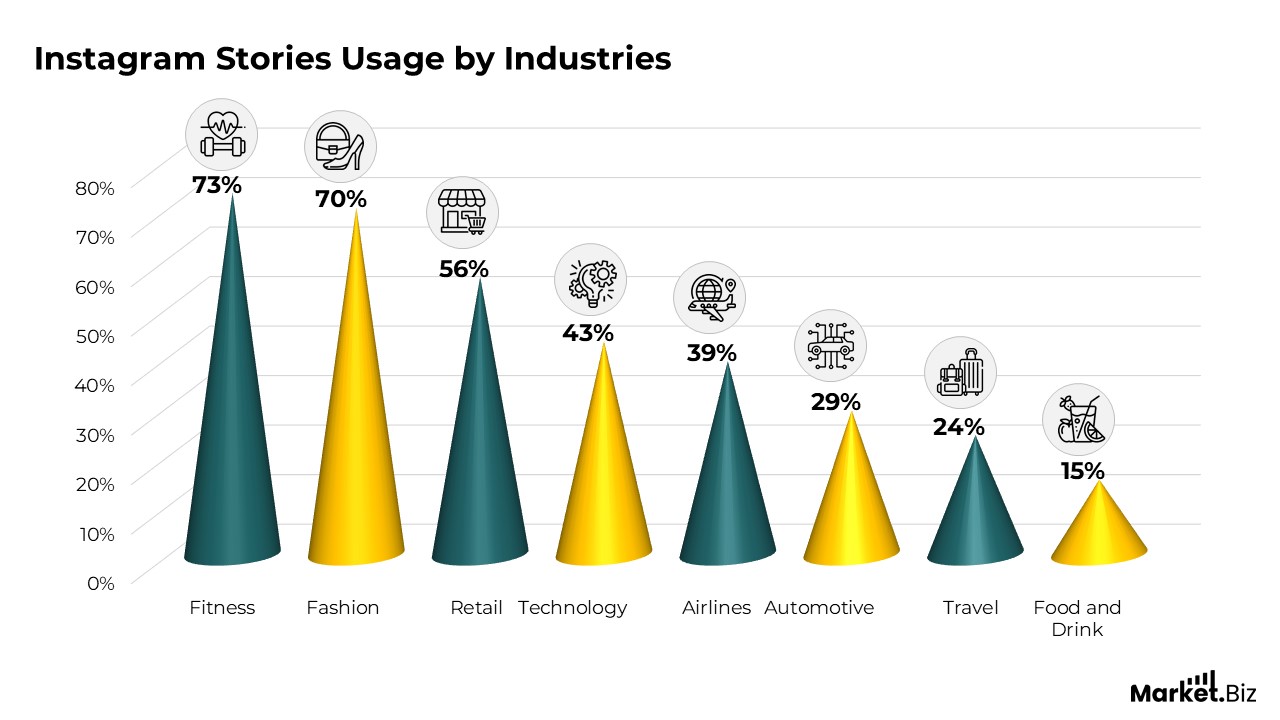
- Instagram stands as the leading platform for fashion brands to creatively display their products.
- GAP’s implementation of Instagram Stories for their collection resulted in a 73% increase in click-through rates compared to other advertisements.
- A majority of marketers intend to augment their budget for Instagram videos due to their effectiveness in reaching target audiences.
- Brands with fewer than 10,000 followers achieve the highest engagement on Instagram Stories, with a 5.4% reach rate.
- Instagram has introduced new tools to facilitate stronger connections between brands and their audiences, as well as foster collaborations with preferred partners.
- Instagram Stories featuring sports content effectively engage viewers, with most individuals watching the entire Story.
- 50% of Gen Z users utilise Instagram Stories to discover new products, indicating that it is a vital tool for businesses aiming to connect with younger demographics.
(Source: coolest-gadgets, wp-content)
Instagram Stories Ad Revenue
- Revenue from Instagram Stories ads has grown consistently from 2019 to 2023.
- In 2019, advertising revenue totalled $4.32 billion, with projections indicating it will reach $20.03 billion by the end of 2023.
- Statistics on Instagram Stories show that advertising revenue has increased steadily from 2019 to the anticipated figures for 2023.
- In 2019, Instagram Stories’ advertising revenue was USD 4.32 billion, expected to reach USD 20.03 billion by the end of 2023.
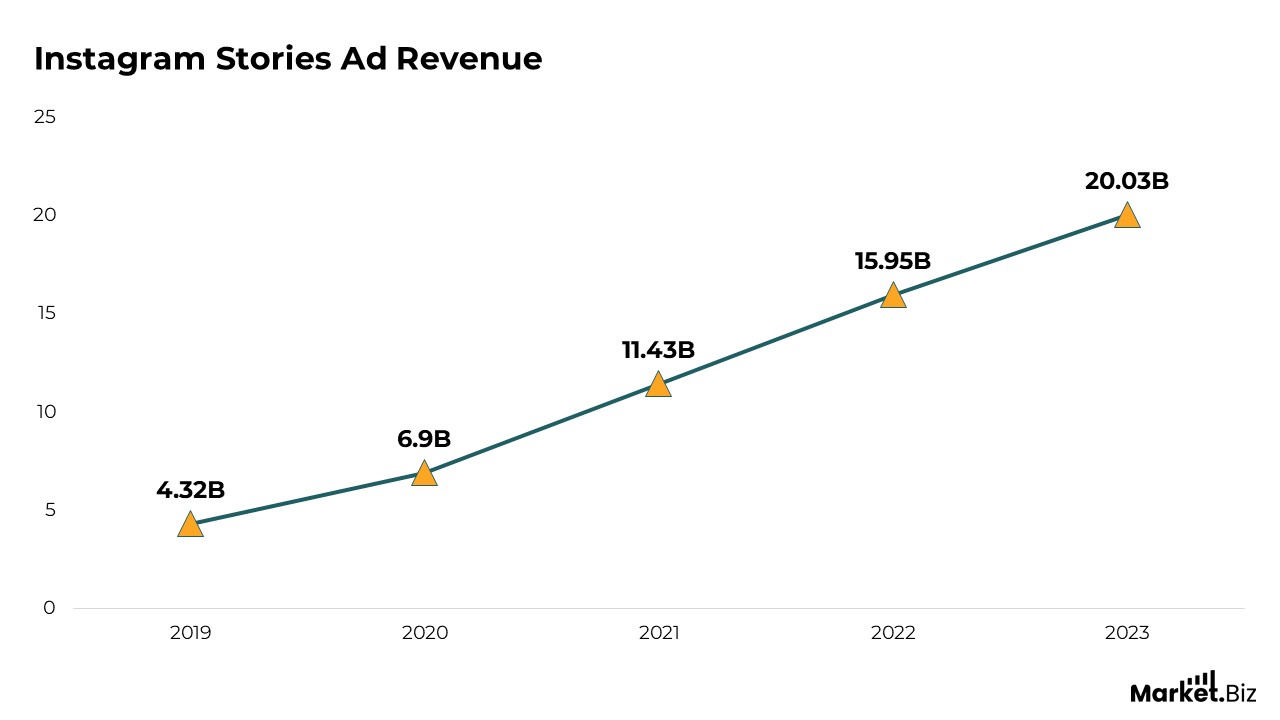
(Source: electroiq, wp-content)
Instagram Stories Demographics
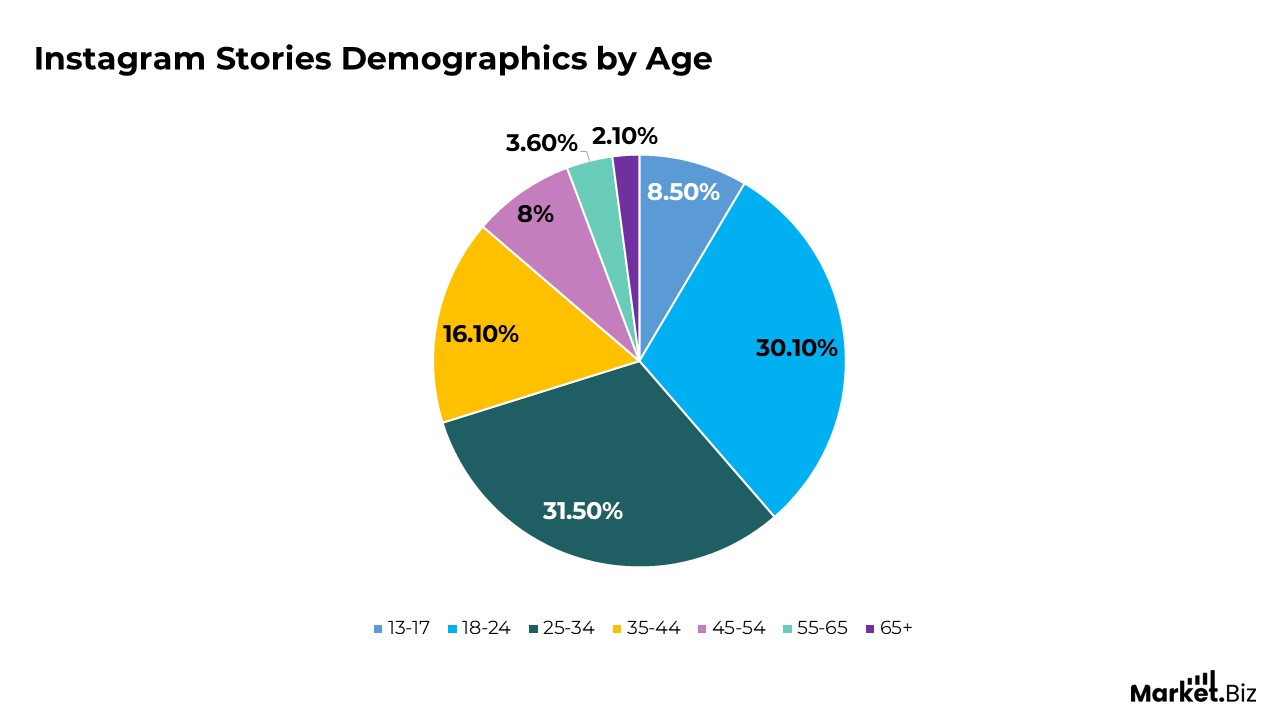
- The predominant demographic of Instagram users is 25- to 34-year-olds, accounting for 31.5% of the overall user base.
- The next-largest demographic comprises individuals aged 18-24, representing 30.1% of total users.
- Following this, the percentages decrease: 8.5% of users aged 13-17, 8% aged 45-54, and 5.7% aged 55 or older.
- According to Instagram Stories Statistics, nearly 15% of teenagers report that Instagram is their most frequently used application. Nevertheless, there are preferable alternatives for the majority of adolescents. Snapchat is the leading application for 35% of them, closely trailed by YouTube at 32%.
- On Instagram, 56.9% of users are women, while men account for 43.1%. This disparity is evident across all age categories. For instance, within the 25-34 age bracket, there are 10% more women than men, and in the 45-54 age group, 25% more women utilize Instagram compared to men.
(Source: coolest-gadgets, wp-content)
Price Per Instagram Post
- According to Instagram Stories Statistics, Instagram influencers’ per-post rate depends significantly on how many followers they have; the more followers, the more they charge.
- Nano influencers with 1k-10k charge around $25-$150.
- Micro-influencers with 10K- 50K followers charge around $45-$350.
- Mid-influencers with 50K- 500K followers charge around $160-$1,800.
- Macro-influencers with 500K- 1M charges around $370-$5,000.
- Mega-influencers with more than 1M start at $1,210, with higher rates unlisted.
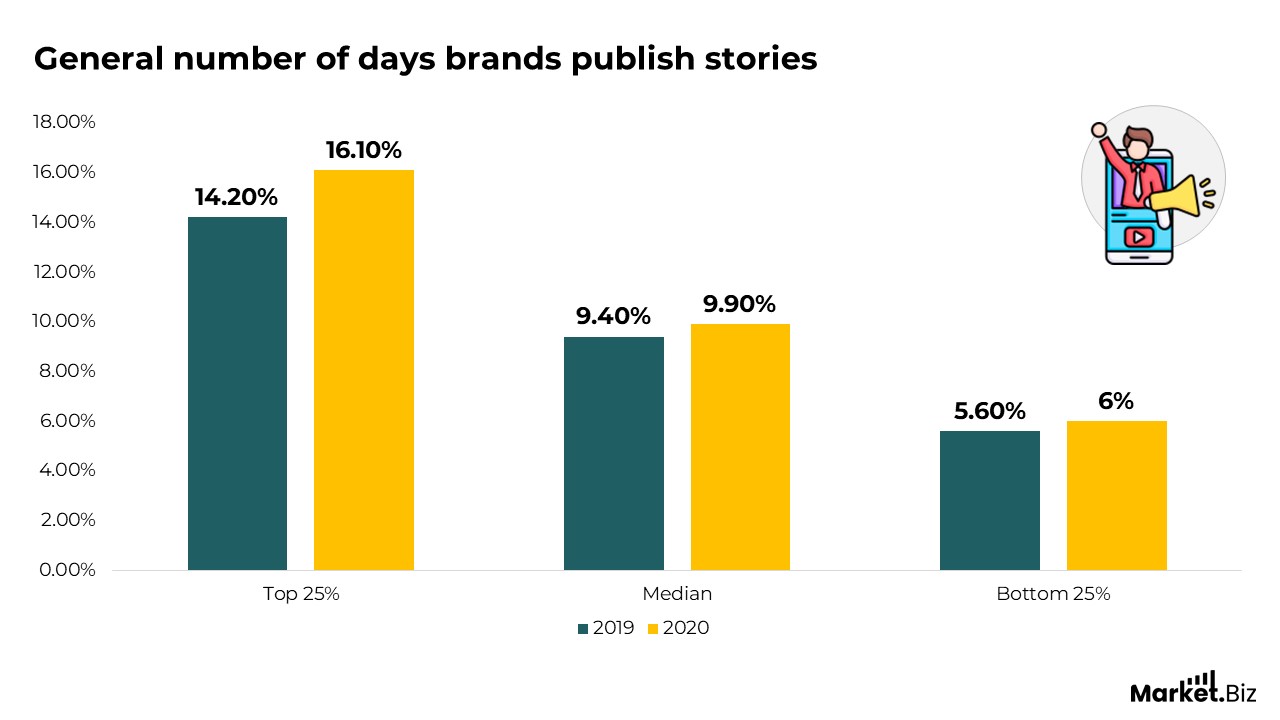
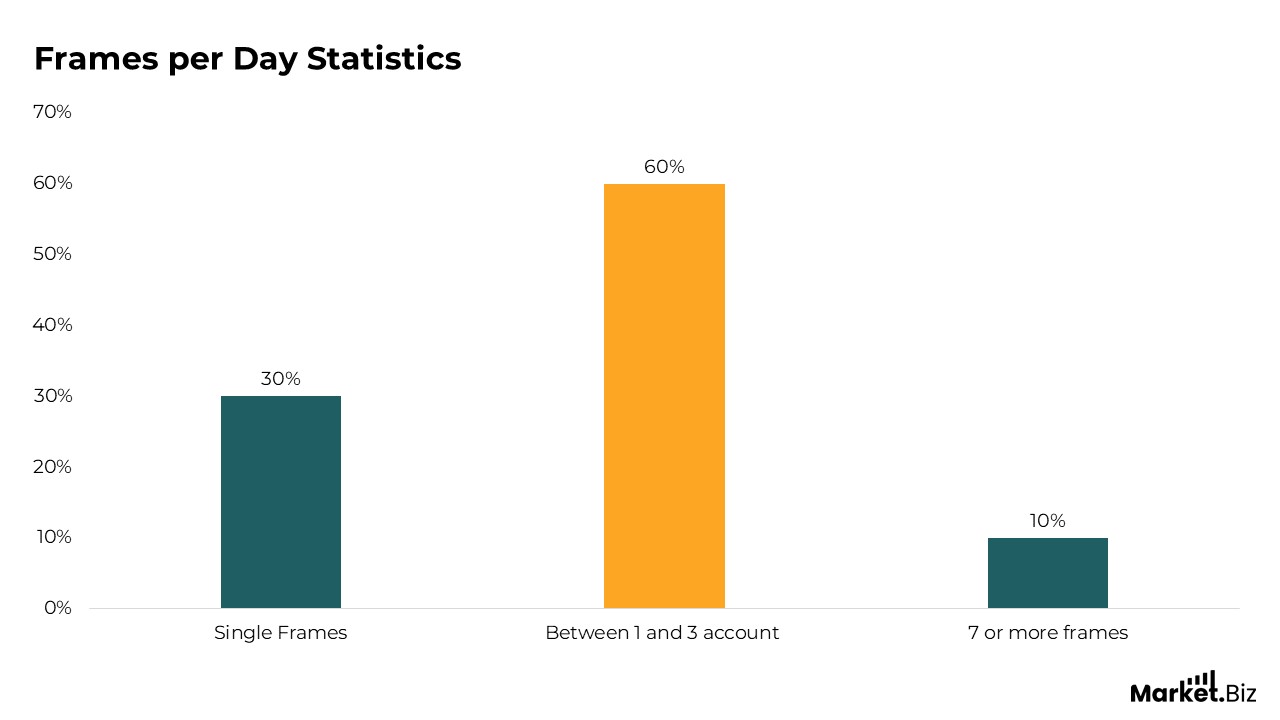
Frames Per Day Statistics
- Identifying the appropriate number of frames to publish daily for your brand is equally important as determining how many Stories to share within a designated timeframe.
- Shorter Stories tend to be more widespread than their longer counterparts.
- Approximately 35% of Stories consist of a single frame.
- Frames numbering between 1 and 3 account for about 60% of brand engagement.
- According to Instagram Stories Statistics, only 10% of Stories contain 7 or more frames, down from the previous year.
- It is not necessary to post Stories continuously throughout the day to maintain follower engagement. Discovering the best number of frames for your brand and understanding what captivates your followers can enhance your posting strategy.
Instagram Stories vs Snapchat Stories
- Instagram Stories Statistics indicate that nearly 17% of individuals prefer viewing stories on Instagram, compared to 13% who favour Snapchat. Nevertheless, both platforms hold a relatively small market share.
- Although Snapchat was the pioneer in introducing stories, Facebook has emerged as the leading platform for them, with 70% of respondents preferring to view them there. This information is derived from a survey conducted with 275 individuals in the United States.
- Snapchat boasts approximately 46 million active users in the U.S., which is significantly fewer than Instagram’s 121 million.
- Approximately 70% of Instagram users engage with both watching and posting stories, translating to around 85 million U.S. users who interact with Instagram stories.
- Instagram Stories Statistics reveal that nearly 59% of Instagram users are aged 18-29, while 77% of Snapchat users are in the 18-24 age group.
- While both platforms appeal to younger audiences, Snapchat is predominantly utilized by Generation Z, whereas Instagram enjoys greater popularity among millennials.
- Snapchat places a stronger emphasis on direct messaging and personal interactions, whereas Instagram is primarily utilized for sharing content with a broader public audience.
Instagram Reach Rate
Post Reach Rate
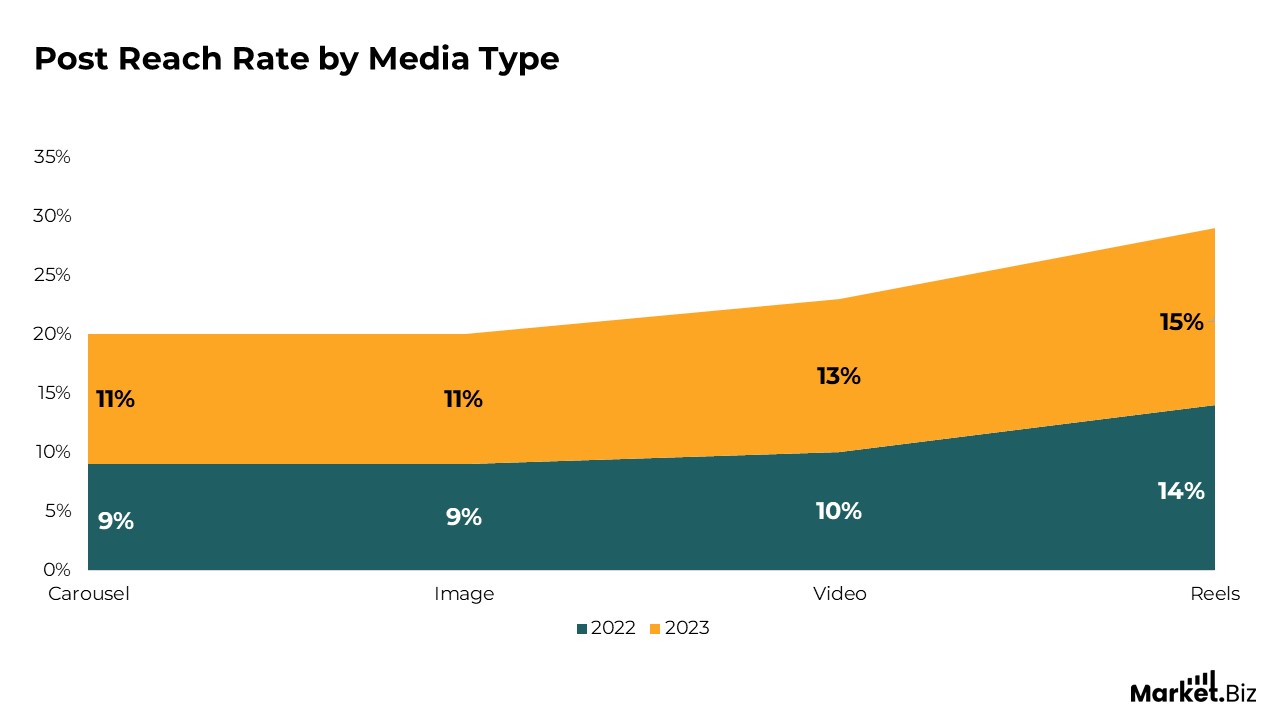
- The post reach rate, which reflects the percentage of followers who have viewed your post, has either remained consistent or shown a slight enhancement this year, akin to the Story reach rate.
- The post-reach rate has been declining over the past few years, so it is a positive sign to observe it either rising or maintaining its level for the brands we evaluated this year.
- This metric helps brands understand the proportion of their followers who engage with posts, depending on the type of content, such as carousels, images, videos, or Reels.
- Images saw the largest increase in reach, rising 27% from the previous year. Reels, despite showing the least growth in reach, still exhibited some improvement.

(Source: coolest-gadgets, wp-content)
Post Reach Rate by Media Type
- Stories & posts both engage and attract different audiences. It’s easy for those who often use Instagram, let’s compare both:
- Small brands with fewer than 10k followers usually find that more than 3x as many followers view their posts as view their stories.
- As for large brands with 50K-100K followers, they usually find that more than 5x as many followers view their posts as their stories.
(Source: coolest-gadgets, wp-content)
Post & Stories Reach Rate
- There are different ways a content creator can use to engage ones followers using posts and stories; therefore, both of them should be used separately in a marketing strategy.
- Where posts help get fast views, Stories catch viewers’ attention, and if the content has value to viewers, it can keep them engaged for longer.

(Source: coolest-gadgets, wp-content
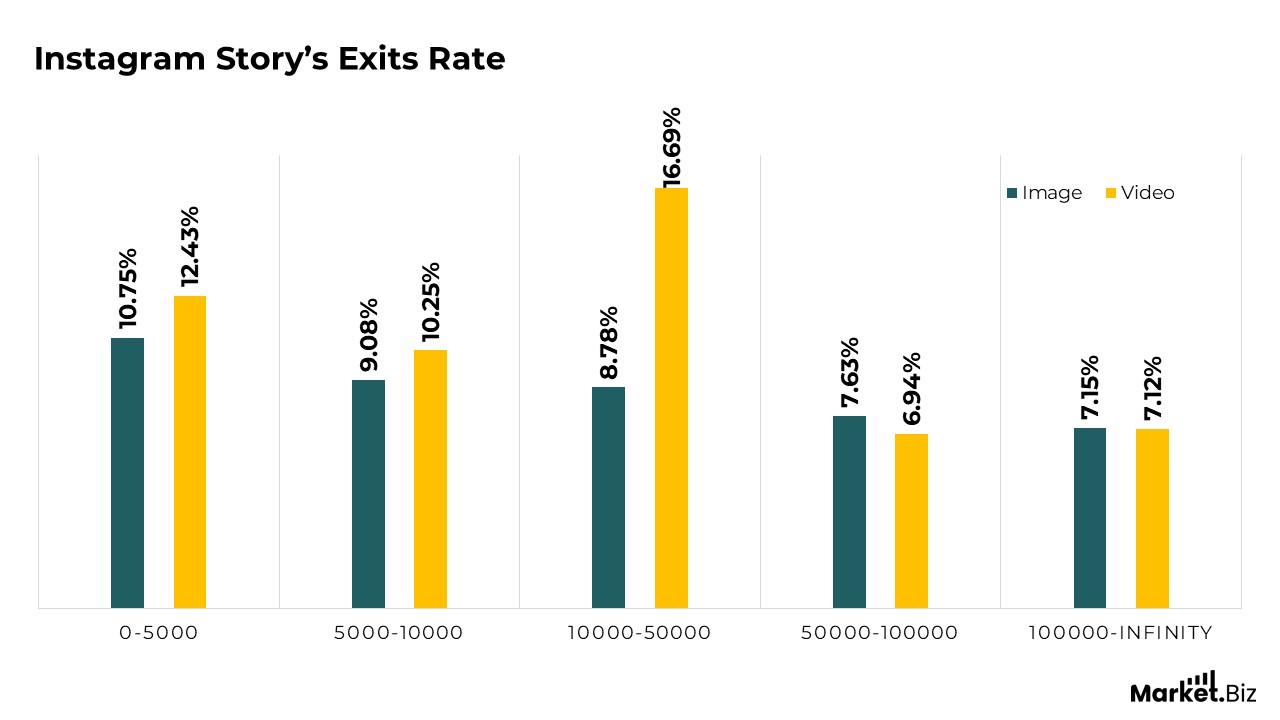
Instagram Story’s Exit Rate
- When watching videos on Instagram Stories, most users are likely to leave sooner.
- Mid-sized accounts with 10,000 to 50,000 followers often need help keeping their audiences engaged, especially with video content.
- Smaller accounts usually face issues with financial problems and have little or less money to spend on production; as a result, they produce low-quality or less professional videos, which eventually leads to a high exit rate.
- On the opposite side, larger accounts with more than 100,000 followers perform better than others at holding their targeted audience’s attention. With a clear content strategy and more resources to hire an experienced social media manager, they outperform their competitors.
(Source: coolest-gadgets, wp-content)
Conclusion
In conclusion, Instagram stories have offered brands and content creators a fantastic solution to engage their audiences live. Given that over 500 million people use stories every day, stories are part of your content strategy.
Brands using stories are enjoying higher engagement, more impressions, and stronger connections with their customers. Brands make it easier for users to engage with their stories because stories are quick, visual content.
Interest builds quickly and encourages further engagement. Video content and mobile usage will continue to increase, so Instagram Stories will remain an important part of the social media marketing recipe for success. Brands must continue to utilize authentic, compelling, and engaging stories to stand out against competition and connect to the right target audience.
FAQs
Instagram stories reach 500 million daily active users, making it one of the most popular features on the app. Additionally, 7 out of 10 people on Instagram check stories every day, and almost 9 out of 100 users post their own stories daily.
On average, brand stories enjoy an 88.2% completion rate, meaning most viewers watch through a brand’s story series before it ends.
On your profile page, click on the hamburger menu (three horizontal lines) located in the top right corner and choose “Insights” from the dropdown menu. Proceed to Stories. Within the Insights section, scroll down to the “Content You Shared” area and select “Stories.” Review analytics for active stories.
One in three individuals has indicated that they develop a greater interest in brands and products after viewing stories about those brands that showcase those products. Instagram Stories improve your reach and engagement and, in certain cases, affect purchasing decisions.