
Introduction
Office Space Utilization Statistics: Office space utilization has become a critical focus for businesses aiming to optimize their real estate investments and improve operational efficiency. Global office space occupancy rates have decreased by approximately 30-40% in recent years, largely due to the rise of remote and hybrid work models.
With 70% of companies now offering flexible work arrangements, the demand for traditional office layouts has shifted, leading to an increased emphasis on agile workspaces. Key metrics such as desk occupancy (averaging 60-70%) and space per employee (ranging from 100-150 square feet) are now essential for redesigning office environments. As businesses adjust to these changes, understanding these statistics is crucial for reducing costs and boosting productivity.
Editor’s Choice
- Office space utilization has decreased by 30-40% globally due to the rise of hybrid and remote work models.
- 72% of companies have adopted hybrid work models, reducing office space demand by 20%.
- Flexible office space utilization grew 35% from 2019 to 2023, with businesses opting for shorter leases.
- Hot-desking adoption rose to 45%, optimizing space efficiency in office layouts.
- Office space per employee dropped to 125-150 sq. ft. in 2022 from 250 sq. ft. in 2015.
- Co-working spaces grew by 12% annually, with a projected market size of $14 billion by 2027.
- 68% of companies adopted sustainable practices, focusing on energy efficiency in office spaces.
- Global office vacancy rates increased to 18% in 2023 from 14% in 2019.
- 60% of employees prefer working from home 2-3 days a week, contributing to the decline in office space demand.
- 45% of companies use technology like occupancy sensors to optimize office space usage.
- 41% of businesses reduced office space for flexible or remote work in 2023.
- Suburban office spaces saw 20% higher demand post-pandemic compared to urban centres.
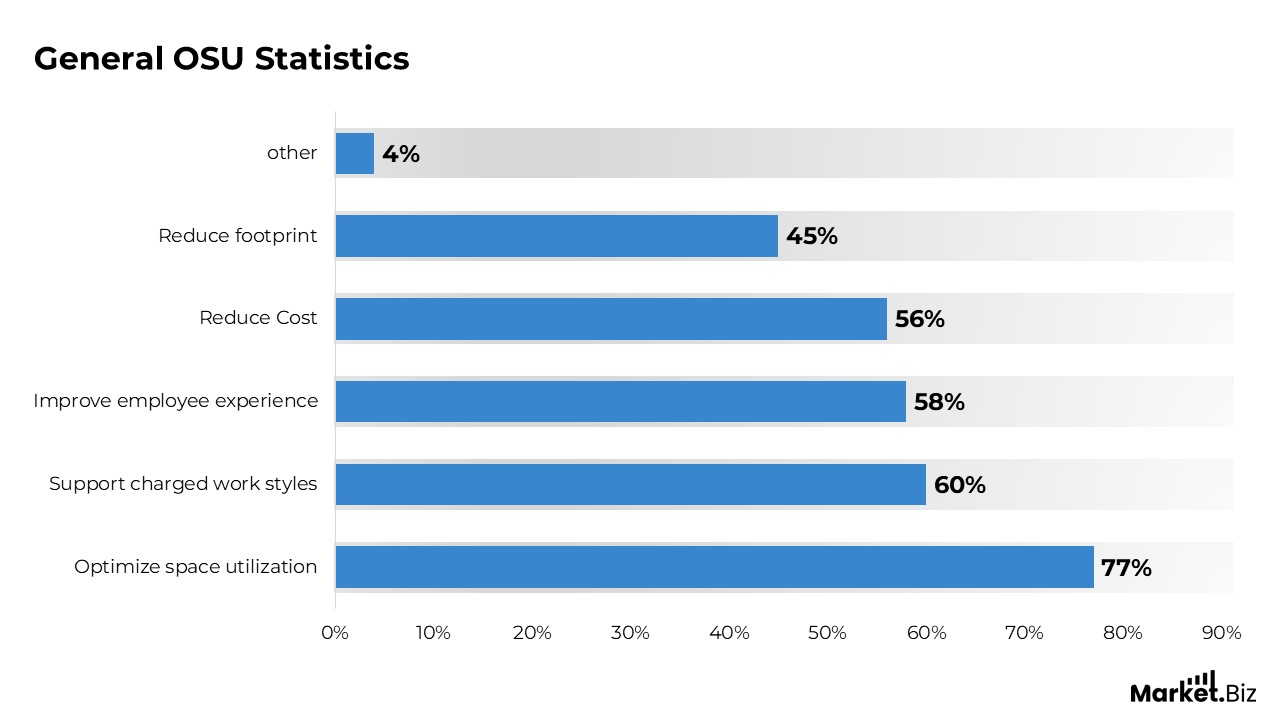
General OSU Statistics
- Office space utilization in major cities worldwide averages 40-50% due to hybrid and remote working models.
- 72% of companies globally report having a hybrid work model, reducing the demand for traditional office space by approximately 20%.
- Flexible office space utilization has increased by 35% from 2019 to 2023 as businesses opt for shorter leases and on-demand space.
- Hot-desking has become more common, with 45% of companies adopting this system, up from 30% in 2019, to maximize space efficiency.
- Office space per employee dropped to 125-150 sq. ft. in 2022 from 250 sq. ft. in 2015, reflecting more shared and collaborative spaces.
- Co-working spaces grew by 12% annually over the past five years, with an expected market size of $14 billion by 2027.
- 68% of businesses report adopting sustainable practices in office space utilization, focusing on energy efficiency and reduced environmental footprints.
- Global office vacancy rates reached 18% in 2023, up from 14% in 2019, driven by shifts in work patterns.
- 60% of employees prefer working from home 2-3 days a week, contributing to a decline in office space demand.
- 45% of companies now integrate technology such as occupancy sensors and smart building systems to optimize space usage.
- 41% of businesses reported reducing office space in favour of flexible or remote work in 2023.
- Suburban office spaces saw a 20% higher demand than urban centres post-pandemic, with more employees favouring proximity to home offices.
- 50% of companies are reassessing their office space needs to prioritize flexibility, with many downsizing or adopting hybrid solutions.
- Collaboration zones within offices grew by 30% in 2023, as companies focus on creating spaces for teamwork rather than individual desks.
- Companies have reduced real estate expenses by 30% by shifting to remote and hybrid work models, with the potential for further reductions in 2024.
(Source: Keymedia)
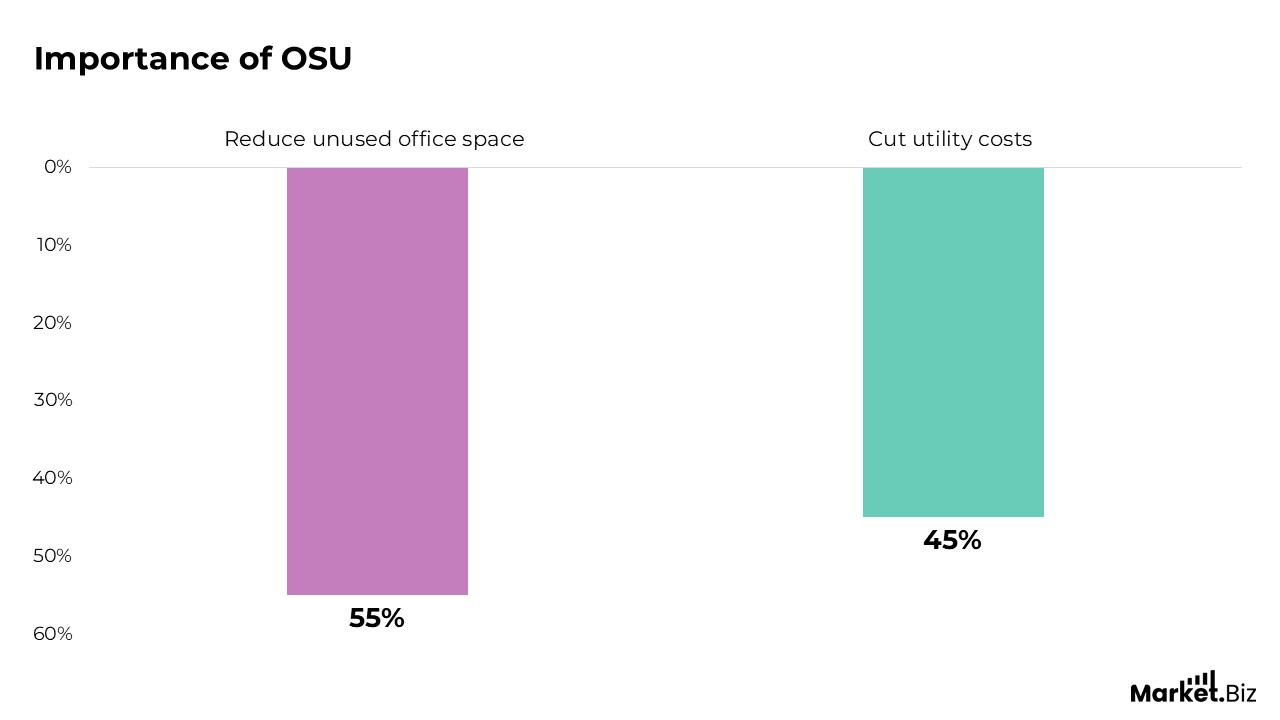
Importance of OSU
- Office space utilization statistics help companies optimize real estate, reducing costs and improving space allocation.
- Accurate data guides decisions on downsizing or expanding office footprints, aligning with work trends.
- Analysing space usage can reduce unused office space by 55%, leading to significant savings.
- Utilization stats enable businesses to design layouts that enhance collaboration and productivity.
- Data-driven space management can cut utility costs by up to 45%.
- Space utilization stats are key in real estate negotiations, offering leverage for lease renegotiations.
- Tracking office occupancy helps businesses plan for future workspace needs and avoid inefficiency.
- Utilization insights are essential for adapting to hybrid work models and reducing real estate expenses.
- Understanding space usage boosts employee satisfaction by providing environments that meet their needs.
- Office space data supports sustainability by reducing the environmental impact of underused buildings.
- Data on space efficiency enables flexible options like co-working, hot-desking, and multi-use areas.
- Accurate utilization stats help companies benchmark against industry standards for operational efficiency.
Key Metrics for Measuring OS
Space Efficiency Metrics
- Measures the percentage of available office space that is actively used, with an ideal target of 75-85% for balanced efficiency.
- Tracks the square footage allocated per employee; currently, it averages around 125-150 sq. ft. per worker, down from 250 sq. ft. in 2015.
- Evaluates the frequency of desk use, with hot-desking adoption increasing by 45% in recent years to optimize space.
- Measures how often meeting rooms are booked, with companies aiming for 60-70% usage rates to avoid underutilization.
- Analyses the usage of communal spaces like lounges and kitchens, with successful offices seeing 50-70% of employees using these areas daily.
- Tracks the number of employees per square foot of office space, often targeting 100-150 sq. ft. per person to balance comfort and productivity.
- Measures the use of flexible workspaces (e.g., co-working spaces or shared desks), growing by 12% annually in recent years.
- Identifies office areas with low activity, helping companies reduce underused space, potentially cutting overhead costs by up to 20%.
Employee Engagement Metrics
- Surveys employees to understand their satisfaction with available spaces, with a target score of 80% or higher for positive responses.
- Measures how often collaborative spaces are used, aiming for 60%+ utilization for high team interaction and creativity.
- Tracks the adoption of flexible seating and remote work options, with 60% of employees preferring hybrid work models.
- Analyses the link between space utilization and productivity, with studies showing that optimized environments increase productivity by 20-25%.
- Assesses if allocated office space meets employee needs, with companies seeking a match between space demand and availability.
- Measures how often employees change locations within the office, with modern offices seeing mobility rates of 30-40%.
- Tracks use of wellness spaces, with a growing trend of 40% of companies incorporating gym or relaxation areas into office designs.
- Monitors employee feedback on remote work options, which influences office space planning and utilization strategies.
Cost Efficiency and Sustainability Metrics
- Measures the cost of office space per employee, with companies targeting a reduction of up to 30% by shifting to hybrid models.
- Tracks the energy consumption per square foot of office space, with efficient buildings seeing savings of up to 20% annually in energy costs.
- Measures the impact of flexible lease agreements on cost savings, with 50% of businesses opting for shorter leases to reduce long-term risk.
- Evaluates return on investment for space planning changes, with successful reconfigurations leading to a 20% ROI.
- Tracks energy use, waste, and resource consumption per office space, with companies aiming for reductions of 25% in their office’s carbon footprint.
- Assesses the correlation between space utilization rates and real estate costs, aiming for higher occupancy rates to justify rent expenses.
- Measures how much it costs to maintain each square foot of office space, with efficient spaces reducing maintenance costs by up to 15%.
- Tracks the reduction in waste generated by office space usage, with green office spaces aiming for a 30% reduction in overall waste output.
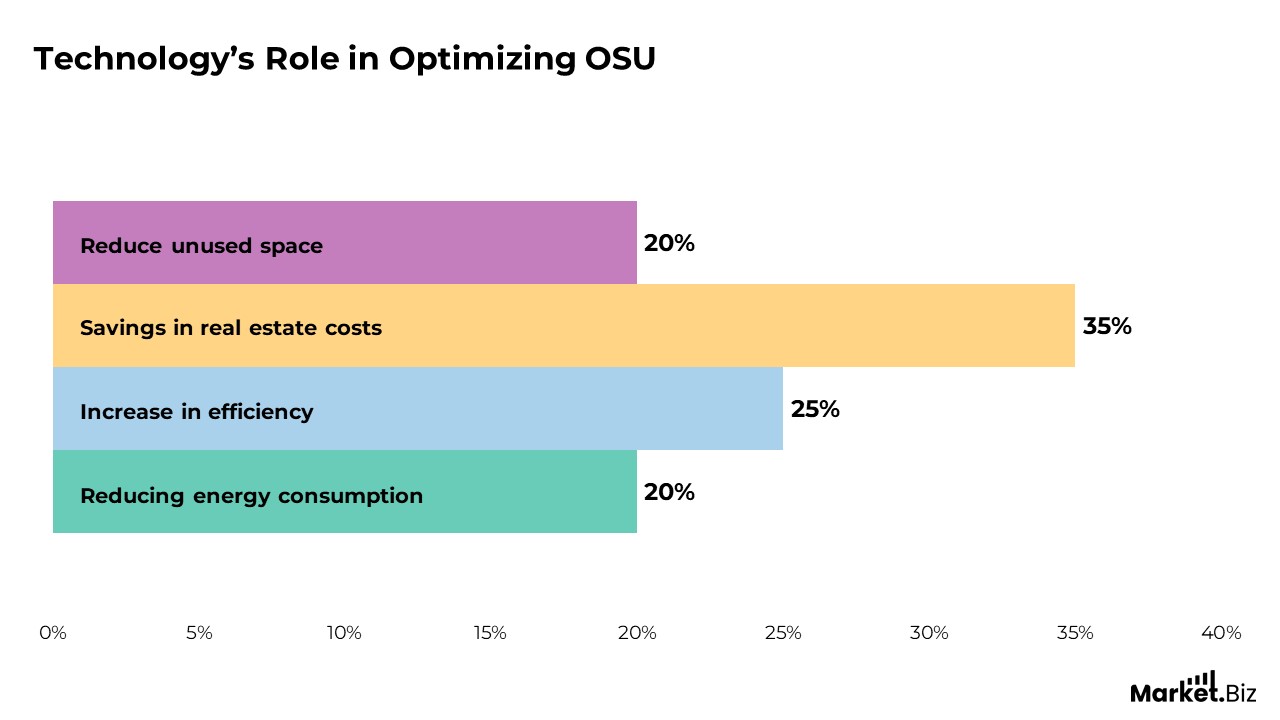
Technology’s Role in Optimizing OSU
- Technology such as occupancy sensors allows businesses to track real-time space usage, with studies showing that smart sensors can reduce unused space by 20%.
- Cloud-based space management tools help companies optimize seating and workspace layouts, leading to up to 25% savings in real estate costs.
- Implementing desk booking systems has seen a 35% increase in efficiency for companies adopting flexible work environments, ensuring desks are fully utilized.
- Energy-efficient smart buildings, integrated with IoT, can monitor lighting, temperature, and occupancy, reducing energy consumption by 20% and improving space usage.
- Tools that analyse employee behaviour and space usage data provide insights into patterns, helping companies redesign offices to suit their workforce needs and enhance productivity.
- The integration of virtual collaboration platforms reduces the need for physical office space, with over 60% of companies adopting hybrid models to decrease office space requirements by up to 30%.
- IoT-driven meeting rooms that automatically adjust lighting, temperature, and bookings can increase room utilization rates by 50% or more.
- AI-based algorithms can suggest optimal office layouts based on space utilization data, improving space efficiency by up to 20% while maintaining comfort and productivity.
- Mobile apps that allow employees to view available workspaces, book desks, and check occupancy help reduce space wastage, increasing overall office utilization by 15%.
- Real-time remote monitoring of office equipment and resources helps reduce unnecessary inventory and underused office amenities, leading to cost savings of up to 10%.
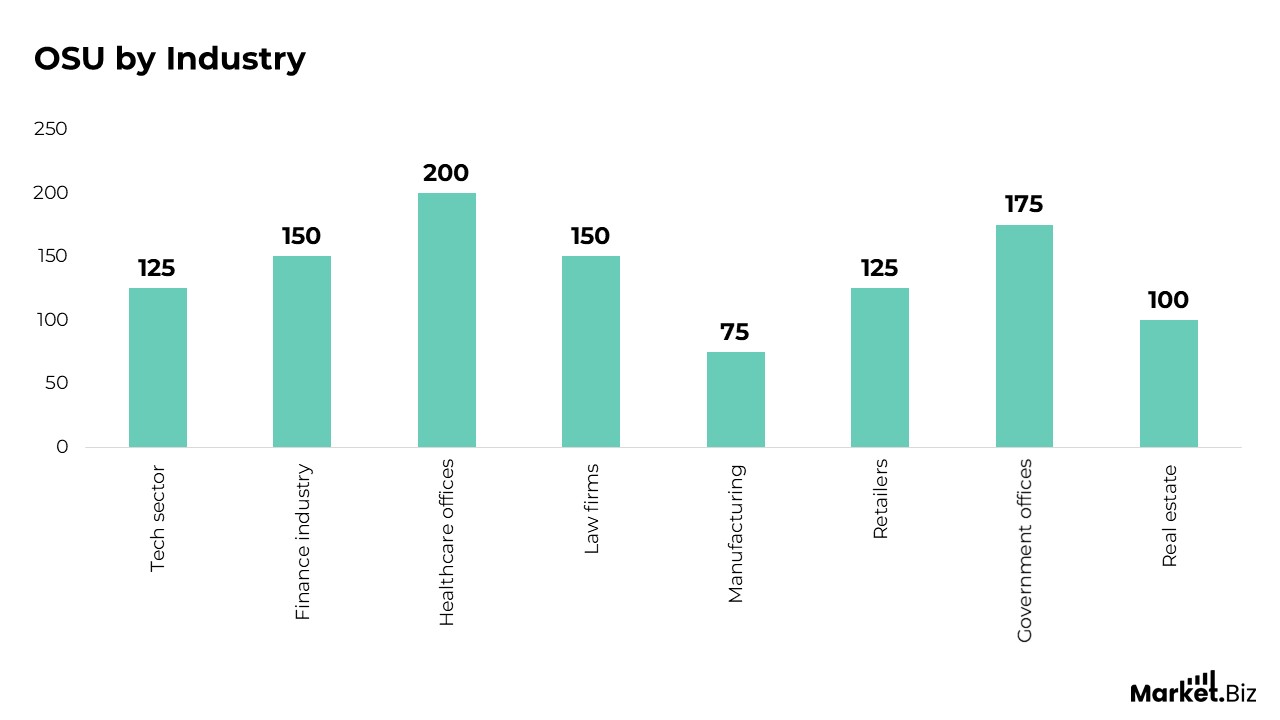
OSU by Industry
- The tech sector typically has high space utilization, with companies averaging 125 sq. ft. per employee, largely due to open office layouts and flexible workspaces.
- The finance industry maintains more traditional office layouts, with around 150 sq. ft. per employee, prioritizing private offices and meeting rooms for client interactions.
- Healthcare offices, including medical and dental practices, often have higher space demands, with around 200 sq. ft. per employee due to specialized equipment and patient areas.
- Law firms utilize office space more conservatively, averaging 150 sq. ft. per employee, with a strong emphasis on private offices for confidentiality and client meetings.
- Manufacturing offices tend to have a lower space utilization rate, averaging 75 sq. ft. per employee, as much of the workforce is based on production floors rather than offices.
- Retailers, especially those with large headquarters, average about 125 sq. ft. per employee, with many spaces being designed for customer-facing activities and inventory storage.
- Government offices often have high space per employee, averaging 175 sq. ft., due to rigid office setups and the need for compliance with specific regulations.
- Real estate firms tend to have flexible office environments, with space utilization averaging 100 sq. ft. per employee, supporting both collaborative spaces and individual workstations.
- Educational institutions utilize office space more efficiently, with universities and schools averaging around 100 sq. ft. per staff member, as much of the space is dedicated to classrooms and learning areas.
- Consulting firms often have a balanced approach to space, averaging 120-150 sq. ft. per employee, with an emphasis on collaboration zones and flexible working arrangements.
OSU Demographics
By Workforce
- Millennials and Gen Z prefer open, collaborative spaces, with 60% favouring flexible desks over traditional cubicles.
- Baby Boomers typically need 150-175 sq. ft. per person, valuing privacy and quiet environments.
- 45% of remote workers expect companies to reduce office space by up to 25% with hybrid work models.
- 40% of women prefer private offices for focused tasks, prioritizing quiet spaces.
- C-suite executives average 250-300 sq. ft. per person, requiring private offices and meeting areas.
- Generation X prefers a balance of collaborative and private spaces, with 125-150 sq. ft. per employee.
- 55% of tech employees prefer activity-based workspaces, with flexible, dynamic office setups.
- Part-time workers use 20% less office space compared to full-time employees.
- 50% of diverse companies invest in collaborative zones to support cross-functional teams.
Regional and Industry-Specific
- Urban offices average 125-150 sq. ft. per employee, while suburban offices have 175-200 sq. ft. due to lower rent.
- Tech companies average 100-125 sq. ft. per employee, favouring open-plan and hot-desking setups.
- Financial institutions allocate 150-175 sq. ft. per employee, focusing on privacy and client meetings.
- Healthcare offices need 200-250 sq. ft. per employee due to patient care areas and equipment.
- Retail office spaces average 125 sq. ft. per employee, focusing on customer-facing and operational tasks.
- Law firms allocate 150-175 sq. ft. per employee, emphasizing privacy for confidential work.
- Government offices average 175-200 sq. ft. per employee, due to regulations and security needs.
- University staff offices average 75-100 sq. ft. per employee, prioritizing classroom space.
- Consultants average 120-150 sq. ft. per employee, blending collaborative and private areas.
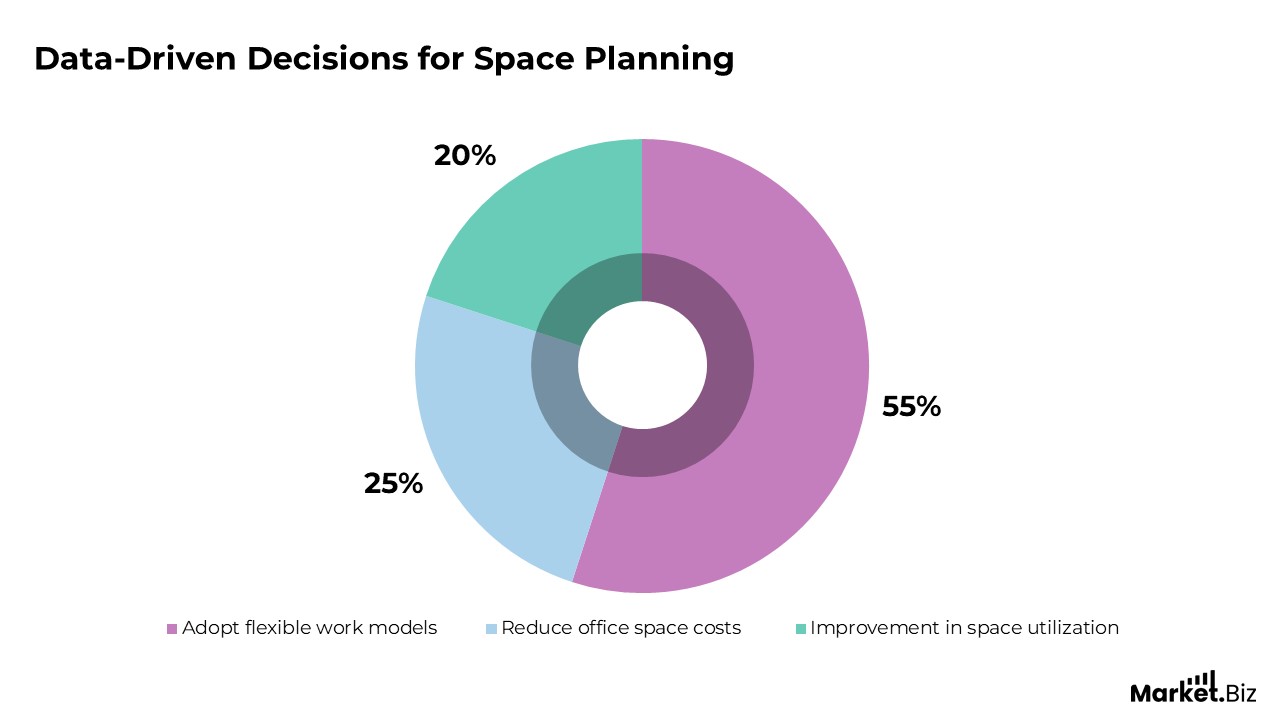
Data-Driven Decisions for Space Planning
- Using data analytics, companies can reduce office space costs by up to 25% by identifying underutilized areas and optimizing layouts for efficiency.
- Real-time occupancy data from sensors helps businesses achieve a 20% improvement in space utilization by adjusting the office layout based on actual usage patterns.
- Data-driven space planning enables companies to adopt flexible work models, with 50% of organizations shifting to hybrid workspaces after analysing employee preferences and space needs.
- Employee feedback data combined with space utilization metrics can increase productivity by 20%, as businesses align office designs with workers’ preferences and workflows.
- By tracking desk booking patterns, companies can optimize their hot-desking policies, improving desk utilization by up to 40%.
- Workplace analytics tools provide insights into peak times for meeting room usage, helping businesses reduce unused meeting space by up to 25%.
- Historical space usage data allows organizations to predict future space needs, reducing unnecessary office expansion by accurately forecasting employee headcount and space requirements.
- Integrating energy consumption data with space utilization metrics can lead to a 10% reduction in operational costs, ensuring efficient use of both space and resources.
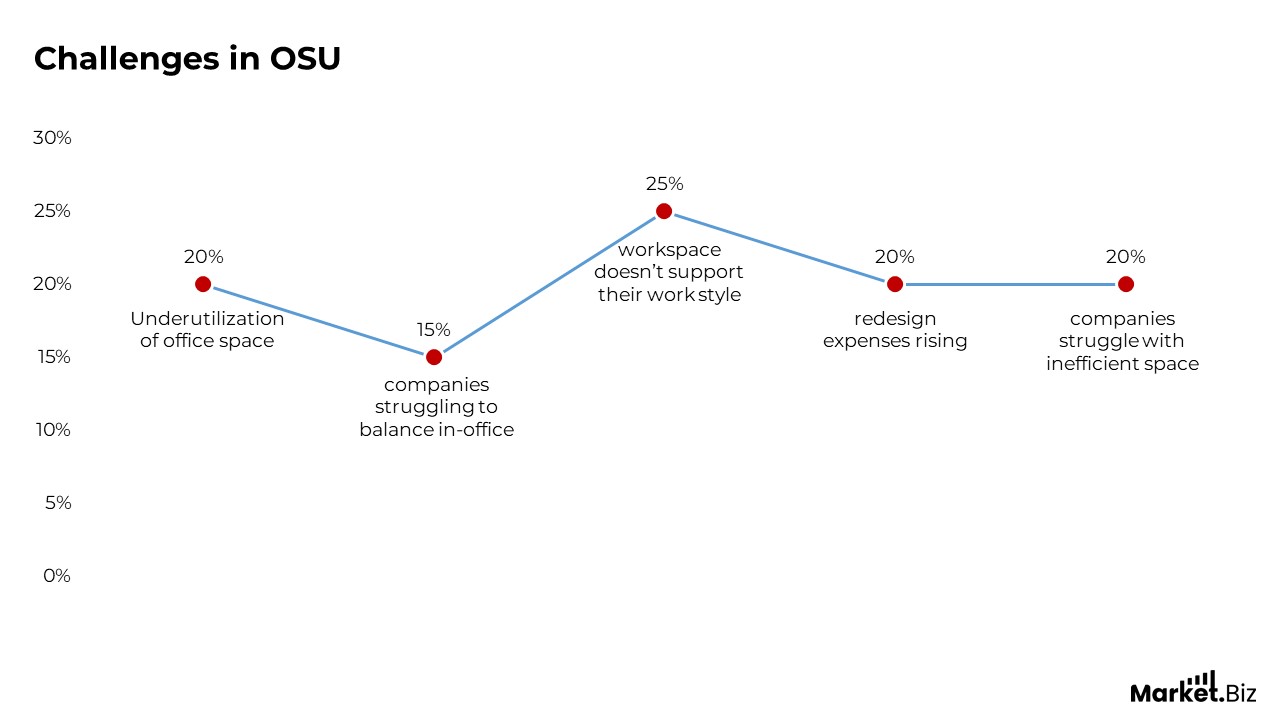
Challenges in OSU
- Underutilization of office space is a challenge, with 20% of spaces remaining unused, increasing real estate costs.
- Adapting to hybrid work models is tough, with 15% of companies struggling to balance in-office and remote work needs.
- Flexible office layouts are hard to maintain, as 25% of employees say their workspace doesn’t support their work style.
- Redesigning for activity-based workspaces (ABWs) can be costly, with redesign expenses rising by 20%.
- Without real-time data, 35% of companies struggle with inefficient space planning and resource allocation.
- Aligning space utilization with employee preferences is difficult, as 60% of workers feel office layouts don’t meet their needs.
- Adapting offices for diverse teams is complex, with 40% of companies finding their layouts unsuitable for collaboration.
- Managing fluctuating headcounts is challenging, leading to a 20% mismatch between space and employee needs.
- Half of businesses lack technology to optimize space, with 50% not using data-driven tools for management.
- Health and safety regulations reduce office capacity by up to 20%, affecting space planning and occupancy.
- Balancing comfort and productivity is tough, as companies try to meet comfort needs while optimizing space efficiency.
- Underutilized shared spaces like meeting rooms are a problem, with 40% being empty or used less than 50% of the time.
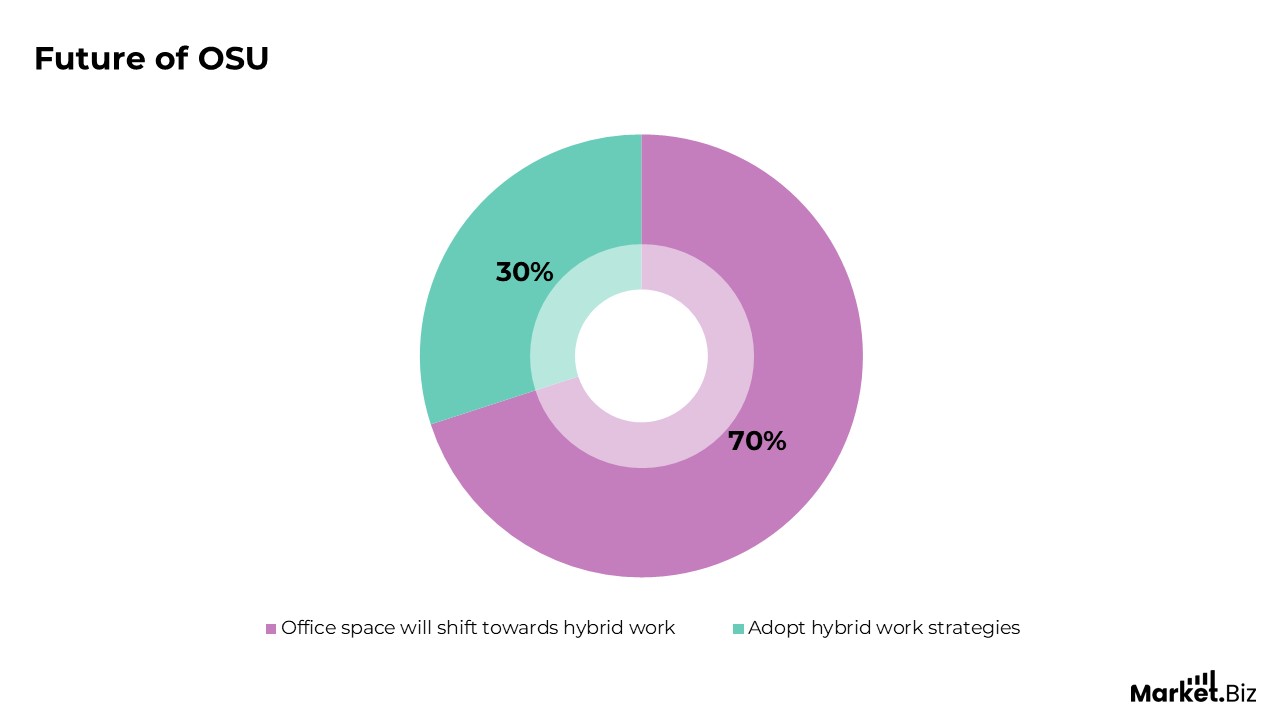
Future of OSU
- The future of office space will see a shift towards hybrid work models, with 70% of companies planning to adopt hybrid work strategies, reducing office space needs by up to 30%.
- Flexible and collaborative workspaces will dominate, as 60% of employees prefer open layouts that foster teamwork and innovation, leading to more adaptable office designs.
- Technology will play a key role, with 45% of companies using smart building systems to optimize space usage and reduce energy consumption by up to 20%.
- The demand for shared spaces, like co-working hubs, will rise, with the co-working market projected to grow by 21% annually through 2025.
- Offices will become experience-driven environments, with 50% of companies focusing on creating spaces that enhance employee wellbeing and productivity.
- Data-driven space planning will become more prevalent, with 55% of companies using occupancy sensors and analytics to monitor and optimize office space utilization.
- Sustainability will be a priority, with 40% of businesses aiming for net-zero carbon buildings, pushing the demand for energy-efficient office designs.
- As remote work continues, companies will reduce office footprints by up to 25%, leading to a greater emphasis on smaller, more efficient office layouts.
- Personalized workspaces will grow in importance, with 50% of employees seeking customizable office areas to suit their work preferences and productivity styles.
- The future will see an increased focus on wellness features, with 60% of companies planning to incorporate elements like basophilic design and natural lighting to improve employee health.
Conclusion
Office space utilization is undergoing a significant transformation, driven largely by the rise of hybrid and remote work models, which have led to a noticeable decline in global office occupancy rates. With a growing number of companies adopting hybrid work setups, the demand for traditional office layouts is shrinking, and flexible office spaces are on the rise.
As companies focus on cost-efficiency, sustainability, and employee preferences, space per employee has significantly decreased in recent years. The integration of technology, such as occupancy sensors and smart building systems, is optimizing space usage, with many businesses leveraging these tools. This shift towards more flexible, collaborative, and data-driven office environments is expected to continue as companies adapt to evolving work trends.
FAQs
Hybrid work models have led to a significant decline in office occupancy, with companies reducing office space by 30-40% due to remote work preferences. This shift is driving the demand for more flexible and collaborative workspaces.
Technology like occupancy sensors and smart systems helps businesses track real-time space usage, improving efficiency and reducing unused space. This data allows for better space allocation and cost savings.
Flexible workspaces offer agility, shorter leases, and collaborative environments, aligning with the shift towards hybrid work. They enable businesses to scale their office space needs as work patterns evolve.
Utilizing space data helps companies reduce costs, boost productivity, and better allocate resources based on employee needs. This leads to more effective real estate decisions and optimized work environments.
Sustainability drives companies to optimize space and use energy-efficient technologies, reducing their environmental impact. This also supports cost reductions by lowering energy consumption and promoting green building practices.
Employee preferences for flexible desks and collaborative spaces shape office layouts. Aligning designs with these needs boosts satisfaction and productivity, optimizing space usage.