
Introduction
FinTech industry statistics offer a data-driven view of how technology-enabled financial solutions are transforming the global financial services landscape. These statistics capture key metrics, including digital payment adoption, mobile banking usage, transaction volumes, funding activity, and customer engagement across FinTech platforms, highlighting the shift from traditional financial models to digital-first, user-centric services.
By analyzing these data points, businesses, investors, and policymakers gain insight into changing consumer behavior, regulatory trends, and the influence of innovations such as artificial intelligence, blockchain, open banking, and embedded finance, helping assess market growth, competitive dynamics, and future opportunities within the financial ecosystem.
Editor’s Choice
- The global FinTech ecosystem now includes nearly 30,000 startups, reflecting the sector’s rapid expansion across payments, lending, insurance, and digital banking.
- North America remains the leading region for FinTech activity, hosting close to 12,000 companies and accounting for the largest regional concentration worldwide.
- Industry revenues are estimated at approximately USD 201.91 billion, highlighting the growing commercial scale of FinTech solutions.
- Between 2017 and 2023, the FinTech industry’s revenue nearly doubled, indicating close to 100% growth over the 6 years.
- Investment activity remains heavily US-focused, with more than 36.75% of global FinTech funding deals taking place in the United States in 2022.
- Technology adoption is accelerating within financial institutions, as 4 in 10 financial service organizations believe blockchain will significantly reshape service delivery models.
- Visa stands out as the most valuable FinTech-related company in the US, with a market capitalization of around USD 662.6 billion.
Moreover
- On a global level, about 64% of consumers have adopted at least one FinTech service, demonstrating mainstream acceptance.
- FinTech usage in the US remains strong, with roughly 46% of consumers actively using FinTech platforms.
- Payments dominate FinTech adoption, as over 75% of global users rely on digital payment or money transfer services.
- The sector continues to support employment growth, with 3 out of 4 FinTech companies actively hiring for technology- and finance-related roles.
- Small and medium-sized enterprises are increasingly embracing digital finance, with more than 25% of SMEs worldwide adopting FinTech services.
- Digital channels now dominate transaction activity, with nearly two-thirds of all financial transactions completed through online payment methods.
- Capital requirements are increasing for growth-stage startups, with the median revenue benchmark for Series A funding rising to approximately USD 4 million, nearly 4 times higher than in 2021.
- Financial discipline is improving across the sector, as FinTech firms reported a median year-over-year reduction in cash burn of about 12% in Q2 2025.
- Consolidation activity is rising, with around 49% of FinTech mergers and acquisitions involving buyers backed by venture capital firms.
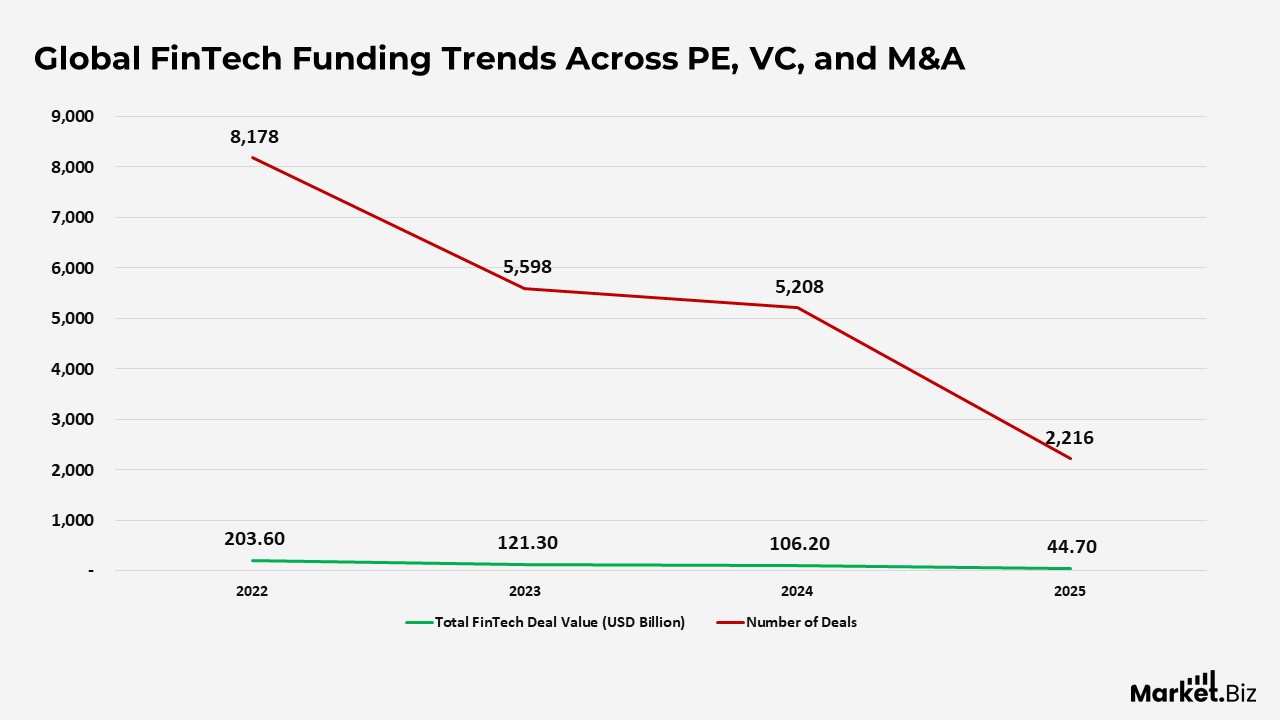
Global FinTech Funding Trends Across PE, VC, and M&A
- Global FinTech funding peaked in 2022, with total deal value reaching approximately USD 203.6 billion, supported by a high volume of about 8,178 transactions.
- In 2023, funding activity declined sharply, with total investment falling to around USD 121.3 billion and deal count dropping to roughly 5,598, reflecting tighter capital markets.
- The downward trend continued in 2024, with deal value decreasing further to nearly USD 106.2 billion and the number of transactions reducing to about 5,208.
- By 2025 (as of mid-year), FinTech funding activity showed a significant slowdown, with deal value at approximately USD 44.7 billion and deal count falling to around 2,216.
- Overall, the data highlights a sustained contraction in both funding volumes and transaction counts since 2022, indicating a more cautious investment environment and greater emphasis on capital efficiency within the FinTech sector.
(Source: KPMG)
Global FinTech Venture Capital Investment Trends
- Venture capital investment in FinTech reached its highest level in 2022, with total funding of approximately USD 91.1 billion across around 7,106 deals.
- In 2023, VC funding activity declined notably, with total investment dropping to nearly USD 50.6 billion and deal volume falling to about 4,700 transactions.
- The slowdown continued into 2024, with venture funding falling further to around USD 45.7 billion, while deal count eased to approximately 4,294.
- By 2025, VC investment in FinTech had contracted sharply, totalling roughly USD 23.4 billion, and the number of deals decreased to about 1,786.
- Overall, the data reflect sustained cooling in venture capital activity in FinTech since 2022, signalling a shift toward more selective investments and a heightened focus on profitability and risk management.
(Source: KPMG)
Global FinTech Venture Capital Investment Trends
- Venture capital investment in FinTech reached its highest level in 2022, with total funding of approximately USD 91.1 billion across around 7,106 deals.
- In 2023, VC funding activity declined notably, with total investment dropping to nearly USD 50.6 billion and deal volume falling to about 4,700 transactions.
- The slowdown continued into 2024, with venture funding falling further to around USD 45.7 billion, while deal count eased to approximately 4,294.
- By 2025 (year to date), VC investment in FinTech had contracted sharply, totalling roughly USD 23.4 billion, and the number of deals decreased to about 1,786.
- Overall, the data reflect sustained cooling in venture capital activity in FinTech since 2022, signalling a shift toward more selective investments and a heightened focus on profitability and risk management.
(Source: KPMG)
Global FinTech Market Landscape and Adoption Trends
- The global FinTech ecosystem comprises nearly 29,955 active startups, highlighting the scale and diversity of innovation across financial technology segments.
- During the first three quarters of 2024, FinTech startups worldwide raised approximately USD 24.6 billion, a 24% year-over-year decline from the same period in 2023, reflecting a more cautious funding environment.
- The US insurtech segment continues to expand, with around 1,500 insurtech companies in operation as of 2024, including 25 unicorns valued at over USD 1 billion.
- Robinhood reported net revenues of about USD 471 million in 2023, underscoring the revenue potential of consumer-focused FinTech platforms.
- Consumer lending FinTech Sunbit has secured more than USD 770 million in total funding, signalling sustained investor interest in point-of-sale and credit-focused solutions.
(Source: DemandSage, KPMG, Insurance Business Magazine, Statista, Exploding Topics)
FinTech Adoption Rate Statistics
- Digital payments represent the largest user segment in FinTech, exceeding 3 billion users in 2024 and projected to reach around 4.45 billion by 2029, driven by mobile payments and the growth of online commerce.
- FinTech revenues are expanding at a much faster pace than traditional banking, with industry growth expected to be nearly 3 times higher over the 2022–2028 period.
- While conventional banks record annual revenue growth of roughly 6%, FinTech companies are projected to grow at close to 15% per year between 2023 and 2028.
- In the US, digital wallets have become a preferred payment method, with about 53% of consumers using them more frequently than cash or physical cards.
- Globally, the number of digital payment users is forecast to reach approximately 8.34 billion by 2030, indicating near universal adoption.
- Younger consumers are leading mobile wallet usage, with about 62% of Gen Z and 53% of millennials actively using mobile wallets, compared with only 21% among baby boomers.
(Source: Statista, McKinsey, GlobeNewswire)
FinTech Investment, AI Adoption, Blockchain Expansion, and Funding Trends
- Payment-focused companies dominated late 2024 investment activity, with half of the top 10 equity deals in Q4 2024 directed toward platforms supporting mobile payments, cross-border transactions, and B2B payment digitization.
- Banking-focused FinTech deals shifted toward maturity, as mid- and late-stage transactions accounted for 38% of total deal volume in 2024, up sharply from 21% in 2023.
- Average deal sizes continued to rise, with the median FinTech deal reaching USD 4 million in 2024, reflecting a 33% year-over-year increase and larger ticket sizes across regions.
- Payment services attracted the highest level of global FinTech funding in 2024, reinforcing payments as the most capital-intensive and competitive segment.
- Venture-backed funding was strongest in payments at approximately USD 6.7 billion, followed by digital lending at USD 4.9 billion and insurtech at USD 4.5 billion.
- Banking emerged as the fastest-growing segment by deal value, with median deal size jumping 70% year over year to around USD 8.5 million.
- Expansion-stage FinTech activity remained stable in 2024, with close to 500 deals completed, indicating sustained investor interest despite slower early-stage activity.
(Source: CB Insights, Statista, Deloitte)
AI in FinTech Trends
- Artificial intelligence adoption is delivering measurable efficiency gains, with FinTech firms saving an estimated USD 7.3 billion in operational costs through chatbot-driven automation.
- Customer service productivity improved significantly, as AI-powered chatbots reduced manual workloads by roughly 826 million hours across FinTech operations.
- Investor confidence in conversational AI remained strong, highlighted by a USD 150 million funding round to scale enterprise AI platforms for financial services.
- Expansion-stage FinTech and AI companies reached high valuations, with average pre-money valuations rising to about USD 650.6 million in 2024.
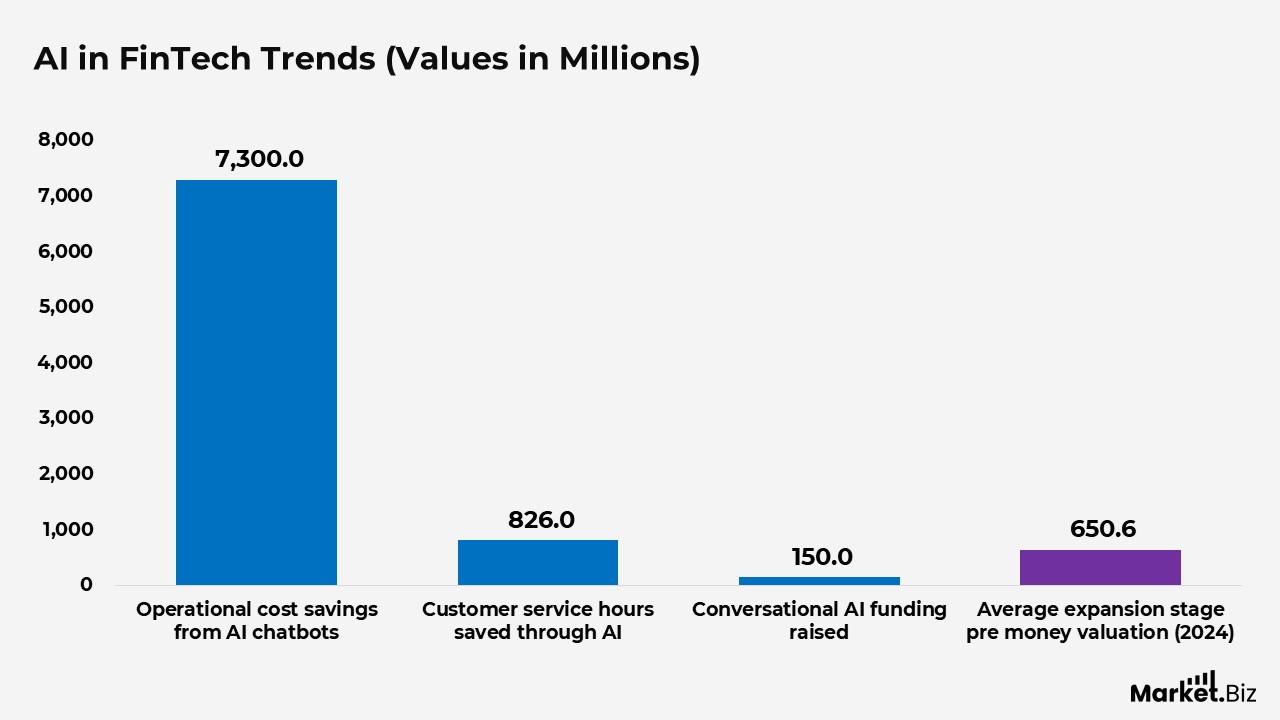
(Source: PwC, Deloitte)
Blockchain and Digital Asset Momentum
- Digital assets gained renewed attention, with 30% of the largest early-stage FinTech deals in 2024 tied to crypto- and block chain-focused companies.
- The crypto and blockchain segment recorded 91 expansion-stage deals in 2024, with total deal value approaching USD 1 billion.
- Financial institutions increasingly adopted blockchain for stablecoin payments and cross-border remittances, driven by faster settlement and reduced regulatory friction.
- Global spending on blockchain solutions rose to approximately USD 19 billion in 2024, up from USD 17.9 billion the previous year.
- The blockchain solutions market expanded rapidly between 2018 and 2024, recording a compound annual growth rate of 48%.
- Investment in digital assets increased from USD 8.7 billion in 2023 to USD 9.1 billion in 2024, signalling a recovery in investor confidence.
- The Americas led digital asset deal activity in the second half of 2024, including billion-dollar acquisitions and large-scale capital raises.
- Blockchain network usage remains high, with the Bitcoin network processing over 518,000 transactions in a single day in April 2025, and more than 19 million Bitcoins are currently in circulation.
(Source: CB Insights, Deloitte, Statista, KPMG, YCharts)
FinTech Funding Landscape
- Venture-backed FinTech funding in the Americas reached approximately USD 23.4 billion in 2024, maintaining the region’s leadership position.
- The Americas remained the top destination for FinTech capital in 2024, attracting around USD 63.8 billion, followed by EMEA at USD 20.3 billion and Asia Pacific at USD 11.4 billion.
- Despite regional strength, global VC investment in FinTech softened, declining to roughly USD 43.4 billion in 2024.
- Deal activity slowed toward the end of the year, with total FinTech transactions falling 16% quarter over quarter to 753 deals in Q3 2024, reflecting more selective investor behavior.
(Source: Statista, CB Insights)
Financial Exclusion and Access Challenges in the US Banking System
- A significant portion of unbanked Americans express concerns about formal financial institutions, with around 16.1% indicating that a lack of trust in traditional banks prevents them from opening an account.
- Structural barriers remain common, as more than 21 million people in the United States, representing about 11% of the population, do not have a government-issued identification, making access to traditional banking difficult.
- Reliance on alternative financial services continues even among account holders, with approximately 14.2% of US households, or nearly 19 million households, categorized as underbanked in 2023.
- Education levels strongly influence banking participation, as roughly 24% of unbanked individuals have not completed high school.
- Individuals who are fully banked and have access to borrowing options are generally better positioned to manage financial emergencies and economic disruptions.
- Populations that are less educated, lower income, or part of racial and ethnic minority groups are more likely to be unbanked or underbanked.
- Credit access inequities persist across income levels, with Black and Hispanic Americans, including those earning USD 100,000 or more, more frequently experiencing credit denials or receiving lower approved amounts.
(Source: Federal Deposit Insurance Corporation (FDIC), American Civil Liberties Union (ACLU), Federal Reserve)
Rising Adoption of Mobile Banking and Digital Wallet Payments
- In the first quarter of 2024, Venmo recorded strong transaction growth, with total payment volume increasing 8% year over year to approximately USD 69 billion, reflecting continued consumer reliance on peer-to-peer payment platforms.
- Mobile banking has become the preferred access channel for many consumers, as nearly 50% of banked US households relied primarily on mobile apps to manage their bank accounts in 2023.
- Digital wallets have emerged as a dominant payment method globally, facilitating around USD 13.9 trillion in transactions in 2023, accounting for about 50% of online purchases and roughly 30% of in-store point-of-sale transactions.
- The role of digital wallets is expected to expand further, with global transaction value projected to exceed USD 25 trillion by 2027, representing nearly 49% of all online and in-person sales worldwide.
(Source: Statista, Federal Deposit Insurance Corporation (FDIC), Worldpay)
Regional Growth Trends of FinTech Startups in EMEA and Asia Pacific
- In 2018, the FinTech startup ecosystem was already more established in EMEA, with around 3,581 companies, compared with approximately 2,864 startups in the Asia Pacific.
- Growth remained relatively steady in 2019, with EMEA recording about 3,583 FinTech startups and APAC seeing a marginal decline to roughly 2,849.
- A sharp acceleration occurred in 2020, when the number of FinTech startups in EMEA more than doubled to around 7,385, alongside a strong rise in APAC to approximately 4,765.
- Momentum continued in 2021, with EMEA expanding further to nearly 9,323 startups, while APAC also grew significantly, reaching about 6,268 companies.
- By 2023, EMEA maintained its upward trajectory, hosting around 9,681 FinTech startups, whereas APAC experienced some consolidation, with startup numbers easing to roughly 5,061.
- In 2024, FinTech activity strengthened again across both regions, with EMEA reaching approximately 10,969 startups and APAC rebounding to about 5,886, underscoring sustained long-term growth in regional FinTech ecosystems.
(Source: Statista, Crunchbase, Dealroom)
Key Factors Driving FinTech Adoption Worldwide
- A wide range of functionality and advanced features is the leading reason for FinTech usage, cited by 66% of users.
- Continuous service availability, with access 24 hours a day, 7 days a week, motivates 55% of users to adopt FinTech platforms.
- Ease of setting up, configuring, and using FinTech services is a key factor for 53% of global users.
- Competitive rates and lower fees influence 39% of users to choose FinTech solutions.
- Compatibility with existing daily operations and infrastructure supports adoption for 38% of users.
- Trust in the provider’s team and overall reputation drives FinTech usage for 31% of users.
(Source: Global FinTech Adoption Index)
Conclusion
FinTech industry statistics highlight the sector’s evolution from an emerging disruptor into a foundational part of the global financial ecosystem. Widespread consumer adoption, strong growth in digital payments, and continued startup innovation underline the lasting demand for efficient, technology-enabled financial services. Even as investment activity has moderated, the industry continues to demonstrate resilience through steady revenue growth, expanding use cases, and deepening user trust.
The data also reflects a more mature phase of development, where financial performance, operational efficiency, and regulatory readiness are becoming as important as rapid expansion. Rising usage among younger populations, broader acceptance of digital wallets, and ongoing innovation across payments, lending, and insurance reinforce FinTech’s long-term relevance.
Overall, the statistics point to a market that is stabilizing while still offering meaningful growth opportunities through innovation, scale, and closer integration with traditional financial systems.
FAQ’s
FinTech industry statistics consist of data-driven measures that describe how technology-based financial services are developing and performing. They cover areas such as customer adoption levels, digital payment usage, funding and investment trends, revenue generation, startup activity, and the application of technologies like mobile platforms, artificial intelligence, and blockchain across financial services.
These statistics are essential for businesses, investors, regulators, and policymakers to evaluate how the financial sector is changing. They provide clarity on market trends, emerging risks, and growth opportunities, supporting strategic decisions related to investments, product innovation, compliance planning, and geographic expansion.
FinTech usage has become mainstream worldwide, with a large share of consumers using at least one digital financial service. Digital payments and mobile wallets lead adoption, driven by widespread smartphone access, improved connectivity, and the growth of online and mobile commerce.
The strongest growth is seen in digital payments, mobile wallet solutions, online lending platforms, and embedded finance offerings. Payments continue to represent the largest user segment, while lending- and insurance-focused technologies are expanding rapidly across both consumer and enterprise markets.
FinTech companies are expanding at a much faster pace than traditional banks, recording revenue growth rates that are more than twice those of conventional financial institutions. Scalable digital models, operational efficiency, and evolving consumer expectations for seamless financial services support this advantage.