
Introduction
Cable TV statistics reveal that traditional television continues to play an important role even as streaming platforms become more widespread. Cable remains a preferred choice for many households because of its dependable access to live news, sports, and entertainment. While on-demand viewing trends are reshaping consumer habits, cable still retains a loyal audience due to its wide channel selection, straightforward viewing experience, and value-added bundled services.
At the same time, providers are upgrading their offerings through digital set-top boxes, cloud-based features, and hybrid delivery models that merge cable with internet streaming. These shifts reflect an industry that is adapting to new expectations while maintaining its long-standing relevance within the broader media landscape.
Editor’s Choice
- More than 66.1 million people in the US continue to use cable TV services.
- Global pay-TV platforms lost roughly 20 million users between 2021 and 2023.
- China leads the world in pay-TV access, with about 76 subscriptions per 100 households.
- Close to 69% of the most-watched cable programming is dominated by sports content.
- Over 8 in 10 consumers cite high pricing as their main motivation for abandoning cable services.
- The worldwide cable TV sector generated nearly $200 billion in revenue in 2022.
- By 2023, close to 60% of US households were still subscribed to cable TV packages.
- The US cable market lost around 4 million subscribers between 2019 and 2023.
- European cable TV adoption hovered near 45% in 2022.
- The typical monthly cable bill in the US was about $100 in 2023.
- More than 70% of American cable homes also maintain high-speed internet subscriptions.
- The global pay-TV ecosystem, covering cable, satellite, and IPTV, is expected to reach around $319 billion by 2025.
- India’s cable TV reach was nearly 48% in 2022.
- Cable subscriptions in the US have fallen by roughly 35% over the past ten years.
- Prime-time cable TV viewing has dropped by almost 30% since 2019.
- Leading cable TV networks in the US collectively connect with over 100 million households.
- Around 55% of cable subscribers have either already cut the cord or intend to do so
- The average cable TV user in the US is approximately 52 years old.
Global Pay TV Subscription Statistics
- Worldwide pay-TV users fell from 1.01 billion in 2021 to about 985 million in 2023.
- The industry recorded a nearly 20 million-subscriber reduction during these two years.
- Subscriber numbers reached 993 million in 2022 before continuing their downward shift.
- In 2023, global pay-TV subscriptions were estimated at 985 million, reflecting continued subscriber losses.
- The year 2022 closed with around 993 million pay-TV users worldwide, marking a steady decline from earlier years.
- In 2021, pay-TV platforms collectively served approximately 1.013 billion subscribers, the highest level in the past three years.
(Source: Statista, Evoca.tv)
Cable TV Subscriptions in the United States
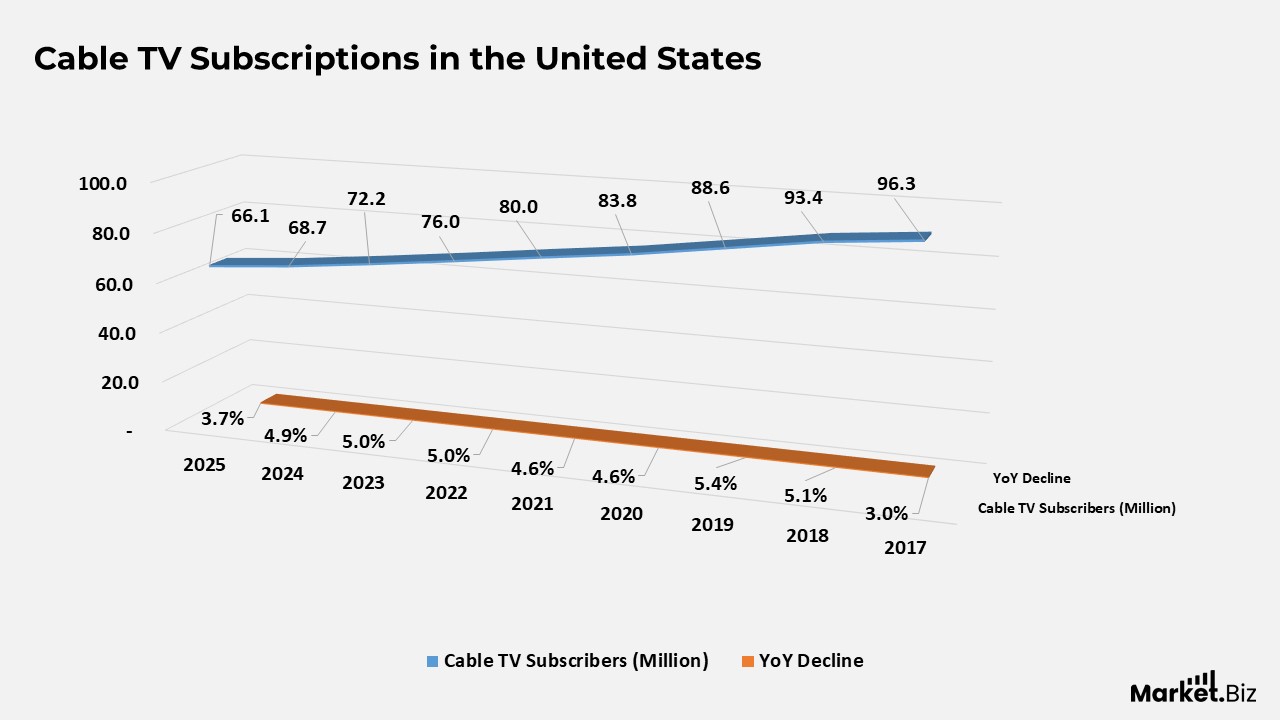
- Around 66.1 million U.S. households maintained a cable TV subscription in 2025, reflecting a 3.7% year-over-year drop.
- In 2024, the nationwide cable subscriber base stood at roughly 68.7 million, continuing its downward trajectory.
- Cable adoption has been steadily declining since 2011, as streaming platforms expand and cord-cutting accelerates, resulting in a notable decline in traditional cable TV subscribers over the past decade.
- In 2025, U.S. cable TV subscribers were about 66.1 million, marking a 3.7% annual drop.
- By 2024, subscriptions fell to roughly 68.7 million, reflecting a 4.9% year-over-year decline.
- In 2023, the subscriber base decreased to around 72.2 million, with a 5% reduction from the previous year.
- Cable TV users totaled nearly 76 million in 2022, continuing a 5% annual decline.
- In 2021, the market had close to 80 million subscribers, down 4.6% year over year.
- In 2020, subscriber numbers dropped to about 83.8 million, a 4.6% decline from the prior year.
- In 2019, cable TV households declined to nearly 88.6 million, showing a 5.4% drop.
- The 2018 subscriber base stood at approximately 93.4 million, down 5.1% from 2017.
- In 2017, U.S. cable subscriptions reached around 96.3 million, down 3% year over year.
(Source: IBIS World, Evoca.tv)
Number of Cable TV Subscriptions
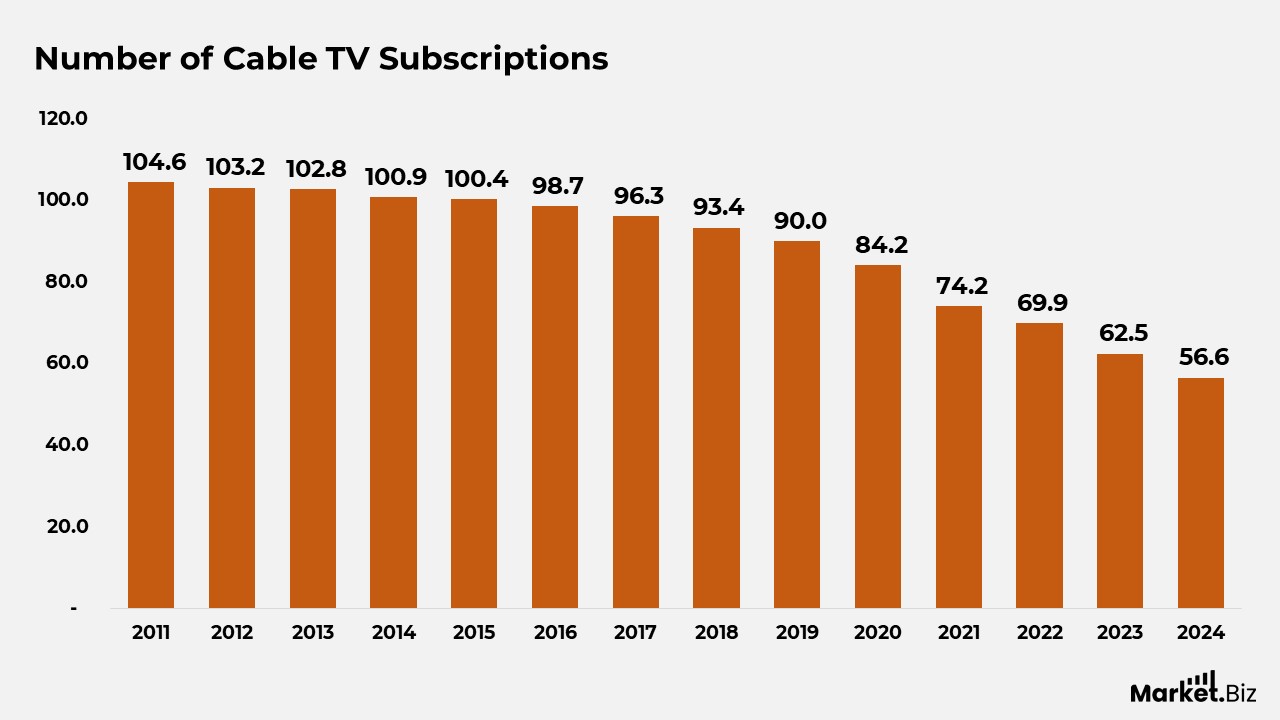
- In 2011, cable TV subscriptions in the United States were around 104.6 million, marking the decade’s peak.
- By 2012, the subscriber base dipped slightly to 103.2 million, signaling the start of a gradual decline.
- In 2013, subscriptions continued to fall to roughly 102.8 million, reflecting early cord-cutting behaviour.
- In 2014, numbers dropped to about 100.9 million, bringing the total close to the 100-million threshold.
- In 2015, cable households stood near 100.4 million, maintaining the downward trend.
- By 2016, subscriptions fell further to 98.7 million as streaming alternatives gained momentum.
- The market reached around 96.3 million subscribers in 2017, continuing steady annual declines.
- In 2018, the subscriber base reduced to approximately 93.4 million, showcasing accelerating viewer migration to digital platforms.
- The year 2019 saw cable subscriptions contract to 90 million, entering a sharper decline.
- In 2020, subscriptions slid to around 84.2 million, influenced in part by shifting consumer viewing habits.
- By 2021, the number fell substantially to 74.2 million, marking one of the steepest year-to-year declines.
- Cable TV households dropped to 69.9 million in 2022 as cord-cutting became mainstream.
- In 2023, total subscriptions decreased to about 62.5 million, highlighting sustained erosion.
- By 2024, the subscriber count reached roughly 56.6 million, underscoring over a decade of continuous decline.
(Source: IBIS World, Evoca.tv)
Global Cable TV Penetration and Adoption
- By 2023, roughly 60% of households in the United States continued to rely on cable TV services.
- Between 2019 and 2023, the U.S. cable market lost nearly 4 million subscribers.
- Cable TV usage across Europe reached around 45% in 2022.
- More than 70% of U.S. cable-connected homes also had high-speed internet access.
- Cable penetration in India was close to 48% in 2022.
- Over the last ten years, cable subscriptions in the U.S. have declined by approximately 35%.
- China saw a 15% reduction in cable TV households from 2018 to 2022.
- In Canada, around 65% of households subscribed to cable TV in 2022.
- Global IPTV adoption rose by about 25% in 2022 as users shifted toward digital viewing.
- In 2022, an estimated 50 million U.S. households still relied mainly on cable TV for their content.
- Russia recorded a 10% decrease in cable-connected households between 2017 and 2022.
- Japan’s cable TV penetration rate hovered around 30% in 2022.
- Australia reported a cable adoption rate of nearly 55% in 2022.
- Worldwide cable TV subscriptions in 2023 were estimated to exceed 400 million.
(Source: ZipDo.co. Statista)
General Cable TV Statistics
- In 2023, cable TV subscriptions stood at 72.2 million, a steep drop from the 98.7 million recorded in 2016.
- Across the United States, about 1,775 TV stations and nearly 5,200 cable systems operated by 660 providers collectively reach close to 90% of the national population.
- Comcast reported a loss of 2 million cable customers in 2022, exceeding the 1.66 million decline the company experienced in 2021.
- Subscriber data indicates Comcast remains the top cable operator with roughly 17.1 million users, followed by Charter at around 15.5 million.
- NBC averaged 5.1 million viewers in 2022, narrowly edging past CBS in overall annual audience numbers.
- Traditional television now accounts for only 28% of total media consumption, with cable viewership expected to fall an additional 28% annually as digital behavior accelerates. In 2022, just 68% of Americans still subscribed to cable services.
- Around 6 million Americans dropped their cable TV plans in 2020, emphasizing the intensity of the cord-cutting movement during that period.
- Despite the shift toward streaming, more than half of U.S. consumers still preferred cable in 2022, indicating that demand persists among certain viewer groups.
- Nearly 1,800 TV stations across the U.S. contribute to the breadth of programming available through cable networks.
(Source: cablecompare.com, Coolest-Gadgets)
Cable TV Networks by Viewership
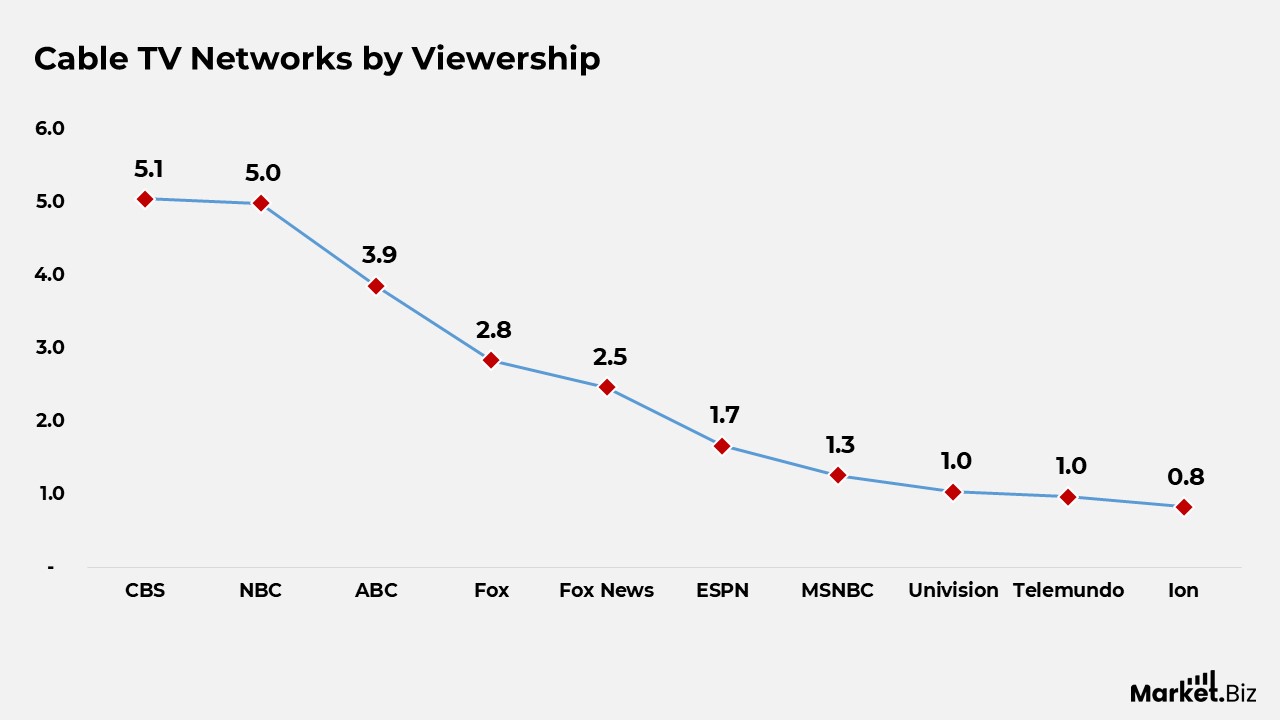
- In 2024, CBS led the rankings with roughly 5.05 million viewers, up 12% from the previous year.
- NBC followed closely with about 4.99 million viewers and reported a solid 10% increase in its audience base.
- ABC averaged nearly 3.86 million viewers, down slightly from earlier performances.
- Fox drew around 2.84 million viewers, a notable 15% decline.
- Fox News reached approximately 2.47 million viewers, posting a 30% surge, making it one of the fastest-growing networks.
- ESPN attracted roughly 1.67 million viewers, down modestly 2% year over year.
- MSNBC maintained an audience of nearly 1.26 million, up 4% from the previous week.
- Univision brought in about 1.04 million viewers but experienced a significant 17% drop.
- Telemundo reached nearly 965,000 viewers, posting a 12% gain.
- Ion rounded out the top ten with around 833,000 viewers, a 16% decline from the previous week.
(Source: Variety, evoca. tv)
Demographics of Cable TV Subscribers
By Age
- Among adults aged 18–34, about 34% maintained a cable TV subscription, reflecting lower engagement than among older groups.
- In the 35–44 age bracket, roughly 35% reported subscribing to cable services, indicating moderate retention.
- Adults aged 45–64 showed greater loyalty, with around 41% still relying on cable TV for their viewing.
- The highest adoption rate was among those 65 and older, with approximately 50% continuing to use traditional cable TV.
Cable TV Subscription Status by Ethnicity
- Among White adults, around 39% currently subscribe to cable TV, another 39% have subscribed in the past, and about 22% have never used cable services.
- Within the Hispanic population, roughly 37% are current subscribers, while 43% previously subscribed, and 21% have never adopted cable TV.
- African American adults show the highest current adoption, with about 46% still subscribing; 34% subscribed before, and 20% have never used cable TV.
- For adults categorized as Other ethnicities, approximately 36% remain current subscribers, 35% were former users, and 29% have never subscribed.
(Source: evoca. TV, Statista)
How Different Age Groups Use Cable TV
- Among adults aged 18–34, about 10% watched cable TV multiple times daily, while over half (52%) reported never watching it.
- In the 35–44 group, roughly 20% tuned in multiple times a day, and 43% said they never watched cable TV.
- Adults aged 45–64 showed mixed engagement: 21% watched several times daily, but 55% reported no cable TV use at all.
- The 65+ audience demonstrated the strongest daily engagement, with 38% watching multiple times a day, while 45% indicated they never watched cable TV.
- Daily single-viewing habits were relatively consistent across all age groups, ranging between 8% and 9%.
- Weekly and occasional viewing rates declined noticeably among older age groups, especially for “once per week” and “a few times per week” categories.
- Younger audiences (18–34) showed the highest share of non-viewers, underscoring their strong preference for streaming alternatives.
(Source: Statista, evoca. Tv)
Gender Comparison of Cable TV Watching Frequency
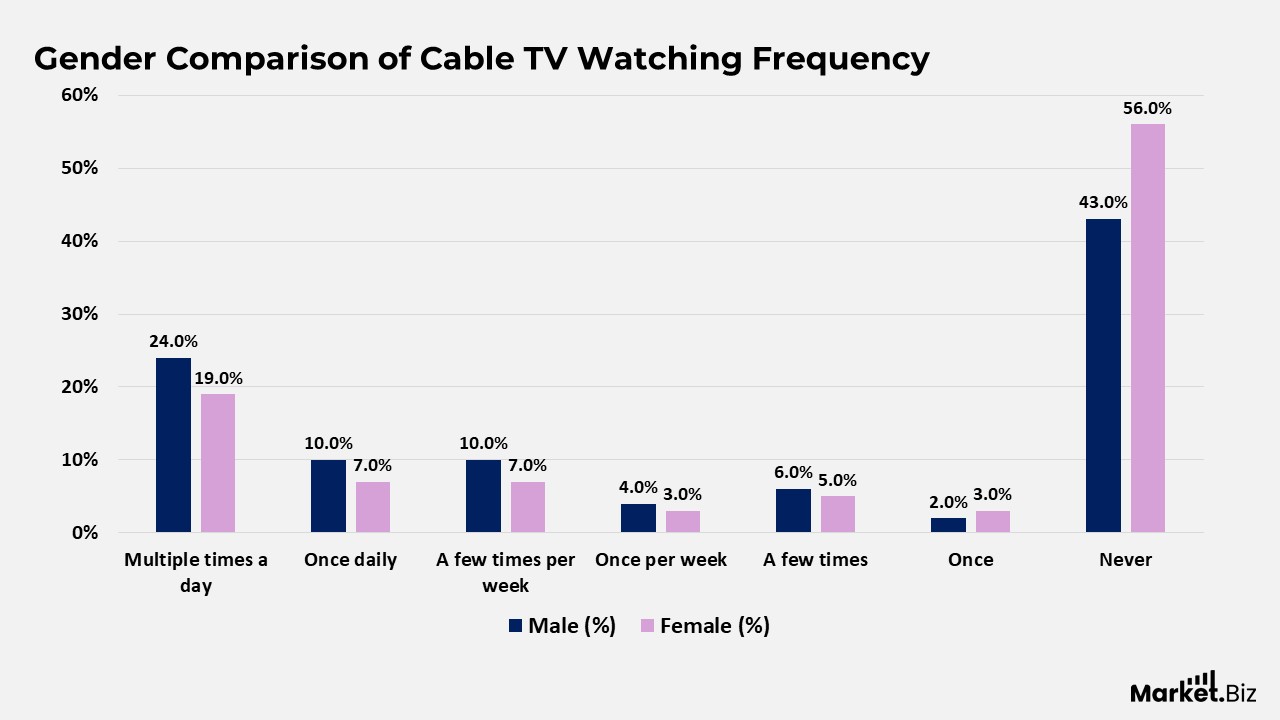
- Among male adults, 24% watched cable TV multiple times a day, compared with 19% of female adults.
- Daily viewing was more common among men, with 10% watching once per day, compared with only 7% among women.
- A few times per week was reported by 10% of men and 7% of women, suggesting a similar mid-level engagement pattern.
- Weekly viewing (once per week) remained relatively low, with 4% of men and 3% of women watching at this frequency.
- Occasional viewing (a few times) was reported by 6% of male respondents and 5% of female respondents.
- Only a small share watched cable TV at least once during the measured period, with 2% for men and 3% for women.
- A significantly larger portion of women (56%) said they never watched cable TV, compared with 43% of men, indicating stronger disengagement among female audiences.
(Source: Statista, evoca. Tv)
Cable TV Viewing Frequency Across Generations
- Among Gen Z, only 8% watched cable TV multiple times daily, while half of this generation (50%) reported never watching it at all.
- Millennials showed slightly higher daily engagement, with 15% watching multiple times a day, yet 50% still indicated no cable TV usage.
- Among Gen X, about 20% tuned in multiple times daily, but a majority (53%) said they never watched cable TV.
- Baby Boomers demonstrated the strongest daily patterns, with 31% watching multiple times a day, although 50% also reported never engaging with cable content.
- Daily single-viewing rates remained relatively similar across generations, ranging between 7% and 9%.
- Weekly viewing (once per week) dropped sharply with age group progression, especially among Baby Boomers (1%).
- Occasional viewing (a few times or once) appeared modest across all generational groups, with minor variations.
(Source: Statista, evoca. Tv)
Frequency of Using Cable TV for News
- Around 21% of U.S. adults relied on cable TV daily to stay informed about news.
- Roughly 15% turned to cable TV a few times each week for news consumption.
- About 6% checked cable news once per week, showing moderate engagement.
- Occasional news viewers accounted for 8%; a smaller group, about 3%, accessed cable TV a few times per month for news updates. Another 8% tuned in even less frequently than once per month.
- A sizeable share, 39%, reported never using cable TV for news, highlighting a strong shift toward digital and social platforms for information.
(Source: Statista, evoca. Tv)
Factors Driving Cable TV Cord-Cutting
- The overwhelming majority of cord-cutters (86.7%) cite high pricing as the primary motivation for leaving cable TV.
- Nearly 39.7% of adults prefer streaming platforms, making it a major driver of cable abandonment.
- About 23% switch to antenna-based TV as a low-cost alternative for essential channels.
- Around 15.9% choose to cut the cord because they favor binge-watching formats available on streaming services.
- Relocation also plays a role, with 13% avoiding cable renewal when moving to a new residence.
- Preference for exclusive, original programming on streaming platforms influences another 7.7% of cord-cutters.
(Source: Statista, evoca. Tv)
Primary Reasons U.S. Adults Discontinue Their Cable TV Service
- About 31.02% of cord-cutters indicated that cable TV had become too expensive for their household budget.
- Nearly 8.03% said they did not use cable frequently enough to justify continuing the subscription.
- Around 6.53% reported dropping cable service because they were dissatisfied with the quality of service.
- For 5.79%, the cable system was found to be too complicated or inconvenient to use.
- Roughly 5.04% stopped using cable after no longer watching live news broadcasts.
- About 4.16% switched away from cable due to fewer commercials on streaming platforms.
- Influence from children persuaded 3.9% of users to let go of cable, while 3.87% decided after being encouraged by parents.
- Approximately 3.81% no longer watched live entertainment events on cable, leading them to cancel their subscriptions.
- Nearly 3.71% stopped watching political programming on cable and decided to discontinue the service.
- For 3.37%, moving to an area without cable access triggered the cancellation.
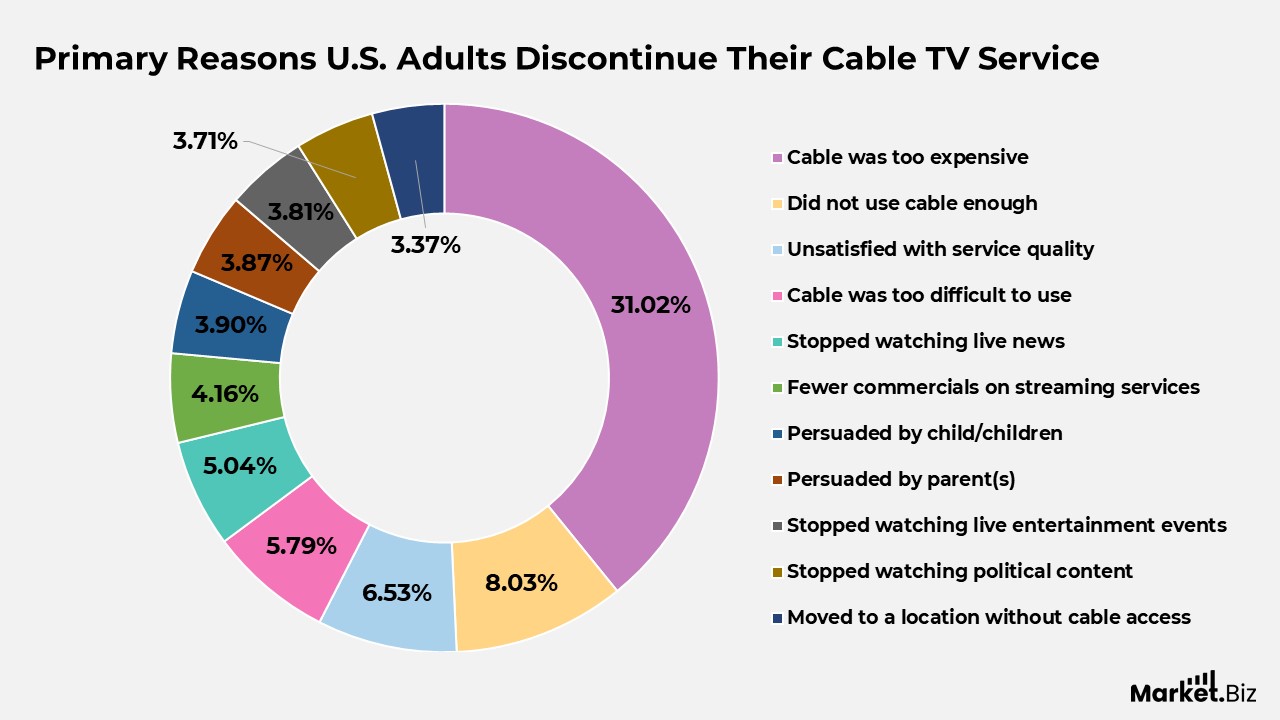
(Source: Statista, evoca. Tv)
Revenue Trends in the U.S. Traditional TV and Home Video
- By 2027, U.S. pay TV revenue is projected to reach USD 81.33 billion, with traditional TV advertising at USD 53.13 billion and physical home video revenue at USD 2.59 billion.
- In 2026, pay TV revenue is estimated at USD 82.39 billion, advertising revenue at USD 55.15 billion, and physical home video revenue at USD 2.76 billion.
- Forecasts for 2025 show pay TV generating USD 83.42 billion, traditional TV ads contributing USD 57.16 billion, and home video revenue at USD 2.92 billion.
- During 2024, pay TV revenue is expected to reach USD 84.29 billion, with ad revenue at USD 59.18 billion and physical home video at USD 3.09 billion.
- In 2023, pay TV revenue declined slightly to USD 84.89 billion, while ad revenue totalled USD 61.04 billion and home video revenue totalled USD 3.25 billion.
- For 2022, pay TV generated USD 86.21 billion, traditional TV ads brought in USD 62.28 billion, and physical home video earned USD 3.44 billion.
- In 2021, pay TV revenue totalled USD 93.17 billion, ad revenue reached USD 63.26 billion, and home video revenue totalled USD 3.87 billion.
- During 2020, revenues were USD 93.83 billion for pay TV, USD 63.71 billion for traditional ads, and USD 4.07 billion for home video.
- In 2019, pay TV revenue climbed to USD 97.53 billion, with TV advertising at USD 68.52 billion and home video at USD 4.26 billion.
- In 2018, pay TV posted USD 98.81 billion, traditional ads earned USD 69.58 billion, and home video revenue totalled USD 4.45 billion.
- In 2017, the market recorded USD 100.09 billion in pay TV revenue, USD 68.47 billion in advertising, and USD 4.63 billion in physical home video revenue.
(Source: Statista)
Conclusion
Cable TV statistics show a landscape steadily evolving as audience behaviour shifts toward streaming and digital-first entertainment. While subscriptions continue to decline, cable TV remains relevant, especially for viewers who rely on real-time news, sports, and established channel bundles.
Despite reduced penetration across key regions, cable providers maintain extensive distribution networks and strong brand familiarity, keeping the sector significant within the wider pay-TV market.
The ongoing transition underscores the need for modernized service models, flexible pricing, and deeper integration with digital platforms. Ultimately, cable TV remains influential, even as the industry adapts to a future increasingly shaped by on-demand and internet-based viewing.
FAQ’s
Cable TV metrics point to a steady movement away from fixed broadcast schedules and toward flexible, on-demand viewing. This evolution mirrors wider shifts in digital adoption, user control over content, and rising expectations for instant access.
Subscription declines signal a fundamental shift in the market, as viewers gravitate toward platforms that offer customizable experiences, lower costs, and greater convenience. This reflects a redistribution of viewership rather than a reduction in overall media use.
Live content, particularly sports and breaking news, offers real-time engagement that streaming services often cannot match. These formats hold strong appeal, acting as stabilizers that slow the rate at which subscribers move away from cable.
Improvements in internet quality, smart device capabilities, and streaming interfaces enhance the ease of digital viewing and diminish the relative value of cable packages. Such advancements speed up the transition toward cross-device, on-demand media habits.
Higher cable fees and the growing availability of more affordable digital options encourage consumers to switch platforms. Financial considerations weaken the appeal of bundled cable plans, especially among households seeking cost-efficient entertainment choices.