
Introduction
Media streaming statistics offer a concise view of how digital content consumption is transforming entertainment, education, gaming, and live communication as audiences move away from traditional broadcast media toward on-demand and real-time platforms.
These statistics capture key trends, including user adoption, viewing hours, device usage, subscription behaviour, and content preferences, reflecting the impact of high-speed internet, smartphone penetration, smart TVs, and cloud-based delivery.
For businesses, investors, and policymakers, media streaming data provides critical insight into market scale, growth patterns, regional demand, and the influence of emerging technologies such as AI-driven personalisation and advanced connectivity, helping define the current landscape and future trajectory of the global media streaming ecosystem.
Editor’s Choice
- Around 27.7% of internet users watch live streams every week, with live content holding attention far longer than on-demand video, as average live sessions reach nearly 25 minutes, about 8X higher viewing duration.
- Twitch continues to lead the live streaming landscape by total watch time, accounting for roughly 61% of global live stream hours in 2024, while YouTube captures close to 23%, and emerging platforms such as Kick are rapidly expanding with almost 6% share.
- In terms of audience reach, YouTube is the most widely used live streaming platform globally, with about 52% of live stream viewers, followed by Facebook at 42.6%, with Instagram and TikTok also playing significant roles.
- Mobile devices now account for approximately 27% of total live stream viewing, a figure projected to rise further as mobile connectivity and streaming quality continue to improve.
- Live streaming has become a core social media activity, with nearly 22.7% of social media users, representing about 1.17 billion people, regularly watching live video on platforms such as Facebook, Instagram, and TikTok.
- Streaming now accounts for nearly 36% of total television viewing time, highlighting the steady shift away from traditional broadcast channels.
- Global demand for digital entertainment is reflected in the estimated 1.8 billion active video streaming subscriptions across platforms worldwide.
- Binge viewing has become a routine, with about 26% of audiences saying they watch multiple episodes in a single sitting at least once a week.
- Netflix continues to dominate the subscription-based streaming market, with a global user base of well over 200 million.
- The original series continues to drive engagement, with Ted Lasso emerging as the most-watched program of 2023, accumulating approximately 16.9 billion minutes of total viewing time.
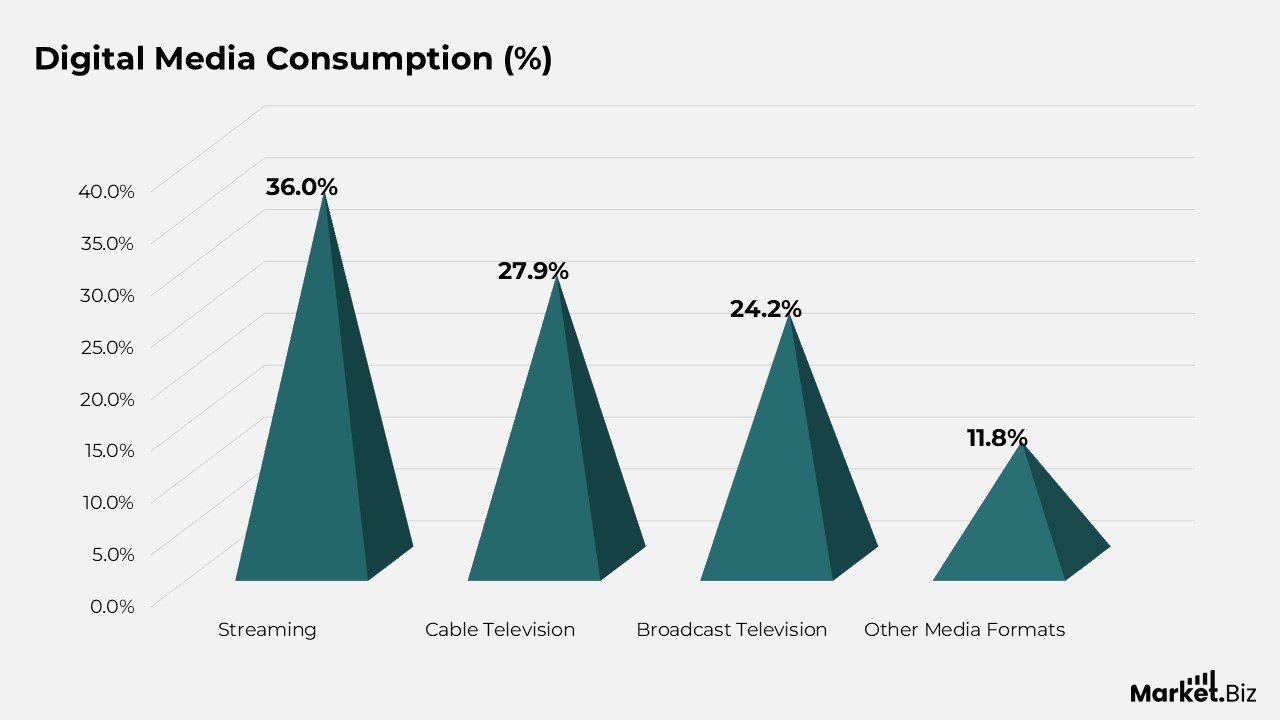
Digital Media Consumption
- Streaming platforms lead digital media consumption in 2025, capturing 36% of total viewers as on-demand content continues to dominate viewing habits.
- Cable television remains a significant channel, accounting for 27.9% of the audience, supported by bundled services and live programming.
- Traditional broadcast media still attracts 24.2% of viewers, reflecting its continued relevance for news, sports, and scheduled content.
- Alternative media formats, including niche and hybrid viewing options, represent the remaining 11.8% of overall viewership, indicating a gradual diversification of content consumption channels.
(Source: Nielsen, Exploding Topic)
General Media Streaming Statistics
- Leading platforms such as Twitch, YouTube Live, Facebook Gaming, and services operated by major Chinese technology companies continue to dominate the global live streaming ecosystem.
- In the US market, ad-supported viewing remains prevalent, with about 85% of Prime Video users opting for ad-supported plans and only 15% choosing ad-free access. In comparison, Netflix shows a contrasting split of 22% ad-supported and 78% ad-free users.
- On a global scale, around 35% of TV and video streaming audiences have paid to remove advertisements, a figure that rises sharply to 48% among music streaming subscribers.
- Despite widespread adoption, nearly 48% of users pay for streaming subscriptions they rarely or never use, highlighting growing subscription fatigue.
- Close to one-third of global internet users engage with live streams weekly, with live concerts and music-related content emerging as the most viewed categories.
- Younger audiences show high engagement, with about 12% of adults aged 18 to 34 watching live-stream videos multiple times each day.
- In the US, consumers spend an average of nearly 8 hours per day streaming digital media across video, music, and social platforms.
- Monthly streaming expenses remain substantial, with the average American spending close to USD 46 per month on streaming services.
- Pricing pressures continue to affect retention, with roughly 45% of users cancelling at least one streaming subscription in the past year due to rising costs.
- Streaming penetration is nearly universal in the US, with about 99% of households subscribing to at least one streaming service.
(Source: Forbes, G2.com, Inc.)
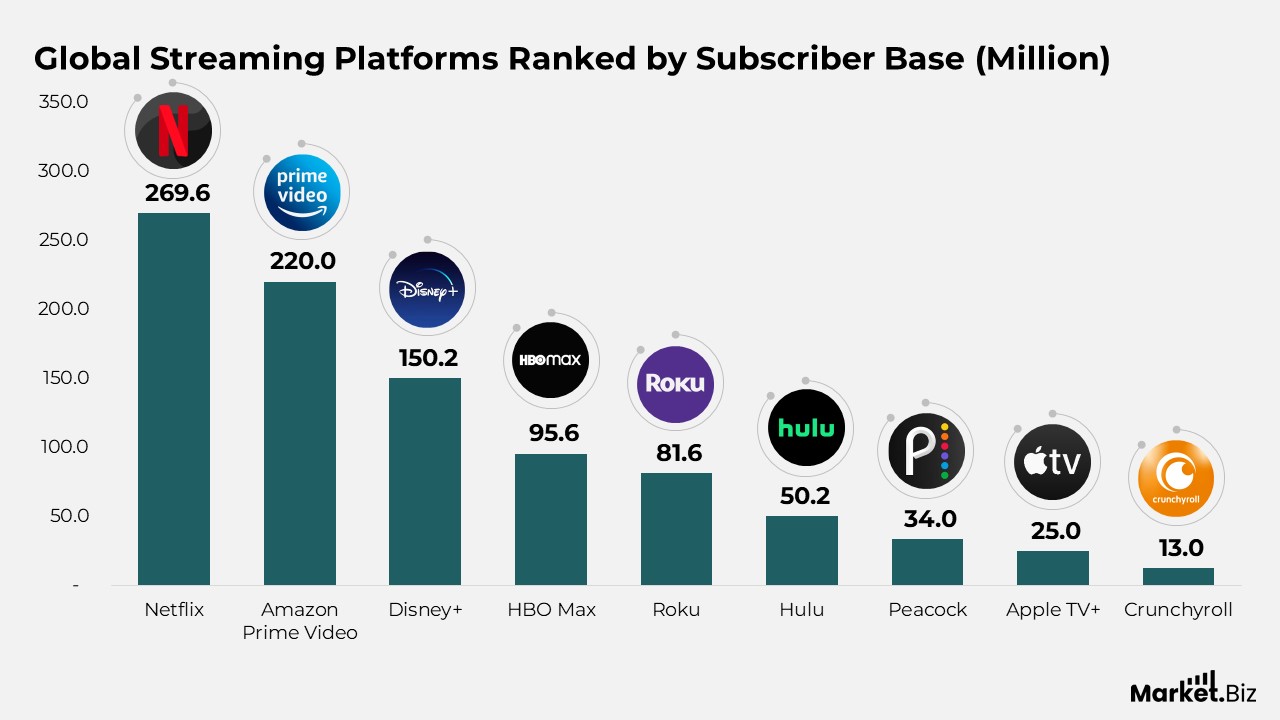
Global Streaming Platforms Ranked by Subscriber Base
- Netflix continues to lead the global streaming market, with a subscriber base of approximately 269.6 million, reflecting its strong international presence and extensive content library.
- Amazon Prime Video follows closely, reaching around 220 million subscribers worldwide, supported by its integration with broader Prime membership benefits.
- Disney+ maintains a solid global footprint of about 150.2 million subscribers, driven by family-oriented content and major franchises.
- HBO Max has established a strong premium audience, attracting nearly 95.6 million subscribers through high-quality original programming and exclusive releases.
- Roku’s platform-based streaming ecosystem serves roughly 81.6 million users, benefiting from its wide device adoption and advertising-supported model.
- Hulu holds a notable position in the US streaming landscape, with close to 50.2 million subscribers, supported by its mix of live TV and on-demand content.
- Peacock continues to expand its audience, reaching approximately 34 million subscribers across both free and paid tiers.
- Apple TV+ remains a smaller but growing player, with around 25 million subscribers, focused on original and exclusive productions.
- Crunchyroll caters to niche audiences, particularly anime fans, with a global subscriber base of about 13 million.
(Source: VdoCipher, Statista)
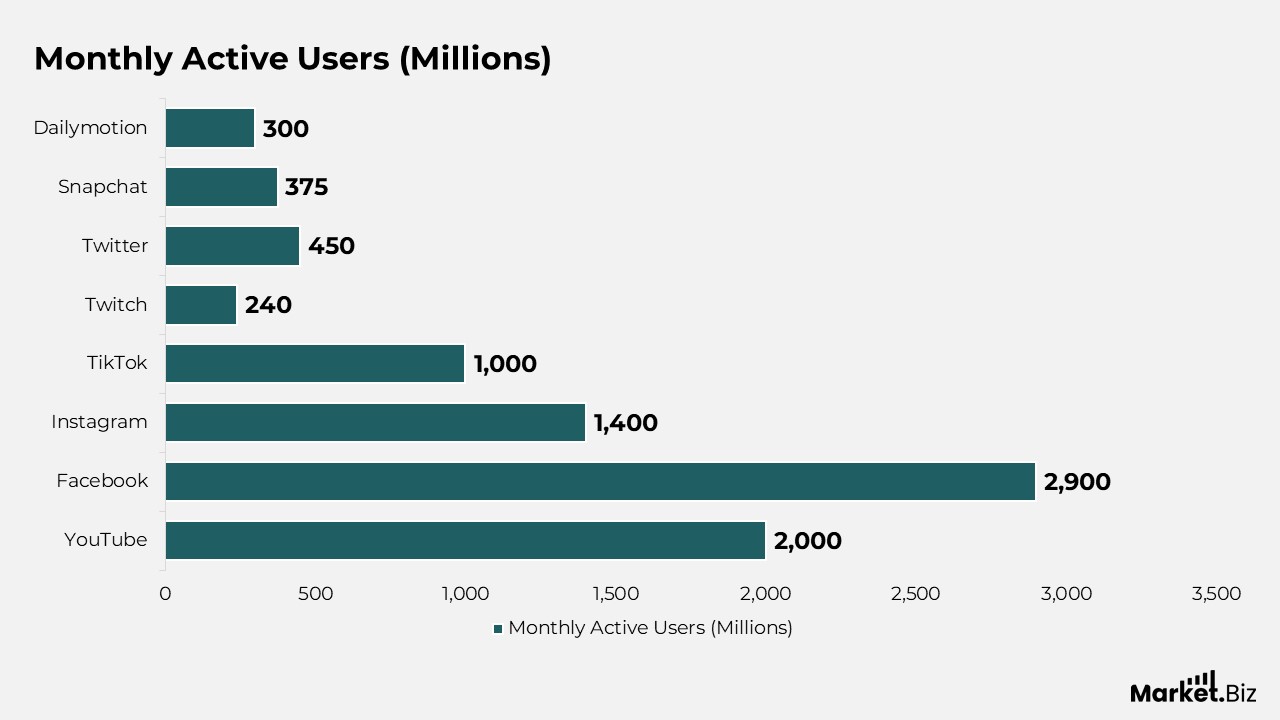
Monthly User Reach of Major Social Media Streaming Platforms Statistics
- YouTube remains one of the most widely used streaming-enabled social platforms, attracting nearly 2,000 million monthly users worldwide.
- Facebook leads the social media landscape in overall reach, with an estimated 2,900 billion active users engaging with video and live-streaming features each month.
- Instagram remains a major hub for short-form and live video consumption, with around 1,400 billion monthly users.
- TikTok has rapidly scaled its audience, reaching approximately 1,000 million monthly users driven by short-form video and live-streaming engagement.
- Twitch dominates the live-streaming-focused segment, particularly in gaming and creator-led content, with about 240 million monthly users.
- Twitter supports real-time video and live discussions, engaging close to 450 million users each month.
- Snapchat maintains a strong presence among younger audiences, with roughly 375 million monthly users consuming short video and live content.
- Dailymotion serves a global audience of around 300 million monthly users and offers a mix of professional and user-generated streaming content.
(Source: VdoCipher, Statista)
Growth of Household Video Streaming Subscriptions Over Time
- In 2015, just over half of households, around 52%, had at least one video streaming subscription, marking the early stage of mass adoption.
- By 2017, household penetration had risen significantly to 64%, reflecting the rapid adoption of subscription-based streaming services.
- Streaming adoption continued to climb in 2018, with approximately 69% of households subscribed to one or more platforms.
- In 2019, nearly three-quarters of households (74%) used video streaming subscriptions as part of their regular media consumption.
- The shift accelerated in 2020, when household subscription penetration increased to 78%, driven by higher in-home media consumption.
- Adoption levels remained steady in 2021, holding at 78%, indicating a period of consolidation after rapid growth.
- By 2022, household streaming subscriptions expanded further to 83%, indicating continued long-term integration into everyday viewing habits.
- This high level of adoption was sustained in 2023, with 83% of households maintaining video streaming subscriptions.
(Source: Exploding Topics)
Monthly Shifts in Digital Media Consumption Patterns
- In December 2021, streaming accounted for 27.7% of total media consumption, trailing cable at 37.3%, while broadcast accounted for 26.1% and other formats accounted for 8.9%.
- Through early 2022, streaming showed steady month-over-month growth, rising from 28.9% in January to 31.9% by May, while cable viewing gradually declined from 35.6% to 36.5%, and broadcast slowly edged downward.
- By mid-2022, streaming strengthened its position, reaching 33.7% in June and 34.8% in July, as broadcast viewing dropped closer to the low 20% range and cable slipped toward the mid 30% range.
- In the second half of 2022, streaming became the dominant format, peaking at 38.2% in November, while cable fell to 31.8% and broadcast fluctuated around 25%.
- Entering 2023, streaming experienced a brief decline to 32.8% in January, while other viewing formats rose to nearly 11.9%, suggesting seasonal or behavioural shifts.
- As 2023 progressed, streaming recovered steadily, climbing from 34% in April to 38.7% in July, while cable dropped below 30% and broadcast reached its lowest levels near 20%.
- In the latter part of 2023, streaming stabilised between 35.9% and 37.5%, while cable continued its gradual decline to around 28.2% by December, and other formats gained share.
- By January 2024, streaming maintained leadership at 36%, cable usage declined further to 27.9%, broadcast remained steady at 24.2%, and alternative viewing options accounted for 11.8%, reflecting a more diversified digital media landscape.
(Source: Exploding Topics, Leichtman Research Group, Statista, Forbes, Nielsen, EarthWeb)
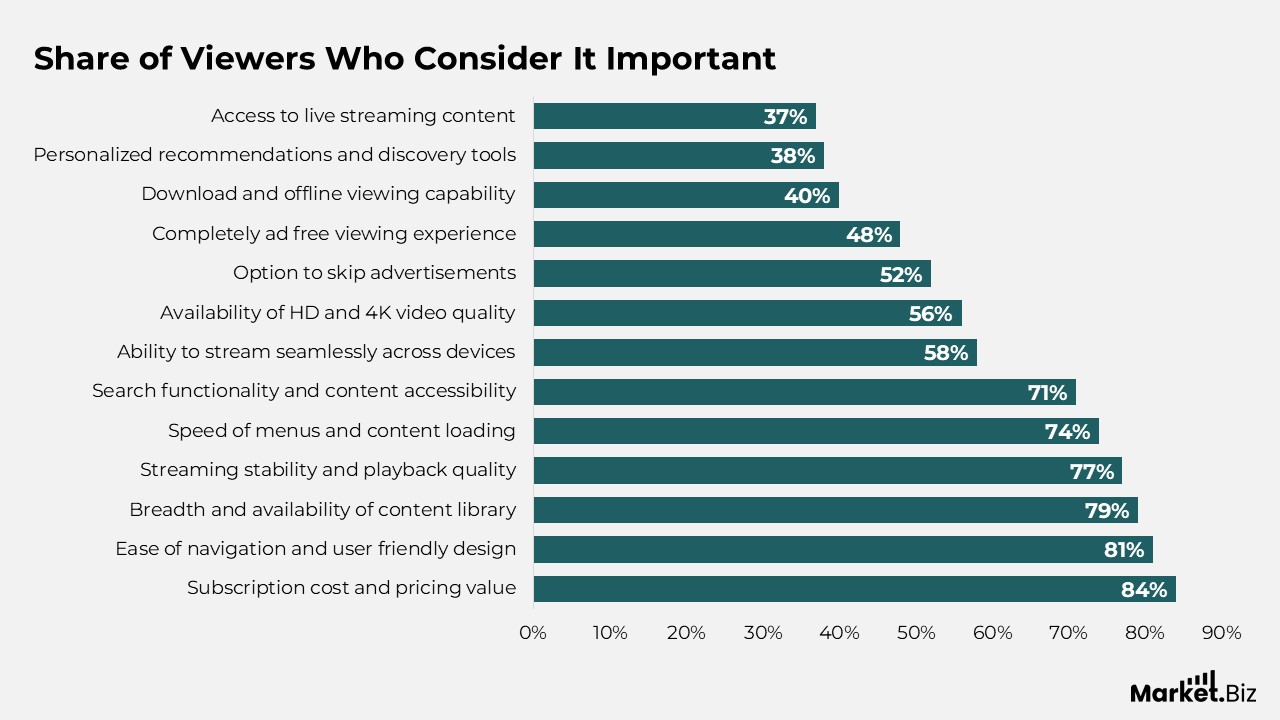
Factors Influencing Consumer Choice of Video Streaming Services
- Pricing remains the most critical consideration for viewers, with about 84% of users ranking cost as an important factor when choosing a video streaming platform.
- A simple, intuitive platform design is highly valued, as roughly 81% of viewers prioritise ease of use in their streaming experience.
- Content depth and selection play a major role, with nearly 79% of users emphasising the importance of a wide, readily available content library.
- Viewing experience quality matters to most audiences, as around 77% consider smooth streaming and reliable playback performance essential.
- Platform responsiveness is another key attribute, with approximately 74% of users valuing fast menu navigation and quick content loading times.
- Finding the right content efficiently is important for many users, with about 71% highlighting accessibility and effective search functionality.
- Cross-device compatibility influences platform preference, with roughly 58% of viewers expecting seamless access across multiple devices.
- High-quality video formats continue to gain attention, as around 56% of users value access to HD and 4K Ultra HD resolution options.
- Control over advertising remains relevant, with approximately 52% of viewers considering the ability to skip ads an important feature.
- Nearly 48% of users prefer ad-free viewing options, reflecting growing sensitivity to uninterrupted content consumption.
- Offline viewing capability appeals to a smaller but notable segment, with about 40% valuing the option to download content for later use.
- Personalized discovery tools matter to some viewers, with roughly 38% appreciating menu-based recommendations.
- Live content availability is a lower priority overall, yet still important to around 37% of viewers.
(Source: Exploding Topics)
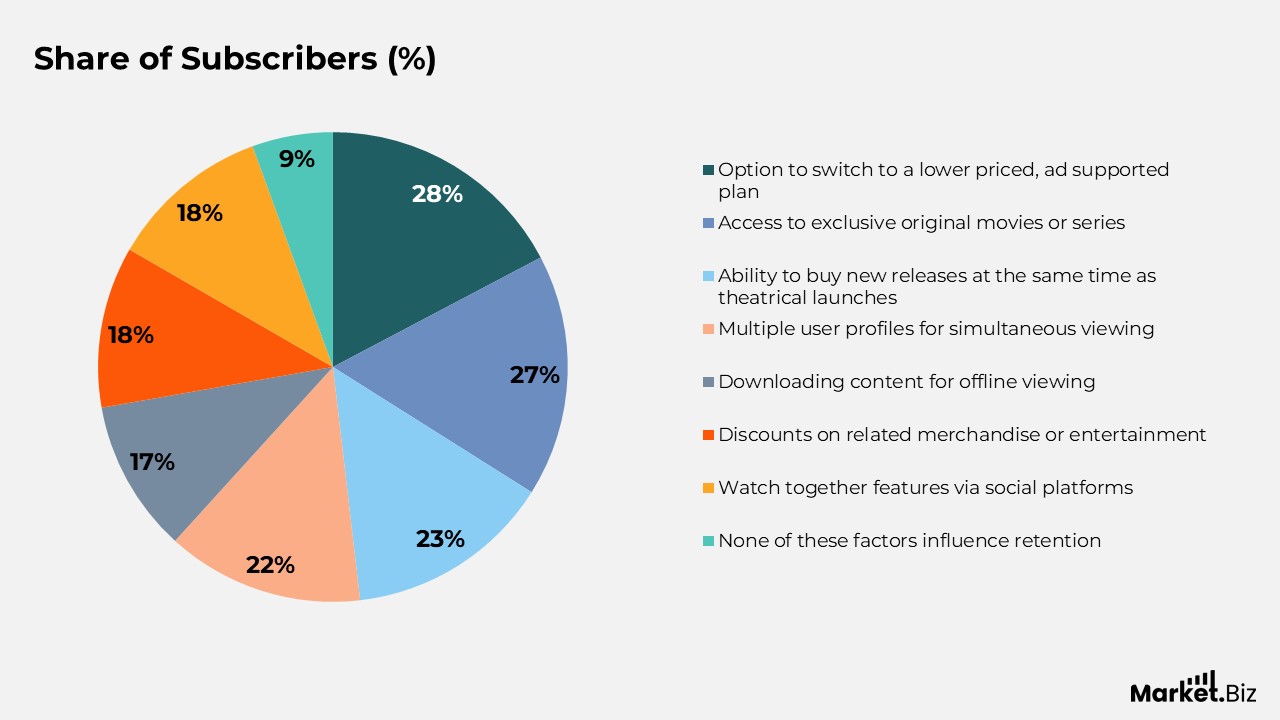
Factors That Encourage Subscribers to Retain SVOD Services
- Flexible pricing options influence retention, with about 28% of subscribers saying they are more likely to stay if they can switch to a lower-cost, ad-supported plan.
- Exclusive content remains a strong loyalty driver, as roughly 27% of users continue subscriptions to access new original movies or series unavailable elsewhere.
- Early access to premium releases adds value for many viewers, with around 23% favoring services that allow movie purchases aligned with theatrical release timing.
- Account sharing flexibility matters to households, with approximately 22% valuing the option to add multiple profiles for simultaneous viewing.
- Offline viewing capability supports continued use for some users, as about 17% cite download and offline access as reasons to keep their subscription.
- Added lifestyle and brand benefits play a role, with nearly 18% of subscribers appreciating discounts on related merchandise or entertainment experiences.
- Social viewing features also attract interest, as around 18% of users value the ability to watch content together through integrated social platforms.
- A smaller segment, about 9%, indicates that none of these factors significantly influences their decision to remain subscribed.
(Source: Exploding Topics)
Trends Shaping the Future of Media Streaming
- Short-form video continues to gain strong momentum, with platforms such as TikTok and YouTube Shorts driving rapid consumption growth. TikTok has expanded to over 1 billion users globally, while YouTube Shorts has recorded nearly a 30% increase in user engagement, highlighting rising demand for quick, snackable content.
- Live streaming is seeing wider adoption as audiences seek real-time interaction, especially in gaming and influencer-led content. Twitch has reported notable growth in non-gaming live streams, and Facebook Live videos generate almost 2× the engagement of standard social media posts.
- Connected TV usage is accelerating, positioning smart TVs as a key streaming device. YouTube has reported a 20% increase in watch time on connected TV screens, with longer-form, professionally produced content performing particularly well in living room viewing environments.
- E-commerce integration is transforming streaming into a transactional channel, as platforms like Amazon Live and Instagram Shopping enable users to purchase products directly through live streams and video content, blending entertainment with instant buying.
- Augmented reality and virtual reality features are increasingly embedded into streaming platforms, especially on Snapchat and Instagram. AR filters and immersive VR experiences are enhancing interactivity and engagement by allowing users to participate more deeply in content creation and consumption.
(Source: VdoCipher, Statista)
Monthly Evolution of TV Viewing Share by Platform
- Streaming steadily strengthened its position throughout the period, rising from 38.8% in May 2024 to 44.8% by May 2025, confirming its growing dominance in total TV consumption.
- Cable viewing showed a gradual decline, from 28.2% in May 2024 to 24.1% in May 2025, reflecting continued audience migration to streaming platforms.
- Broadcast television experienced a consistent erosion in share, decreasing from 22.3% in May 2024 to 20.1% by May 2025, despite short-term stability in select months.
- The “other” category, which includes alternative and niche viewing options, remained relatively stable overall, fluctuating between 9.2% and 12.1% across the period.
- Streaming gains were most pronounced toward the end of 2024 and into early 2025, with shares exceeding 43% from December 2024 onward.
- By early 2025, streaming clearly outpaced the combined growth rates of cable and broadcast, reinforcing its role as the primary driver of change in TV viewing behaviour.
(Source: The Nielsen Company LLC)
Conclusion
Media streaming statistics clearly show that streaming has become a central part of how people consume digital media, spanning video, music, and live content. Viewing patterns point to a strong preference for flexible, on-demand, and live experiences, supported by widespread internet access, mobile device penetration, and personalised platform features. High daily usage levels and broad household adoption confirm streaming’s position as the dominant channel for modern entertainment.
At the same time, the data reveals important shifts in how users pay for and interact with streaming services. The rise of ad-supported tiers, higher monthly spending, and higher subscription cancellation rates reflects a more price-sensitive and selective audience.
Together, these trends indicate a mature but evolving market, where long-term growth is increasingly tied to content quality, innovative live formats, balanced pricing models, and sustained user engagement.
FAQ’s
Media streaming statistics refer to quantitative insights that track how audiences access and interact with digital content on streaming platforms. These metrics include usage frequency, watch time, subscription behaviour, device preferences, live-streaming engagement, and consumer spending across video, music, and social media streaming services.
These statistics provide valuable guidance for businesses, creators, advertisers, and regulators by revealing viewing habits, demand patterns, and revenue models. They help inform strategic decisions on content production, pricing structures, advertising placement, and long-term platform growth.
Streaming accounts for a substantial share of overall media consumption, representing more than one-third of total television viewing. This highlights the ongoing transition from traditional cable and broadcast formats to digital and on-demand platforms.
The market is led by major global players such as Netflix, YouTube, Amazon Prime Video, Twitch, and Facebook-affiliated streaming services. In addition, region-specific platforms, particularly those operated by large Chinese technology firms, contribute significantly to global streaming volumes.
Media streaming data shows that live content generates deeper viewer engagement, with audiences spending considerably more time on live streams than on on-demand videos. Regular weekly viewing is common, especially for live gaming, music performances, and real-time events.