
Introduction
Robotics Statistics: Robotics is reshaping global industries as advancements in automation, artificial intelligence, machine vision, and collaborative systems accelerate adoption across manufacturing, healthcare, logistics, agriculture, and home environments. The latest robotics statistics indicate strong growth in industrial deployments, rising use of service robots, and expanding AI-driven autonomous solutions.
Government support for smart manufacturing, workforce efficiency, and safety, combined with declining sensor costs and improved computing power, continues to make robotics more accessible. Together, these factors position robotics as a key driver of innovation, productivity, and long-term economic competitiveness.
Editor’s Choice
- 3.4 million industrial robots are operating worldwide.
- The global manufacturing industry has a robot-to-human ratio of 1:71.
- Industrial businesses plan to spend 25% of their capital in automation over the next 5 years.
- About 14% of workers have lost their jobs due to robots, and automated systems are expected to account for 25% of capital spending from 2023–2028.
- In Q3 2024, unit growth reached 14.1%, outpacing revenue growth.
- Automotive component orders increased by 61%, while automotive OEM orders declined by 15%.
- From January to September 2024, North America recorded 23,034 robot orders worth USD 1.45 billion, down 1.9% in units and 2.2% in revenue.
- In 2024, North American demand reached 31,311 robots with USD 1.96 billion in revenue, reflecting increases of 0.5% in units and 0.1% in revenue.
- Between July and September 2024, companies purchased 7,329 robots worth USD 475 million.
(Source: Association for Advancing Automation, McKinsey, StudioRed.com)
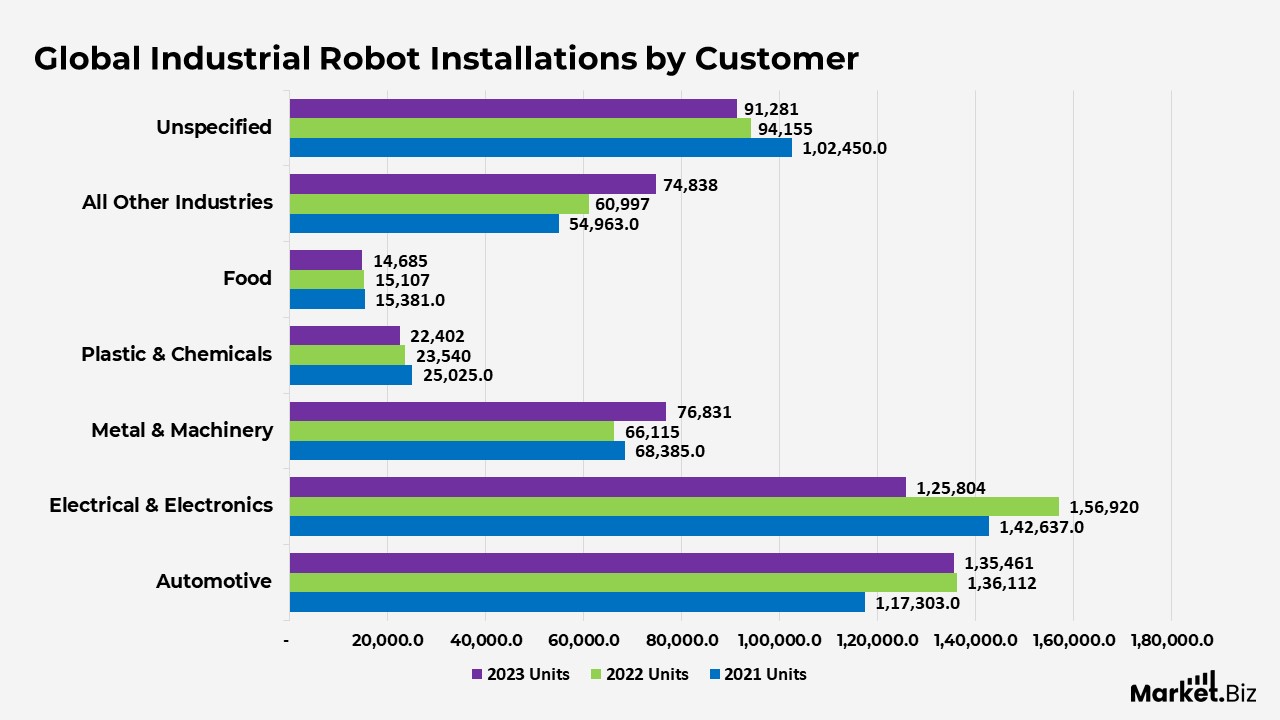
Global Industrial Robot Installations by Customer
- Automotive remained the leading adopter, reaching 135,461 units in 2023, maintaining stability after 136,112 units in 2022 and 117,303 units in 2021.
- Electrical and electronics recorded strong activity of 125,804 units in 2023, following peaks of 156,920 units in 2022 and 142,637 units in 2021.
- Metal and machinery installations increased to 76,831 units in 2023, up from 66,115 units in 2022 and nearly aligned with 68,385 units in 2021.
- Plastic and chemical products saw moderate adoption of 22,402 units in 2023, compared with 23,540 units in 2022 and 25,025 units in 2021.
- Food sector installations reached 14,685 units in 2023, nearly on par with 15,107 units in 2022 and 15,381 units in 2021.
- All other industries posted 74,838 units in 2023, reflecting continued growth from 60,997 units in 2022 and 54,963 units in 2021.
- Unspecified categories remained significant at 91,281 units in 2023, compared with 94,155 units in 2022 and 102,450 units in 2021.
(Source: International Federation of Robotics, World Robots)
Robotics Expansion Trends
- Global operational industrial robots reached 4.28 million units by the end of 2023.
- Annual industrial robot installations climbed to 541,302 units in 2023.
- Asia contributed 70% of all new robot installations worldwide.
- Global robot density increased from 74 to 162 robots per 10,000 manufacturing workers between 2016 and 2023.
- South Korea leads the world with a density of 1,012 robots per 10,000 workers.
- U.S. professional service robot deployment totalled 158,000 units, up 48% year over year.
- In ASEAN (2018–2022), robots generated 2 million able jobs but displaced 1.4 million low-skilled positions.
- In China, 14% of workers were displaced by robotics.
- Each robot in the U.S. may replace up to 6.2 workers, while the figure for Europe is 3.4.
- MIT research shows that adding one robot per 1,000 workers reduces employment by 0.2 percentage points and wages by 0.42%.
- Manufacturing job loss averages 3.3 positions per new robot.
- U.S. robot adoption rose from 0.8 to 1.8 robots per 1,000 workers between 2009 and 2017, with the Midwest at 3.17.
- A total of 41 robot-related fatalities were recorded in the U.S. between 1992 and 2017.
- Blunt-force injuries in robotics incidents included 56% from pinching and 44% from impact, contributing to 61 deaths between 1992 and 2015.
Moreover
- Construction robot adoption reached 55% among firms in the U.S., EU, and China.
- Collaborative robots in construction can raise productivity by up to 22%.
- Universal Robots captured 40–50% of the global cobot market in 2022.
- Australian employees stand to save 245 hours annually through robotics, with 91% believing it improves workplaces.
- Walmart reports that robots may extend warehouse careers by up to 10 years by reducing physical strain.
- Amazon’s “Proteus” cobot usages visual-based navigation to interact safely with human workers.
- UBS forecasts 2 million humanoid robots by 2035 and 300 million by 2050, potentially creating a USD 1.7 trillion market.
- The robotics industry is urging the U.S. to adopt a national robotics strategy that includes incentives and workforce training.
- U.S. tariffs and dependency on Chinese supply chains are slowing domestic robotic investment.
- Surveys show that 75% of U.S. employees fear automation may render their jobs obsolete, while 65% worry about being directly replaced by bots.
- About 90% of workers using AI in 2024 say it saves time, and programmers complete 126% more projects using AI tools.
- The worldwide robotic unit count reached 12 million, with North American businesses alone purchasing 31,044 units.
- Collaborative robots (cobots) are expected to represent 34% of all robot sales by 2025.
- Robotics adoption in North America expanded by 3.5% in 2021.
- Global robot shipments increased by 12% between 2020 and 2022.
Further
- China’s industrial robot production has been rising steadily at a 29.2% annual rate.
- Amazon’s deployment of cobots generated operational savings of $22 million.
- Beyond automotive, robotic orders across electrical, photonics, and semiconductor industries were projected to rise 11% by the end of 2021.
- The global robotics sector currently employs more than 150,000 skilled professionals in engineering and assembly roles.
- Approximately 88% of companies worldwide plan to adopt robotics across their IT infrastructure.
- Around 584,000 robotic units were scheduled for shipment in 2022.
- Industry projections indicate at least 15% growth by 2028, pushing total market value toward $20 billion.
- The automotive sector reached a density of 1,287 robots per 10,000 workers by 2021.
- More than 3.05 million industrial robots were installed across global industries in the previous year.
- Shipment volumes rose from 465,000 units in 2020 to 584,000 units in 2022, representing a 12% rise.
- By 2028, the robotics industry’s estimated valuation is expected to approach $20 billion.
- In healthcare, Veebot robotics systems demonstrate 83% accuracy in identifying optimal veins for blood draws.
(Source: AIPRM, The Australian, Business Insider, The Times, The Guardian, Apollo Technical LLC, Enterprise Engineering Solutions)
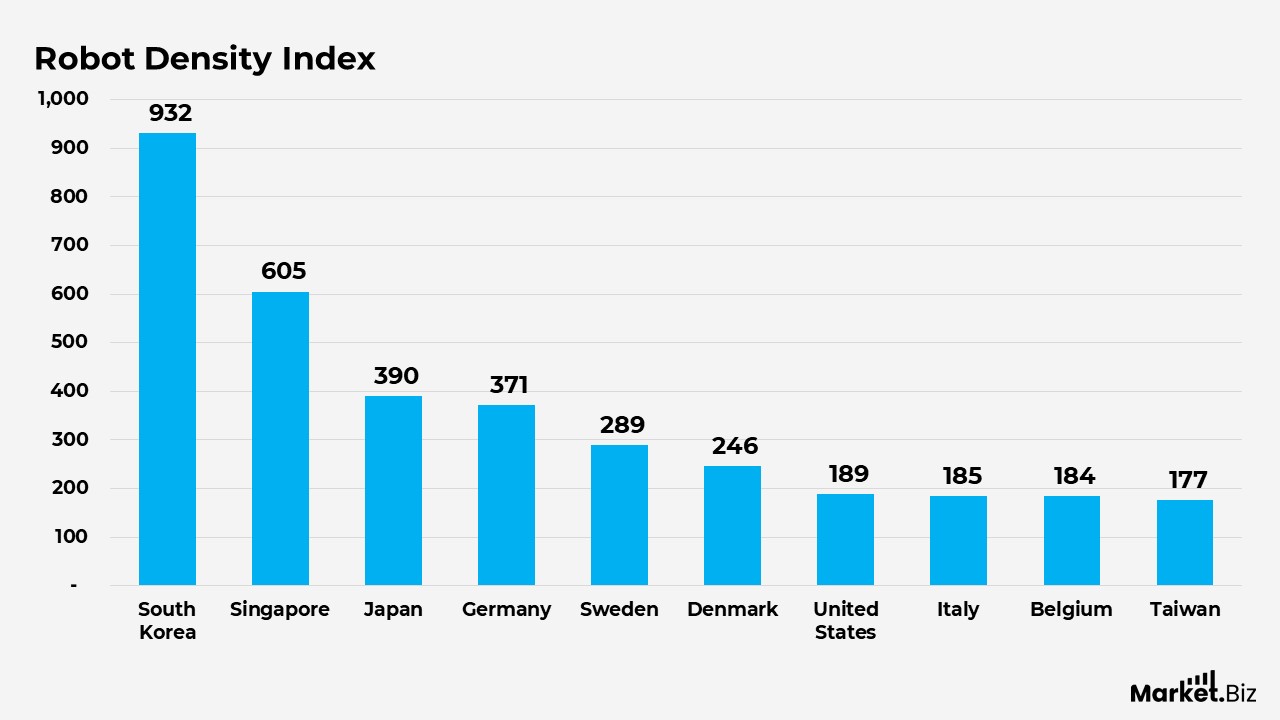
Robot Density Index
- South Korea leads global automation with 932 robots per 10,000 employees, the highest density worldwide.
- Singapore follows with 605 robots per 10,000 workers, reflecting extensive adoption across its advanced manufacturing base.
- Japan ranks third, operating 390 robots per 10,000 employees, supported by its strong robotics and automotive sectors.
- Germany holds fourth place with 371 units per 10,000 workers, driven by its automotive and precision engineering industries.
- Sweden reaches 289 robots per 10,000 employees, demonstrating steady investment in automated production systems.
- Denmark records 246 robots per 10,000 workers, showing growing uptake in electronics and industrial equipment manufacturing.
- The United States operates 189 robots per 10,000 employees, reflecting rising automation across automotive and logistics segments.
- Italy posts 185 robots per 10,000 workers, supported by robotics use in the automotive and metalworking industries.
- Belgium maintains 184 robots per 10,000 employees, indicating strong automation penetration in niche manufacturing.
- Taiwan rounds out the top ten with 177 robotsper 10,000 workers, driven by its strength in electronics and semiconductor manufacturing.
(Source: ifr.org, Assun Motors Pte Ltd., plantautomation-technology.com)
Interesting Robotics Facts from the World’s Top Automated Countries
- South Korea has maintained the top global ranking since 2010, with robot density increasing around 10% annually since 2015, placing it far above the global average.
- Singapore’s rapid automation growth of roughly 27% per year since 2015 has enabled it to surpass major industrial nations such as Japan and the US.
- European leaders such as Denmark and Italy exhibit notably high levels of automation, reflecting the maturity and modernization of their manufacturing sectors.
- The United States recorded strong momentum, with robot sales expanding by 15% or more each year from 2017 to 2020.
- Taiwan’s robotics surge has been driven primarily by workforce shortages rather than global competitive pressure, accelerating automation adoption.
(Source: ifr.org, Assun Motors Pte Ltd., plantautomation-technology.com)
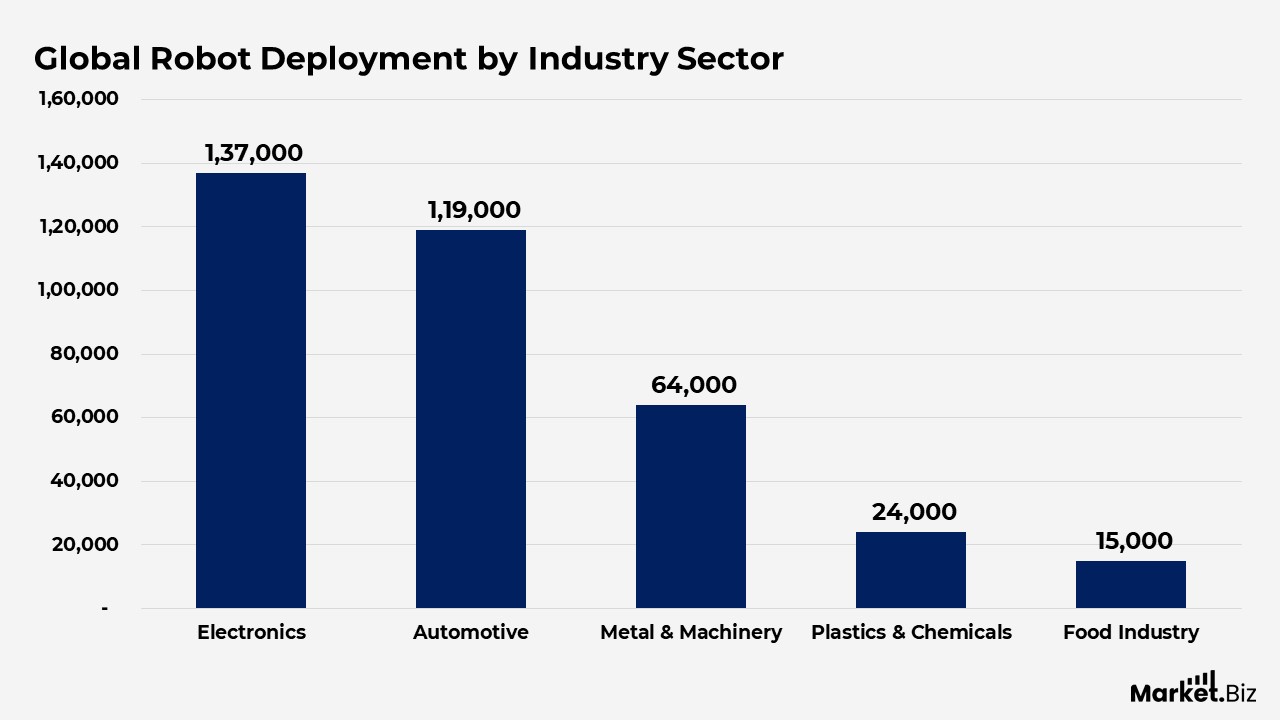
Global Robot Deployment by Industry Sector
- The electronics sector leads worldwide automation with 137,000 robot installations, reflecting its high-volume production and precision requirements.
- Automotive manufacturing follows with 119,000 installations, supported by expanding EV production and advanced assembly operations.
- The metal and machinery industries deployed 64,000 robots globally, strengthening efficiency in fabrication, welding, and heavy engineering.
- Plastic and chemical sectors accounted for 24,000 installations, driven by growing demand for consistency and safety in material processing.
- The food industry deployed 15,000 robots, reflecting steady adoption in packaging, sorting, and hygiene-critical processes.
(Source: robotiq.com, Assun Motors Pte Ltd.)
The Rise of Intelligent Machines
- The robotics sector supported employment for over 2.7 million people globally in 2023.
- Industrial robot arm prices have dropped by more than 50% over the past decade, widening accessibility for manufacturers.
- Nearly 80% of new industrial robot purchases now consist of collaborative robots (cobots).
- The automotive sector remains the dominant adopter, representing 35% of worldwide robot installations.
- Manufacturing robot density reached 246 robots per 10,000 employees in 2023.
- Warehouse adoption of Autonomous Mobile Robots (AMRs) surged 60% between 2020 and 2022.
- Around 60% of industrial companies incorporate robotics into their digital transformation initiatives, while 75% report significant efficiency improvements.
- AI-enhanced robots contributed to improved workplace safety, reducing industrial accidents by up to 25%.
- By 2025, the deployment of service robots worldwide is projected to exceed 16 million, with 57% featuring AI capabilities.
- AI service robots across sectors such as retail, healthcare, and hospitality are generating substantial financial gains, including $3.6 billion in retail and 4.3 million eldercare robot units in use.
- Global robot operations totalled 36.83 million units in 2024, of which 98.9% were service robots.
- Worldwide robot usage is forecast to reach 61.75 million units by 2029, marking rapid expansion across industries.
(Source: Assun Motors Pte Ltd.)
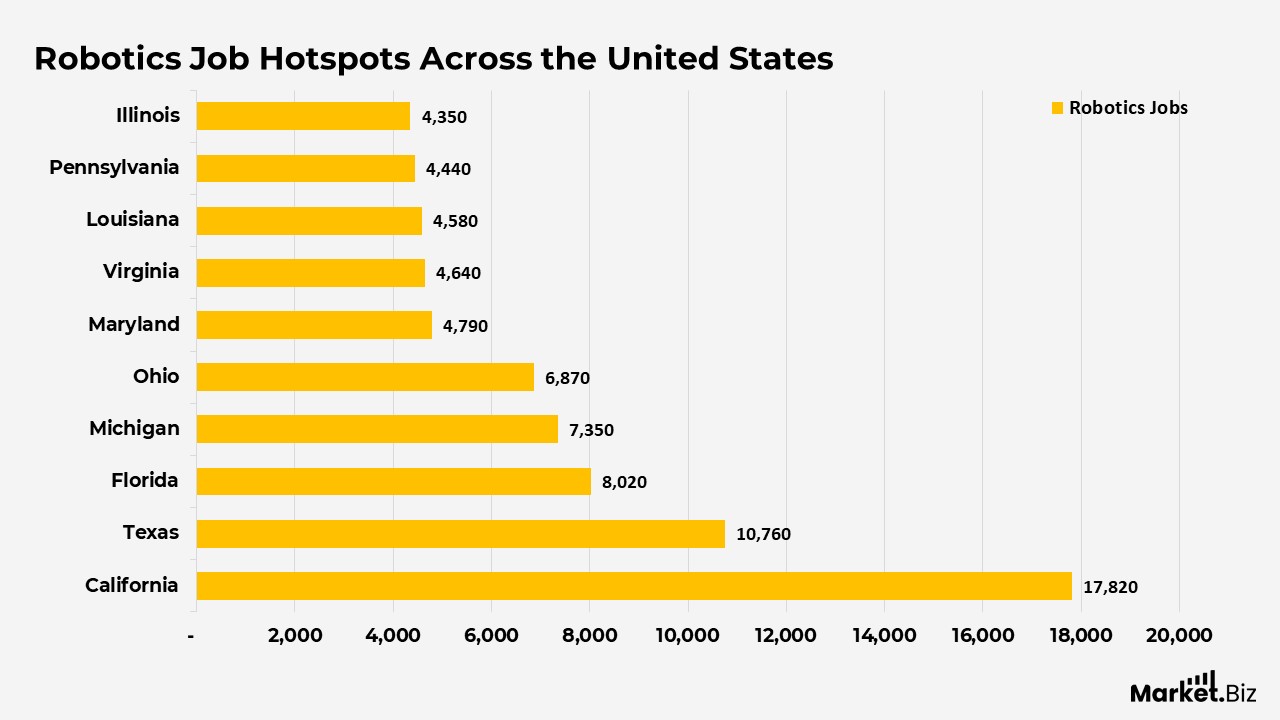
Robotics Job Hotspots Across the United States
- California hosts the nation’s largest robotics workforce with 17,820 jobs, driven by tech hubs, automation startups, and advanced manufacturing.
- Texas follows with 10,760 positions, supported by strong activity in energy, aerospace, and logistics automation.
- Florida records 8,020 robotics jobs, reflecting growth across warehousing, defense tech, and service robotics.
- Michigan employs 7,350 robotics professionals, anchored by its automotive and mobility innovation sector.
- Ohio reports 6,870 roles, supported by manufacturing automation and industrial robotics adoption.
- Maryland has 4,790 robotics jobs, driven by research institutions and defense-related automation.
- Virginia counts 4,640 positions, supported by federal agencies, tech firms, and robotics integrators.
- Louisiana lists 4,580 robotics roles, influenced by energy-sector automation and industrial modernization.
- Pennsylvania employs 4,440 robotics workers, with strengths in manufacturing, logistics, and healthcare automation.
- Illinois rounds out the top ten with 4,350 robotics jobs, shaped by industrial automation and advanced manufacturing hubs.
(Source: Statista, Evoca.tv)
How Nations Rank in Manufacturing Robotics Adoption
- South Korea leads global manufacturing automation with 1,012 robots per 10,000 employees, far surpassing the world average.
- Singapore follows with an impressive 770 robots per 10,000 workers, reflecting the rapid adoption of advanced manufacturing technologies.
- China reports a density of 470, showcasing its aggressive automation strategy to support large-scale production.
- Germany records 429 robots per 10,000 employees, solidifying its status as Europe’s most automated manufacturing economy.
- Japan maintains 419 robots per 10,000 workers, supported by its longstanding strength in robotics and automotive manufacturing.
- Sweden reaches 347, indicating steady growth in industrial automation.
- Denmark lists 306, continuing its upward trajectory in smart manufacturing.
- Slovenia records 302, demonstrating rising investment in industrial robotics.
- Switzerland reports 295, driven by precision engineering and high-tech manufacturing.
- The United States registers 294 robots per 10,000 employees, showing consistent adoption across industries.
- Chinese Taipei has 264, supported by semiconductor and electronics production.
- The Netherlands posts 245, reflecting modernization in the machinery and logistics sectors.
- Austria stands at 228, while Italy follows closely with 225, both driven by strong manufacturing ecosystems.
- Canada reaches 207, marking steady integration of automation in its industrial base.
- Belgium records 201, continuing to adopt robotics in niche manufacturing sectors.
- The Czech Republic lists 186, supported by automotive and heavy manufacturing.
- France ranks 174th, reflecting gradual growth in automation.
- Spain posts 173, while Finland matches it closely, completing the ranking.
(Source: International Federation of Robotics, World Robots)
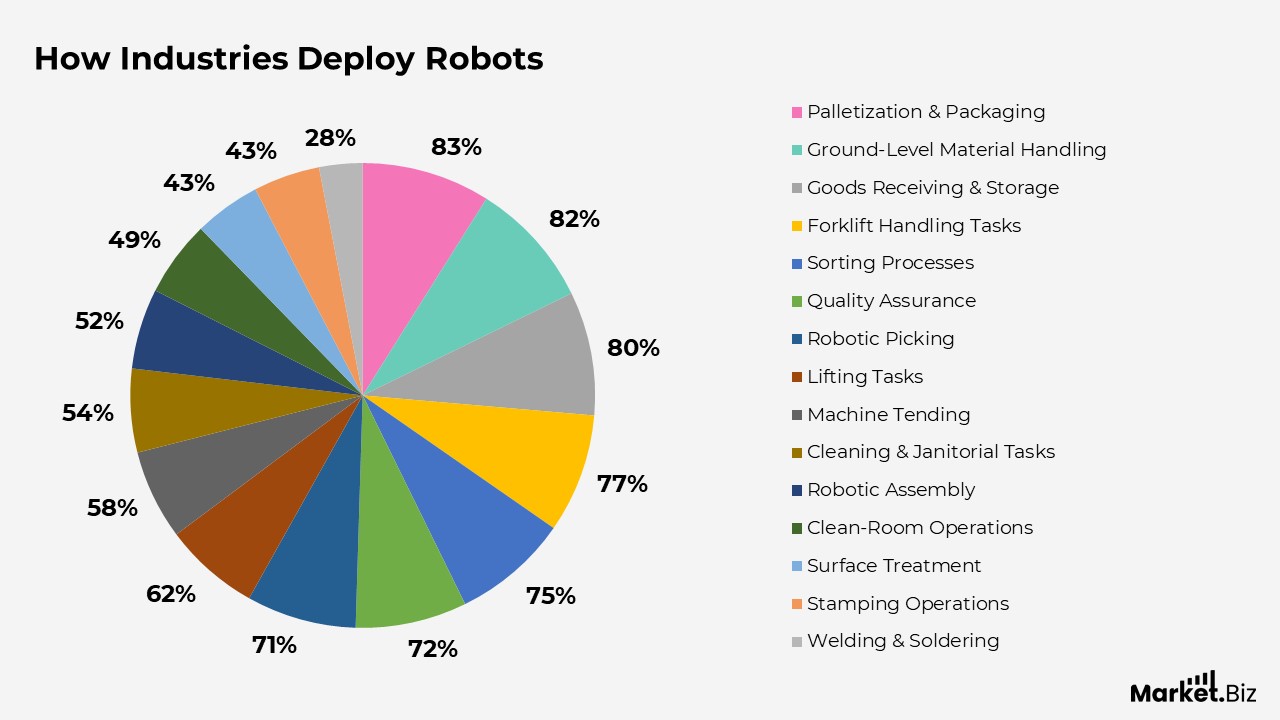
How Industries Deploy Robots
- Robotics adoption in palletization and packaging reaches 83%, reflecting strong uptake across logistics and manufacturing operations.
- Ground-level material handling has an 82% adoption rate as warehouses increasingly automate repetitive movement tasks.
- Goods receiving and storage automation stands at 80%, enabling faster, more accurate supply-chain workflows.
- Forklift-related handling tasks achieve 77% adoption as companies shift to safer, automated mobility systems.
- Sorting processes have achieved 75% adoption, driven by e-commerce and high-volume fulfilment centres.
- Quality assurance automation reaches 72%, enhancing consistency in manufacturing environments.
- Robotic picking tasks achieve 71% adoption, optimizing retail and fulfilment operations.
- Lifting tasks show 62% adoption due to rising demand for workplace safety and ergonomic support.
- Machine tending automation stands at 58%, enabling continuous production in manufacturing settings.
- Cleaning and janitorial robotics reach 54%, supporting facilities management and hygiene requirements.
- Robotic assembly adoption reaches 52% as manufacturers integrate smarter production lines.
- Clean-room applications see 49% adoption across pharmaceuticals and semiconductors.
- Surface treatment tasks have an adoption rate of 43%, improving consistency in industrial manufacturing.
- Stamping operations record 43% adoption as heavy-industry automation expands.
- Welding and soldering automation stands at 28%, reflecting steady yet emerging adoption across industrial fabrication.
(Source: McKinsey Global International Robotics Survey, StudioRed.com )
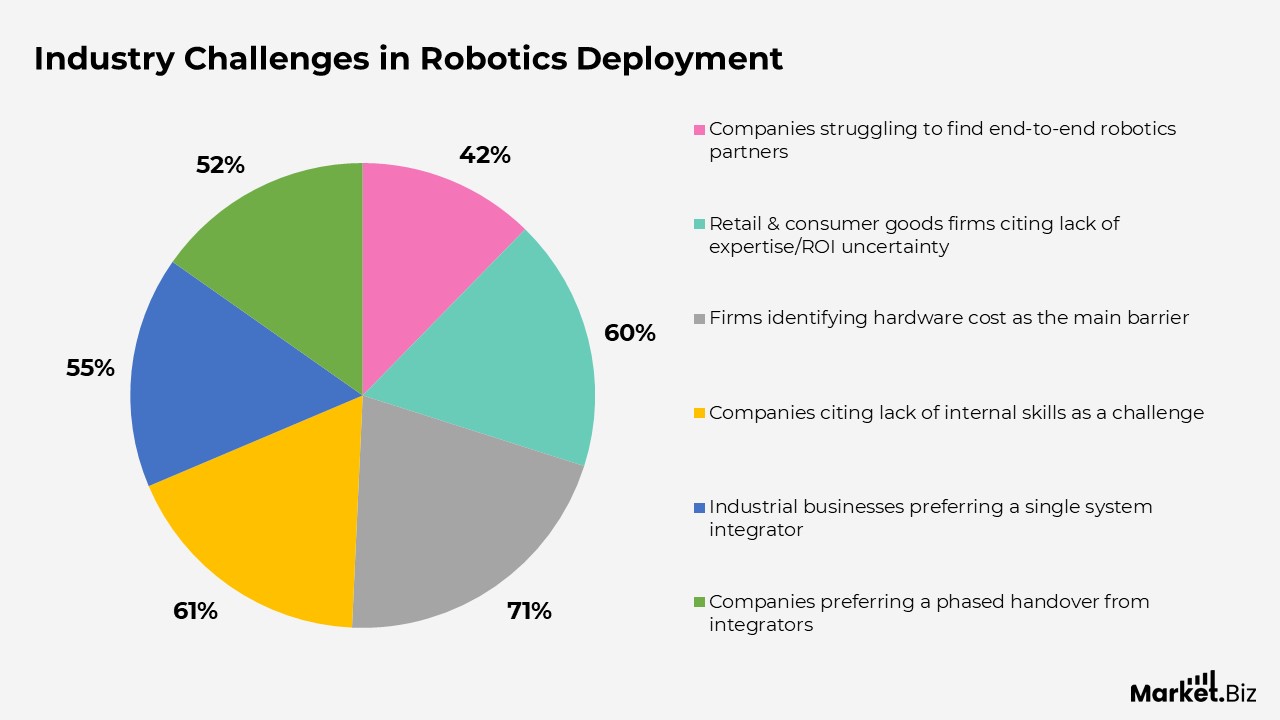
Industry Challenges in Robotics Deployment
- About 42% of companies report difficulty finding robotics partners capable of delivering consistent, end-to-end solutions across multiple regions.
- In retail and consumer goods, nearly 60% of organizations identify limited in-house expertise and uncertainty around ROI as major barriers to adopting robotics.
- Roughly 71% of firms view hardware costs as the top hurdle in robotics deployment, while 61% cite a shortage of internal skills needed to manage automation.
- Around 55% of industrial businesses prefer working with system integrators who can serve as a single point of contact for both hardware and software upkeep.
- Nearly 52% of companies favor a gradual transition model in which integrators progressively transfer operational responsibilities to internal teams.
(Source: McKinsey, StudioRed.com)
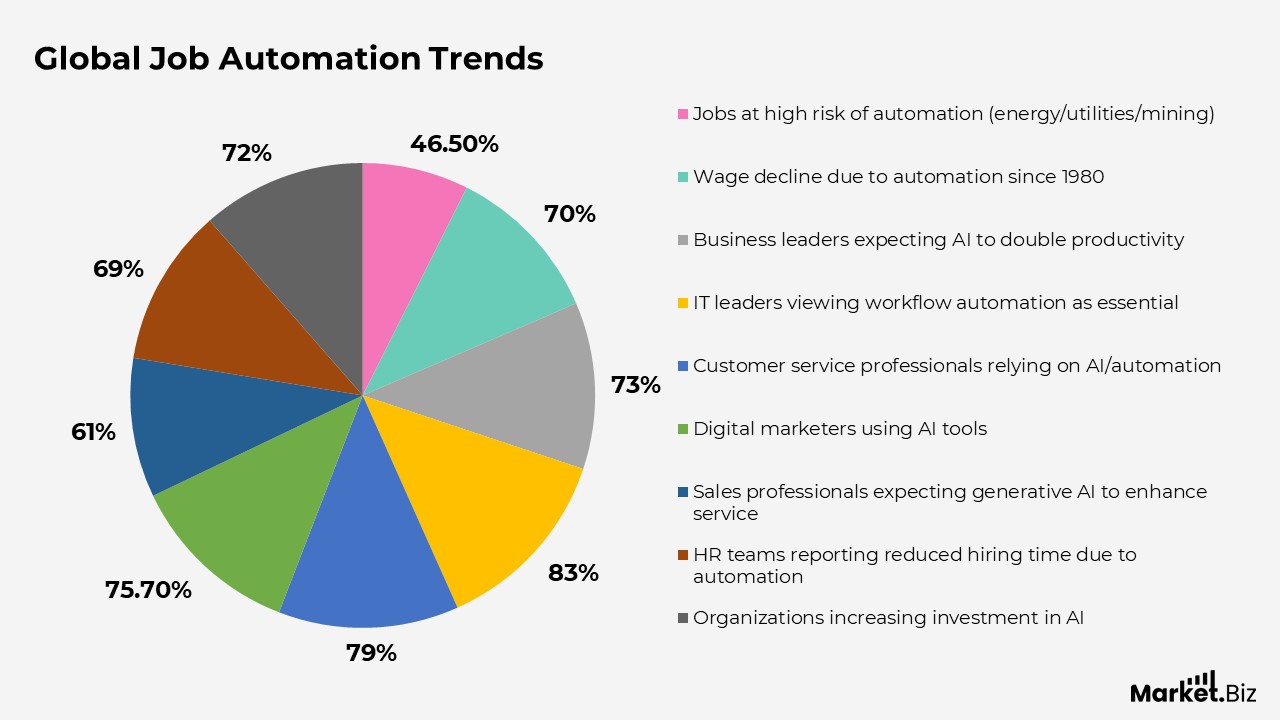
Global Job Automation Trends
- By 2030, an estimated 46.5% of jobs in North America’s energy, utilities, and mining industries are at high risk of automation, signaling major workforce restructuring.
- Automation technologies could affect up to 41 million retail jobs by 2040, particularly impacting roles such as cashiers, stock clerks, and service staff.
- Wage declines of up to 70% have been observed in some industries since 1980 due to the rise of AI and automation, especially in repetitive, labor-intensive sectors.
- Since 2000, automation has replaced approximately 1.7 million jobs in the manufacturing industry through increased deployment of robotics and AI systems.
- Around 73% of business leaders believe that AI will at least double employee productivity by 2035, highlighting expectations for significant workflow transformation.
- Nearly 83% of IT leaders view workflow automation as essential to achieving successful digital transformation within their organizations.
- About 79% of customer service professionals consider AI and automation critical to improving service delivery and operational efficiency.
- Around 75.7% of digital marketers actively use AI tools to boost campaign performance, personalize content, and strengthen data-driven decision-making.
- Roughly 61% of sales professionals believe generative AI will enhance their capacity to meet customer needs and improve service quality.
- Among HR teams using hiring automation, 69% report substantial reductions in time spent on recruitment processes.
- Around 72% of organizations intend to increase investment in AI technologies to strengthen operational capabilities and strategic decision-making.
(Source: Statista, Edoxi, Forbes, Leftronic, AMS, Kissflow, HubSpot, Harpa AI Technologies, Salesforce, Keymakr, Big Data Wire, Genius)
Conclusion
Robotics Statistics: Robotics is no longer an emerging trend but a defining force reshaping global industries and workplace dynamics. Growing adoption across manufacturing, logistics, healthcare, retail, and service environments reflects a strong push toward smarter, faster, and more reliable operations.
With robot density rising worldwide and AI-powered systems enhancing accuracy and decision-making, automation is expanding its role in modern business ecosystems.
The data also underscores meaningful shifts in the labour market, as automation transforms job structures and creates demand for higher-skilled technical roles. Companies increasingly view robotics as essential for tackling labor shortages, improving safety, and accelerating digital transformation initiatives. With costs declining and capabilities advancing, global robot deployment is expected to surge in the coming years.
Moreover, robotics is driving a new era of industrial and service innovation—reshaping productivity, redefining workforce expectations, and paving the way for a more automated and intelligent world.
FAQ’s
Robotics statistics provide measurable insights into how automation is advancing across sectors. They show the speed at which machines are assuming repetitive, hazardous, or high-precision tasks and highlight the broader transition toward autonomous and AI-enhanced systems.
Robot density, defined as the number of robots per 10,000 employees, is widely used to assess the technological sophistication of a nation’s manufacturing sector. Higher density reflects deeper automation integration, greater productivity potential, and stronger alignment with Industry 4.0 standards.
The data reveals a dual impact: some roles are being displaced as automation expands, while demand grows for specialized skills in robotics programming, system maintenance, AI management, and integration. This shift highlights the rising need for continuous skill development and workforce adaptation.
Countries that embrace automation more rapidly tend to achieve higher operational efficiency, lower production costs, and improved scalability. As a result, robotics adoption statistics serve as a benchmark for evaluating a nation’s readiness and competitive strength in a technology-driven global economy.
Cobots represent a transformative shift in automation, as they are designed to work safely alongside human operators. Their growing presence in sales data reflects a movement toward more flexible, adaptive, and human-collaborative automation environments, rather than traditional isolated robotic systems.