
Introduction
Mobile marketing statistics offer a concise, data-backed lens for understanding how consumers engage with brands through smartphones and other mobile devices, as mobile usage becomes the dominant digital access point. These statistics reflect shifts in user behaviour, engagement intensity, and performance outcomes across mobile apps, browsers, messaging platforms, and location-based interactions, highlighting mobile’s transition from a secondary channel to a core driver of digital engagement.
By tracking indicators such as mobile internet adoption, time spent on mobile platforms, responsiveness to mobile ads, notifications, and personalized content, businesses can evaluate the effectiveness of mobile-first strategies with greater precision. This unified statistical perspective enables organizations to identify high-impact channels, optimize campaign design, and align technology investments with actual consumer behavior, making mobile marketing statistics a critical reference point for strategic planning, competitive assessment, and long-term digital growth.
Editor’s Choice
- As of early 2023, around 7.33 billion people worldwide used mobile phones, representing 90.93% of the global population.
- The total number of mobile devices is projected to surpass 18 billion by 2025, reflecting rapid multi-device adoption.
- Smartphone ownership is nearly universal among internet users, with over 97.04% owning a smartphone.
- Mobile devices account for the majority of global internet traffic, with 57.08% of total traffic.
- Android users alone spent more than 4.1 trillion hours on mobile phones during 2022, underscoring deep engagement.
- Average daily mobile usage reached 4 hours 6 minutes per user in 2023, with even higher usage levels observed in Indonesia, Brazil, Saudi Arabia, Singapore, and South Korea.
- Mobile marketing effectively reaches core working-age demographics, as 9 out of 10 millennials and Gen X consumers own smartphones.
- In professional environments, 80% of B2B buyers rely on mobile phones at work, influencing purchasing workflows.
- B2B mobile marketing strategies have altered purchase behavior for nearly 60% of buyers.
- Globally, there are more than 5.20 billion unique mobile internet users, highlighting mobile’s role as a primary access channel.
Further
- Nearly 50% of consumers begin product searches directly from their smartphones.
- Email engagement is increasingly mobile-first, with over 46% of emails opened on smartphones.
- Mobile advertising is gaining budget priority, with 51% of total ad spending allocated to mobile by 2022.
- Location-based strategies are widely adopted, with 84% of marketers using location-driven mobile marketing techniques.
- Consumers spend approximately 85% of their time on smartphones in mobile applications rather than in browsers.
- In-app messaging delivers strong performance, increasing user retention by 4x compared to standard outreach.
- SMS remains highly effective, with 90% of messages opened within 3 minutes of receipt.
- Relevance drives action, as 91% of smartphone users report making or planning a purchase after seeing timely mobile ads.
- Mobile advertising is expected to dominate digital spend, accounting for 69.61% of global ad revenue by 2028.
- Despite app growth, 50% of consumers still prefer browsing a company’s mobile website instead of installing an app.
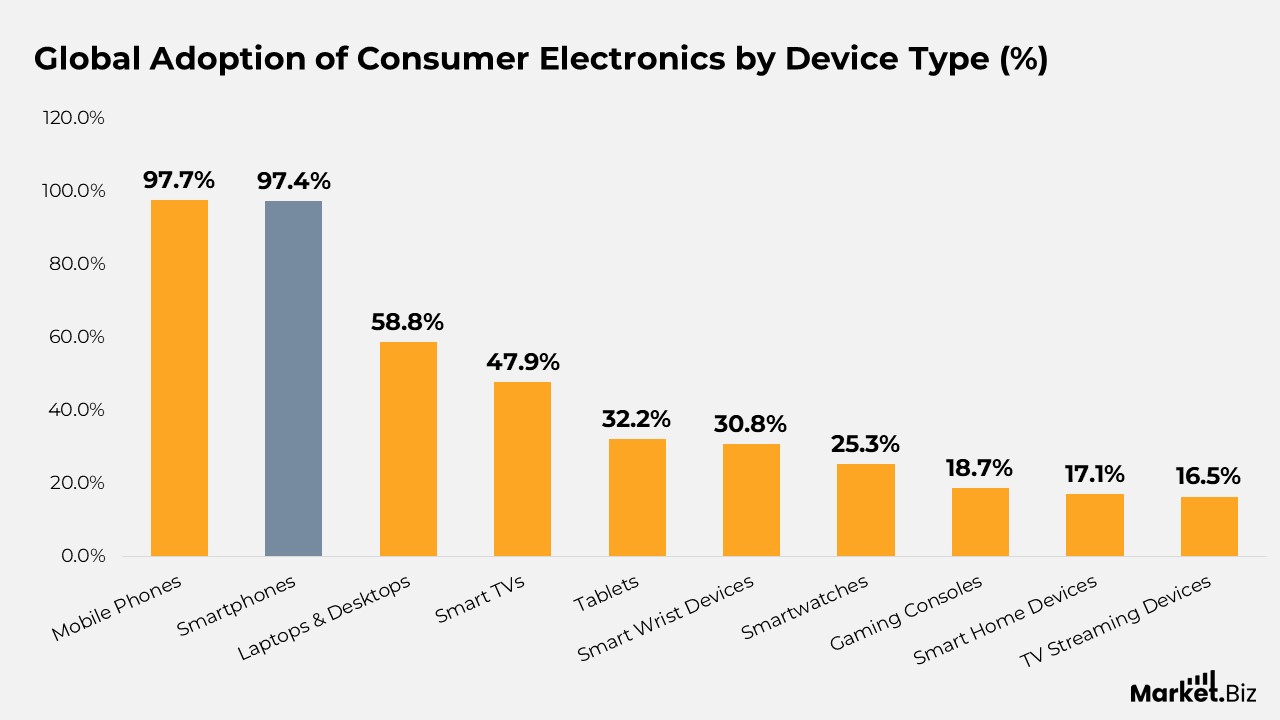
Global Adoption of Consumer Electronics by Device Type
- Mobile phones remain the most widely used electronic devices globally, with 97.7% of users owning at least one.
- Smartphones closely follow overall mobile phone usage, with a penetration rate of 97.4%, reinforcing their role as the primary digital device.
- Laptops and desktop computers remain relevant, with 58.8% of users relying on them for work, education, and productivity.
- Smart TVs have achieved substantial household penetration, with 47.9% of users accessing digital content through connected television platforms.
- Tablet devices are used by 32.2% of the global population, reflecting moderate adoption for media consumption and casual productivity.
- Smart wrist devices, including fitness bands and wearables, are owned by 30.8% of users, indicating growing interest in health and activity tracking.
- Dedicated smartwatches account for 25.3% adoption, highlighting steady growth in advanced wearable technology.
- Gaming consoles are used by 18.7% of users worldwide, supporting demand for interactive entertainment ecosystems.
- Smart home device adoption has reached 17.1%, indicating a gradual increase in connected home automation solutions.
- TV streaming devices account for 16.5% of usage, reflecting continued consumer preference for app-based and on-demand viewing experiences.
(Sources: Statista, Keywordseveryywhere)
Mobile-First Digital Adoption and Advertising Spending Trends Worldwide
- Mobile devices now account for 54% of total website traffic, surpassing desktop traffic, making mobile optimisation critical for lead generation.
- Smartphone adoption among younger users is nearly universal: 97.6% of internet users aged 16–24 own a smartphone, and 98.1% of all users access the internet via mobile phones.
- The global smartphone user base is projected to reach 5.65 billion by 2026, reflecting a 14.9% year-over-year increase and nearly fivefold growth compared to 2014.
- Mobile advertising expenditure reached a historic USD 327.1 billion in 2022, up 17.2% year over year, and is expected to reach nearly USD 399.6 billion by 2024.
- In 2024, approximately 66% of US consumers are expected to make at least one purchase on a mobile device.
- Mobile channels accounted for 48% of US B2B marketing activity in 2022 and are projected to exceed 50% penetration by the end of 2024.
- By 2028, mobile platforms are expected to account for nearly 70% of total global digital advertising spend.
- Social media advertising on mobile devices is forecast to account for USD 255.8 billion in ad spending by 2028.
- Overall, mobile advertising spend is expected to surpass USD 413 billion by 2024, while mobile retail ecommerce sales are projected to exceed USD 710 billion by 2025.
- Mobile phones remain the most widely owned consumer electronics globally, with approximately 97.7% of consumers owning a mobile device.
(Sources: Statista, Keywordseveryywhere, Hubspot Inc.)
Mobile Search, Usage, and Advertising Trends Shaping Digital Behavior
- The average mobile web search user conducted approximately 51 searches in May 2024, highlighting frequent on-the-go information-seeking behaviour.
- Global spending on mobile marketing advertising reached approximately USD 327 billion in 2022 and is projected to approach USD 400 billion by 2024.
- Nearly 40% of consumers abandon their shopping carts when apps or websites fail to deliver a mobile-friendly experience.
- The Google Play ecosystem hosts more than 3.5 million applications, reflecting intense competition for user attention.
- Mobile devices account for 55.25% of total sales when compared with desktop transactions.
- About 64% of global digital advertising budgets are currently allocated to mobile channels.
- Mobile platforms are expected to generate nearly 70% of total advertising spend by 2028.
- In the US, mobile accounted for 48% of B2B marketing activity in 2022 and is forecast to exceed 50% by the end of 2024.
- Mobile devices dominate internet access, with 98.1% of users accessing the internet on their smartphones.
Moreover
- Roughly 63% of all online searches are performed on mobile devices.
- About 91% of users check their phones for information while simultaneously performing another task.
- While shopping in physical stores, 82% of mobile users search for additional product information on their phones.
- Approximately 3 out of 10 smartphones in use globally are Apple iPhones.
- On average, smartphone users engage with 9–10 apps daily and around 30 apps each month.
- Smartphone users in the US spend an average of 2 hours and 15 minutes per day using mobile applications.
- Mobile devices account for nearly 60% of global web traffic.
- Mobile-driven social media advertising is projected to contribute around USD 255.8 billion by 2028.
- Mobile device usage extends to 66% of the global population, underscoring its universal reach.
- About 70% of all paid search impressions are delivered through mobile devices.
- Purchase intent remains strong on mobile, with 92% of users completing a related purchase after conducting a smartphone search.
(Sources: Datos, Statista; Reteno; Medium; Think with Google; Oberlo; TechCrunch; DataReportal; Mobile Marketer)
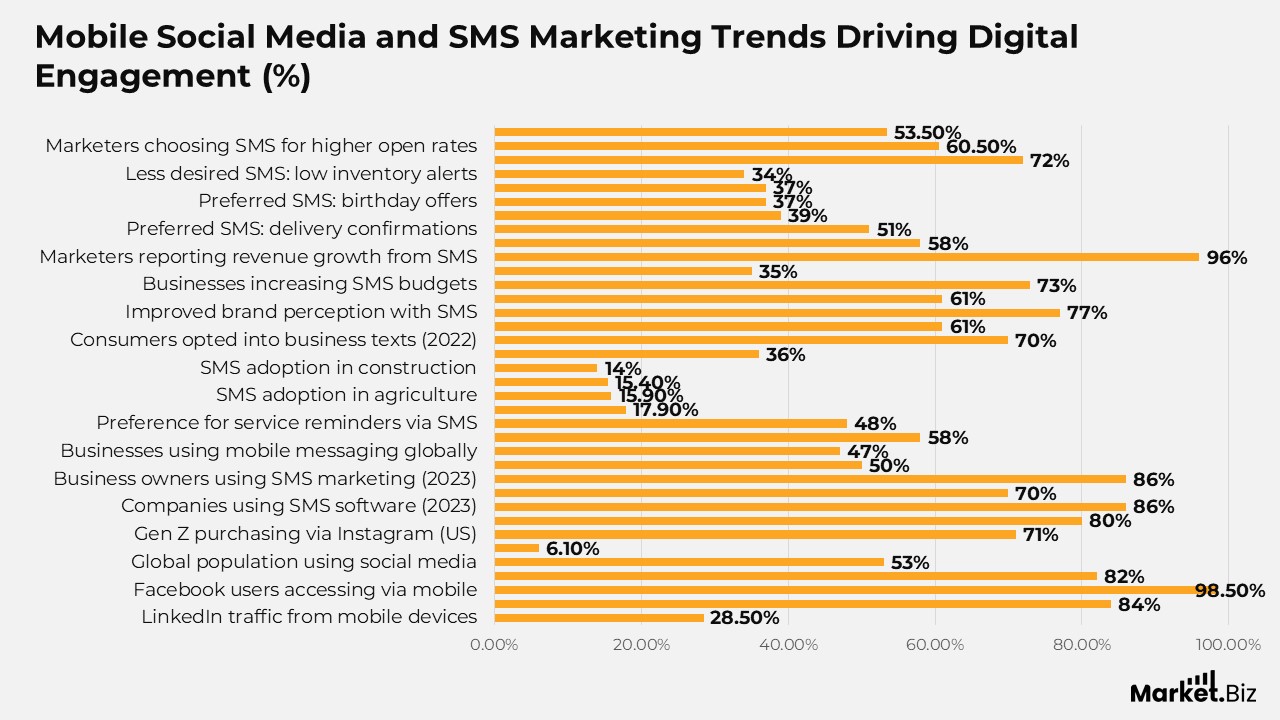
Mobile Social Media and SMS Marketing Trends Driving Digital Engagement
- Mobile devices account for 28.5% of total LinkedIn traffic, reflecting steady professional engagement on smartphones.
- Paid mobile advertising on YouTube delivers 84% greater effectiveness than traditional television advertising.
- Social media emerged as the most heavily funded mobile advertising format in 2023, signalling a shift toward app-centric campaigns.
- Facebook usage is overwhelmingly mobile-driven, with 98.5% of users accessing the platform via mobile devices.
- Pinterest also shows strong mobile dependence, as 82% of its users engage through the mobile app.
- Global social media advertising expenditure is expected to reach approximately USD 219.6 billion in 2024.
- More than 53% of the global population actively uses social media platforms.
- Total advertising spend across social media channels is projected to grow by 6.1% during 2024.
- The social media advertising ecosystem is forecasted to reach 6,054 million users by 2028.
- In the US, 71% of Gen Z users aged 18–26 are expected to make purchases directly through Instagram.
Moreover
- Instagram ranked as the most downloaded and used app worldwide in 2023, underscoring its commercial influence.
- In 2024, around 80% of companies used SMS marketing software to communicate with customers, slightly lower than 86% in 2023.
- About 70% of businesses plan to increase their SMS marketing budgets in the coming years.
- SMS marketing adoption remained strong in 2023, with 86% of business owners and marketing managers using text-based campaigns.
- More than 50% of consumers report purchasing after receiving a marketing text message.
- Across industries and company sizes, 47% of businesses globally use mobile messaging to engage customers.
- Text messaging is considered the most effective communication channel by 58% of consumers.
- Due to limited two-way messaging capabilities, 1 in 3 customer messages sent to businesses go unanswered.
- When receiving service-related communication, such as reminders, 48% of customers prefer text messages over other channels.
- Excessive messaging remains the leading reason consumers unsubscribe from SMS campaigns.
- The leading industries using SMS marketing include real estate (17.9%), agriculture (15.9%), entertainment (15.4%), and construction (14%).
Further
- Between 75% and 78% of consumers prefer texting with brands rather than speaking on the phone.
- SMS campaigns in ecommerce can achieve click-through rates of up to 36%.
- By 2022, nearly 70% of consumers opted in to receive texts from businesses such as retailers and restaurants.
- Around 61% of consumers wish businesses would allow direct text responses.
- Many businesses report SMS click-through rates of 20% to 35%.
- Offering SMS communication improves brand perception, with 77% of consumers reporting a more positive outlook.
- Promotional offers sent via SMS are redeemed 10 times more often than those sent via other coupon formats.
- Although 61% of marketers still do not use SMS, about 73% of businesses intend to increase text marketing budgets.
- Only 35% of brands currently have a formal SMS marketing campaign in place.
- Revenue growth is linked to SMS strategies, with 96% of marketers reporting positive financial impact.
- Around 58% of consumers are open to receiving brand messages several times per week.
- The most preferred SMS content includes delivery confirmations (51%), shipment updates (39%), and birthday offers (37%).
- Consumers want fewer abandoned-cart reminders (37%), fewer low-inventory alerts (34%), and more action-based messages (33%).
- Approximately 72% of consumers are willing to receive at least one brand-related text message per week.
- Marketers choose SMS primarily for performance, with 60.5% citing higher open rates and 53.5% citing stronger click-through rates.
- During Cyber Week 2023, SMS-driven campaigns generated approximately USD 1.8 billion in online sales.
(Sources: Semrush, Google, Statista, Backlinko, Social Shepherd, DataReportal; eMarketer; Business of Apps; SimpleTexting; Luisa Zhou; PwC Esendex; Business Wire; SMS Comparison; Medallia; Klaviyo; Email Audience; Textmunication; Digital Air Strike; Adobe; Mandala AI; Persuasion Nation; The Good Group; Attentive)
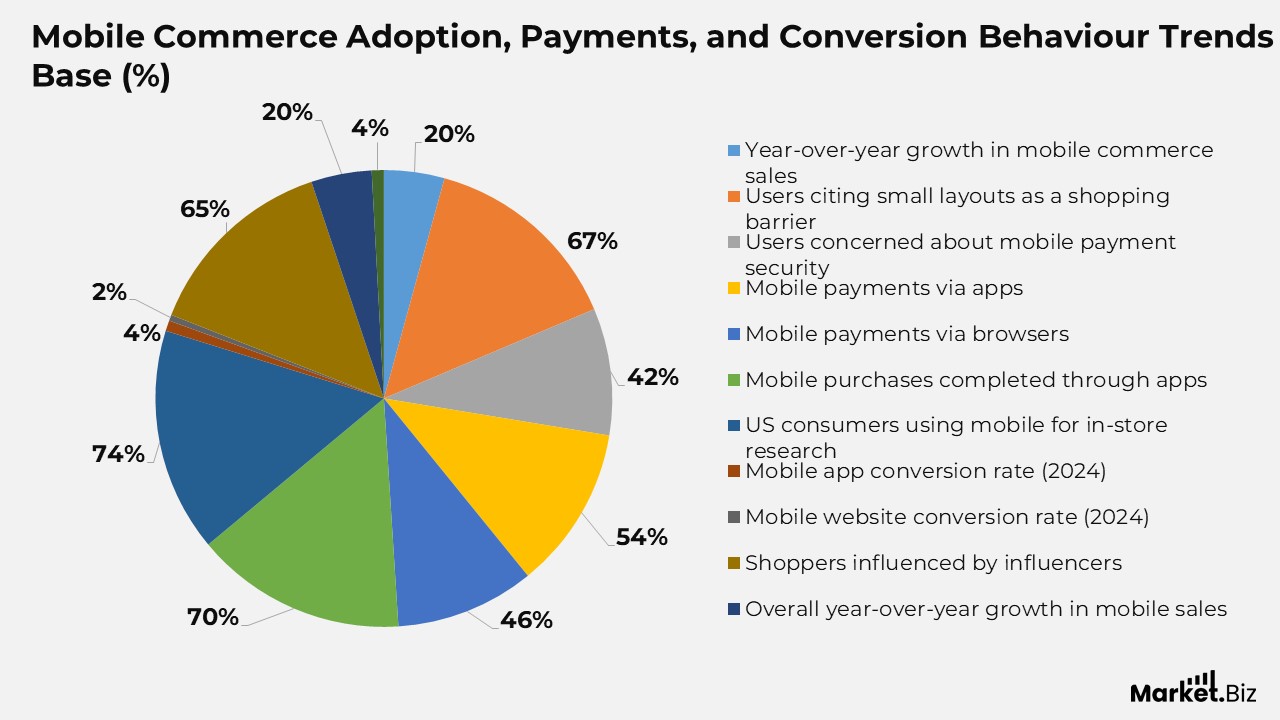
Mobile Commerce Adoption, Payments, and Conversion Behavior Trends
- Nearly 60% of smartphone users have contacted a business directly from search results, commonly using features such as click-to-call.
- A majority of shoppers value digital convenience, with 59% considering the ability to purchase online a key factor in their shopping decisions.
- Mobile commerce is projected to expand steadily, reaching close to 9% of total retail sales by 2026.
- In 2024, the average transaction value on mobile devices reached approximately USD 120, supported by the growing adoption of mobile wallets and seamless payment options.
- Mobile commerce sales recorded a consistent 20% year-over-year increase compared to 2023, reflecting rising consumer confidence in mobile shopping.
- User experience challenges persist: 67% of mobile shoppers cite small page layouts and links as barriers, while 42% express concerns about payment security and data privacy.
- Dedicated mobile commerce applications process 54% of mobile payments, compared with 46% handled through mobile browsers.
- App-based shopping continues to dominate, with 70% of mobile purchases completed through mobile apps rather than websites.
- In the US, around 74% of consumers use their mobile devices for product research while shopping in physical stores.
- Shopping apps rank as the most frequently used category on smartphones, surpassing sports, news, and finance applications.
- Mobile apps delivered a 3.5% conversion rate in 2024, significantly higher than the 2% conversion rate recorded by mobile websites.
- Social commerce continues to gain traction, with nearly 40% of mobile ecommerce purchases made directly through social media platforms in 2024.
- Influencer-driven purchasing remains strong, with approximately 65% of shoppers reporting that they buy products recommended by influencers they follow.
- Overall, mobile sales increased by 20% year over year, reinforcing the shift toward mobile-first purchasing behavior.
- Social media advertising supports conversion growth, achieving an average ecommerce conversion rate of 4% among viewers and app users who become buyers.
(Sources: Statista, Keywordseveryywhere, Hubspot Inc.)
Mobile Usage, Advertising, and Commerce Trends Defining the Digital Economy
- Mobile devices now account for around 52% of global internet traffic, underscoring their role as the primary access channel.
- The average US user spends approximately 5.4 hours per day on mobile devices, reflecting deep daily engagement.
- Global mobile advertising investment is projected to surpass USD 216 billion by 2025.
- In the US, about 63% of Google searches are conducted on mobile devices rather than desktops.
- Social media engagement is overwhelmingly mobile-driven, with 98.5% of Facebook users accessing the platform via smartphones.
- Mobile shopping is expected to dominate e-commerce, accounting for 72.9% of total online sales by 2025.
- Brand perception improves with mobile optimisation: 61% of consumers view brands more favourably when their websites are mobile-friendly.
- Email consumption is increasingly mobile-first, with 66% of marketing emails opened on mobile devices.
- Nearly 47% of users prefer checking email on smartphones rather than on other devices.
Moreover
- Performance marketing continues to shift toward mobile, which generates 52% of all pay-per-click ad clicks.
- Social platforms and mobile-first ecommerce sites drive 42% of total mobile purchase activity.
- TikTok remains the most downloaded mobile application globally, highlighting the dominance of short-form mobile video.
- Around 19% of US digital marketing budgets are currently allocated to mobile advertising.
- Video consumption is predominantly mobile, with 90% of YouTube views occurring on smartphones.
- Poor mobile usability discourages repeat visits, as 61% of users are unlikely to return to a website after a bad mobile experience.
- Mobile users show stronger purchase spontaneity, being 40% more likely to make impulse purchases.
- Americans check their smartphones an average of 205 times per day, reflecting habitual usage.
- Mobile ad avoidance is rising, with approximately 530 million users worldwide using mobile ad blockers.
Further
- Mobile dependency is increasing, as 43.2% of Americans describe themselves as addicted to their phones.
- In-store mobile behavior is widespread, with 82% of shoppers searching for product details on their phones while inside stores.
- Mobile search adoption varies by age: 80% of Gen Z primarily use mobile search, compared with 35% among Baby Boomers.
- Mobile video engagement continues to accelerate, growing by nearly 100% year over year.
- The average smartphone user has more than 40 apps installed, but uses only about 18 regularly.
- Poor mobile design impacts brand advocacy, as 57% of users will not recommend businesses with weak mobile experiences.
- Voice search usage on mobile devices has increased by 42% over the past year.
- Advanced connectivity is expanding, with 45% of mobile users in developed markets now using 5G networks.
- Mobile AR influences purchasing decisions, as 37% of consumers are more likely to buy from brands that use AR experiences.
- Mobile devices are the preferred research tool, with 63% of consumers choosing smartphones to find brand information.
- In the US, around 187.5 million consumers are expected to make at least one mobile purchase in 2025.
(Sources: Statista, Vidico)
Conclusion
Mobile marketing statistics clearly demonstrate that mobile has become the dominant channel shaping how consumers search, engage, and purchase in today’s digital ecosystem. The data highlights widespread smartphone adoption, rising mobile commerce activity, and strong performance across mobile advertising, social media, and SMS marketing, confirming that mobile-first strategies are no longer optional.
High engagement levels, faster response rates, and superior conversion performance across mobile touchpoints emphasize the effectiveness of personalization, location-based targeting, and app-driven experiences. In parallel, the rapid growth of mobile payments, social commerce, and in-app transactions reflects increasing consumer trust and convenience-driven behavior.
Overall, mobile marketing statistics underscore a structural shift in digital behaviour, with brands that prioritise seamless mobile experiences, data-driven personalisation, and integrated mobile channels better positioned to capture demand, influence purchase decisions, and sustain long-term growth in an increasingly mobile-centric marketplace.
FAQ’s
Mobile marketing statistics are quantitative data points that measure how consumers use mobile devices to search, browse, interact with ads, and make purchases. These statistics cover mobile usage, advertising spend, engagement rates, conversions, app usage, and mobile commerce trends.
Mobile marketing statistics help businesses understand consumer behaviour on smartphones and tablets, identify high-performing channels, and optimize campaigns. They support data-driven decisions across budget allocation, personalisation, user experience design, and customer acquisition strategies.
Mobile now accounts for the majority of internet traffic, ad clicks, and ecommerce activity. Statistics consistently show that mobile surpasses desktop in website visits, paid ad interactions, social media usage, and online purchases, making it the primary digital access point.
The data indicates that consumers rely heavily on mobile devices for product research, price comparison, social discovery, and instant purchases. High engagement with apps, SMS, mobile ads, and digital wallets reflects a preference for speed, convenience, and personalized experiences.
Mobile marketing statistics highlight stronger engagement, higher click-through rates, and faster response times compared to traditional digital channels. As a result, advertisers increasingly prioritize mobile-first formats such as in-app ads, social media ads, SMS campaigns, and location-based promotions