
Introduction
Market Research Industry Statistics: This industry is essential for guiding business strategies by offering critical insights into consumer behavior, market trends, and competitive landscapes. With increasing pressure on businesses to base decisions on data, the need for accurate and timely market research has surged.
This industry utilizes a variety of research methods, such as surveys, focus groups, data analytics, and competitive intelligence, to help organizations grasp market dynamics and predict future trends. As technology advances, the market research industry evolves, with innovations like AI-powered analytics, automation, and new data collection techniques transforming how research is performed and utilized.
The following market research industry statistics showcase key trends, growth projections, and the shifting role of market research in today’s business landscape..
Editor’s Choice
- Online and mobile quantitative research services contribute to 35% of the global revenue for market research companies.
- 69% of market researchers now incorporate synthetic data into their research practices.
- Approximately 47% of researchers globally use AI regularly to enhance their market research activities.
- Online surveys are the most frequently used quantitative method, with 85% of market research professionals reporting they use this approach regularly.
- Online in-depth interviews conducted with webcams have emerged as the leading qualitative research method, with 34% of researchers utilizing this technique regularly.
Revenue Distribution Across Market Research Services
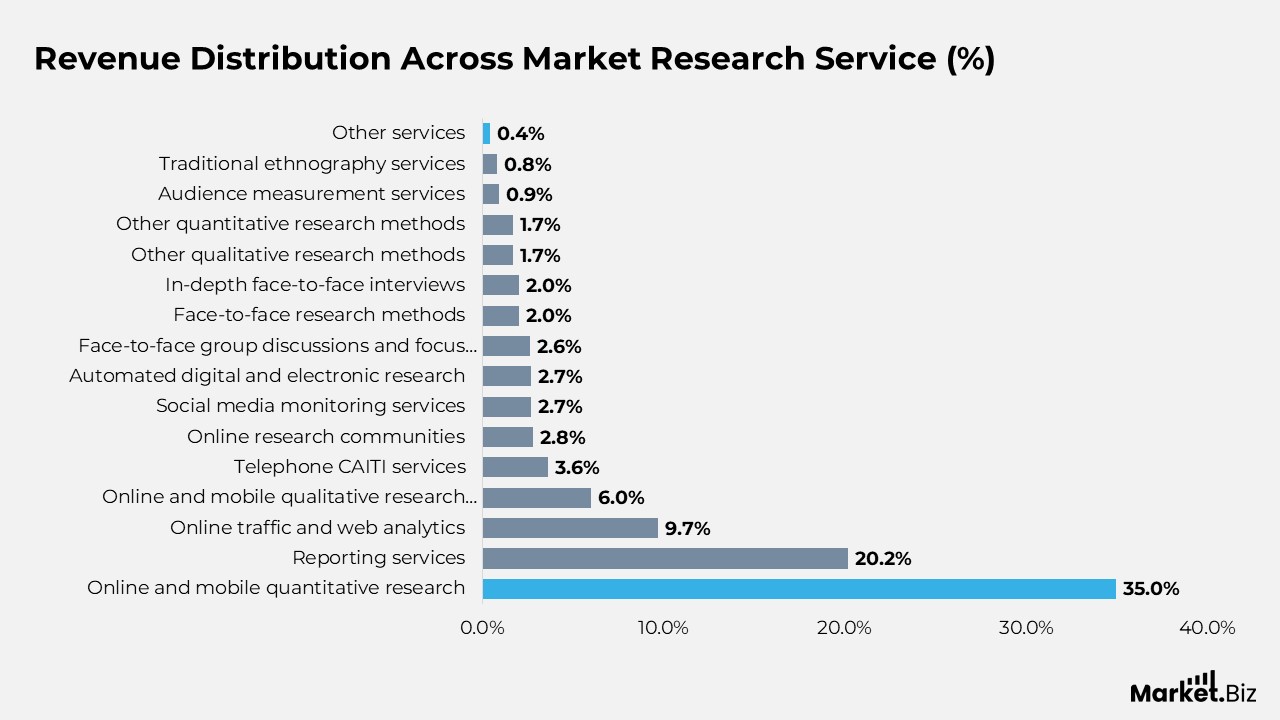
- Online and mobile quantitative research accounts for 35% of the total market research revenue.
- Reporting services contribute 20.2% to the overall revenue.
- Online traffic and web analytics make up 9.7% of the market research revenue.
- Online and mobile qualitative research services represent 6% of total revenue.
- Telephone CAITI services contribute 3.6% of the revenue.
- Online research communities account for 2.8% of market research revenue.
- Social media monitoring services make up 2.7% of the revenue.
- Automated digital and electronic research contributes 2.7% to the overall revenue.
- Face-to-face group discussions and focus groups account for 2.6% of total revenue.
- Face-to-face research methods represent 2% of market research revenue.
- In-depth face-to-face interviews make up 2% of total revenue.
- Other qualitative research methods contribute 1.7% to market research revenue.
- Other quantitative research methods account for 1.7% of the revenue.
- Audience measurement services represent 0.9% of the total revenue.
- Traditional ethnography services contribute 0.8% of market research revenue.
- Other services make up 0.4% of the total revenue.
(Source: Semrush Inc., Statista)
Healthcare Contract Research Outsourcing Market
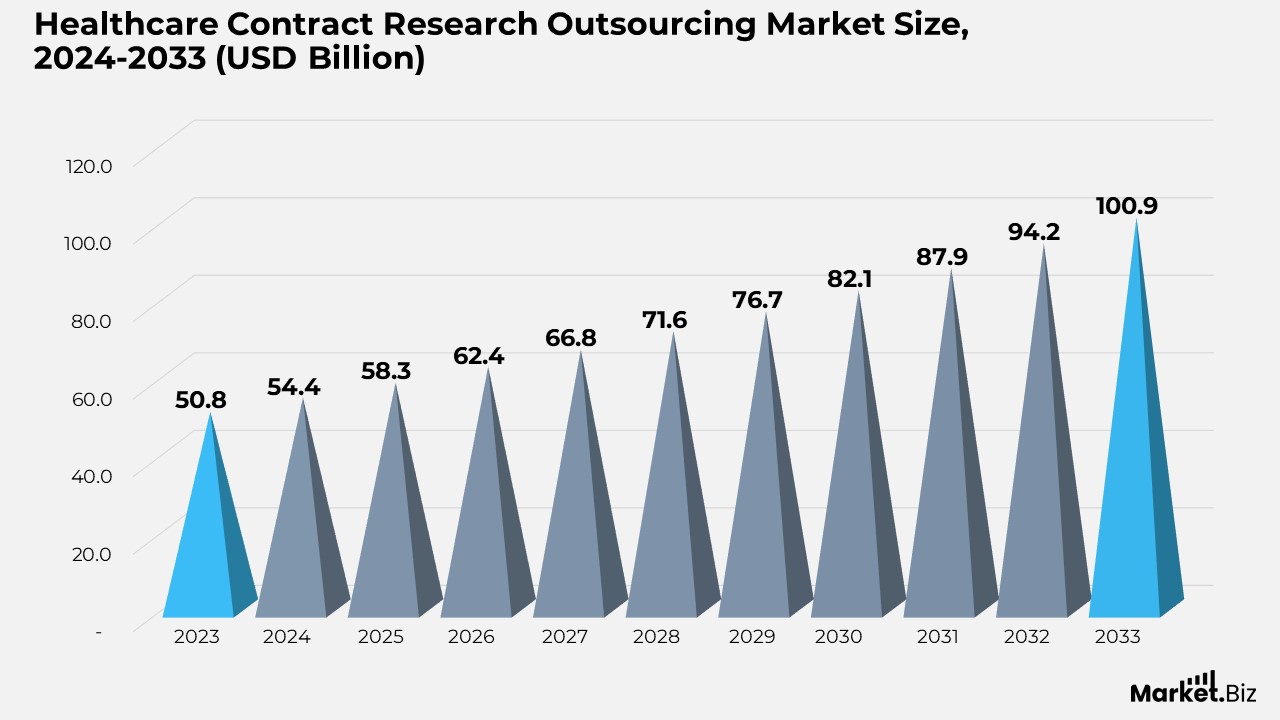
- According to Market.us, the healthcare contract research outsourcing market is expected to rise from $58.3 billion in 2025 to $100.9 billion by 2033, representing a compound annual growth rate (CAGR) of 7.1% from 2024 to 2033.
- The growth of the market is driven by increased investments in R&D, outsourcing due to time and cost constraints, and the patent expiration of blockbuster drugs.
- The clinical segment led in 2023, capturing 62.3% of the market share due to the rising demand for biologics, personalized medicines, and orphan drugs, along with advances in technology and global clinical trials.
- Clinical trial services accounted for 22.7% of the market share, fueled by the increasing number of clinical trials and the need for cost-effective monitoring services.
- The oncology/hematology segment saw a significant growth rate, with a revenue share of 15.2%, driven by ongoing investments in targeted drugs, immunotherapies, and personalized medicine by biotech and pharmaceutical companies.
- The pharmaceutical companies segment grew substantially, contributing 32.3% to the market, reflecting the industry’s strong focus on safer and more effective technologies.
- North America held the largest market share at 41.6%, benefiting from government support for R&D activities, including subsidies, funding, and critical contributions during the COVID-19 pandemic.
(Source: Market.us)
Regulatory Information Management System Market
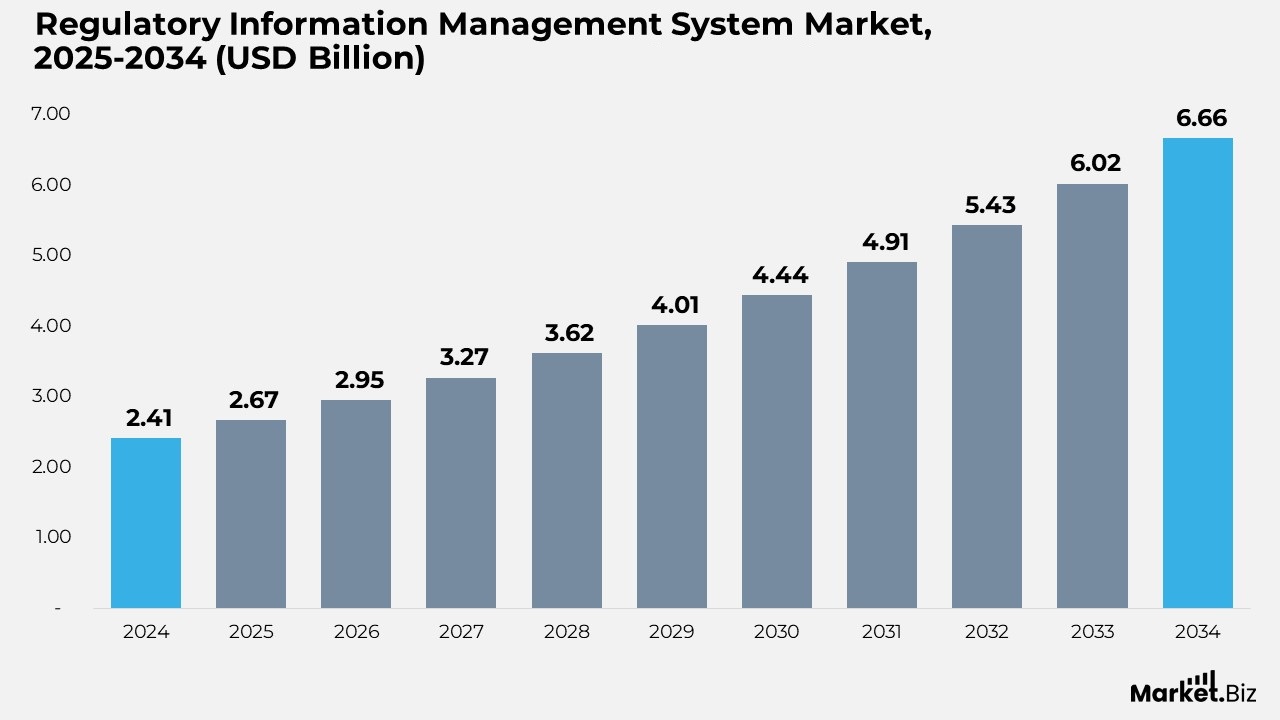
- According to Market.us, the regulatory information management system market is expected to rise from $2.67billion in 2025 to $6.66 billion by 2034, representing a compound annual growth rate (CAGR) of 10.7% from 2025 to 2034.
- The growth of the Regulatory Information Management System (RIMS) market is driven by increasing regulatory complexity across industries such as pharmaceuticals, biotechnology, and food & beverages, with businesses relying on RIMS to automate compliance processes.
- In 2024, the Software section dominated the RIMS market component segment, capturing over 67.5% of the market share, due to rising regulatory demands and the need for data security and compliance management.
- In 2024, the Registration section led the application segment of the RIMS market, holding more than 26.9% of the market share, driven by the growing complexity of global regulations and the need for efficient product registration processes.
- In 2024, the Large Enterprises section held a dominant position in the enterprise size segment, with over 62.4% of the market share, reflecting the complex regulatory data needs of large organizations with diverse product portfolios.
- In 2024, the Pharmaceutical & Biotechnology sector held the largest share in the end-user segment, accounting for more than 42.1% of the market share, driven by the need for RIMS to manage complex regulatory submissions and clinical trial data.
- In 2024, North America captured 36.2% of the RIMS market, with a market value of US$ 872.4 million, driven by the region’s complex regulatory landscape and the need for efficient compliance solutions.
(Source: Market.us)
Breakdown of Regular Usage of Quantitative Research Methods
- 85% of researchers regularly use online surveys.
- 47% of researchers regularly use mobile surveys.
- 32% of researchers regularly use proprietary panels.
- 26% of researchers regularly use online communities.
- 13% of researchers regularly use CATI (Computer-Assisted Telephone Interviewing).
- 12% of researchers regularly use face-to-face methods.
- 10% of researchers regularly use CAPI (Computer-Assisted Personal Interviewing).
- 7% of researchers regularly use automated measures or people meters.
- 4% of researchers regularly use mail surveys.
- 4% of researchers regularly use IVR (Interactive Voice Response).
- 4% of researchers regularly use neuroscience measurements.
- 3% of researchers regularly use biometrics.
- 16% of researchers regularly use other quantitative techniques.
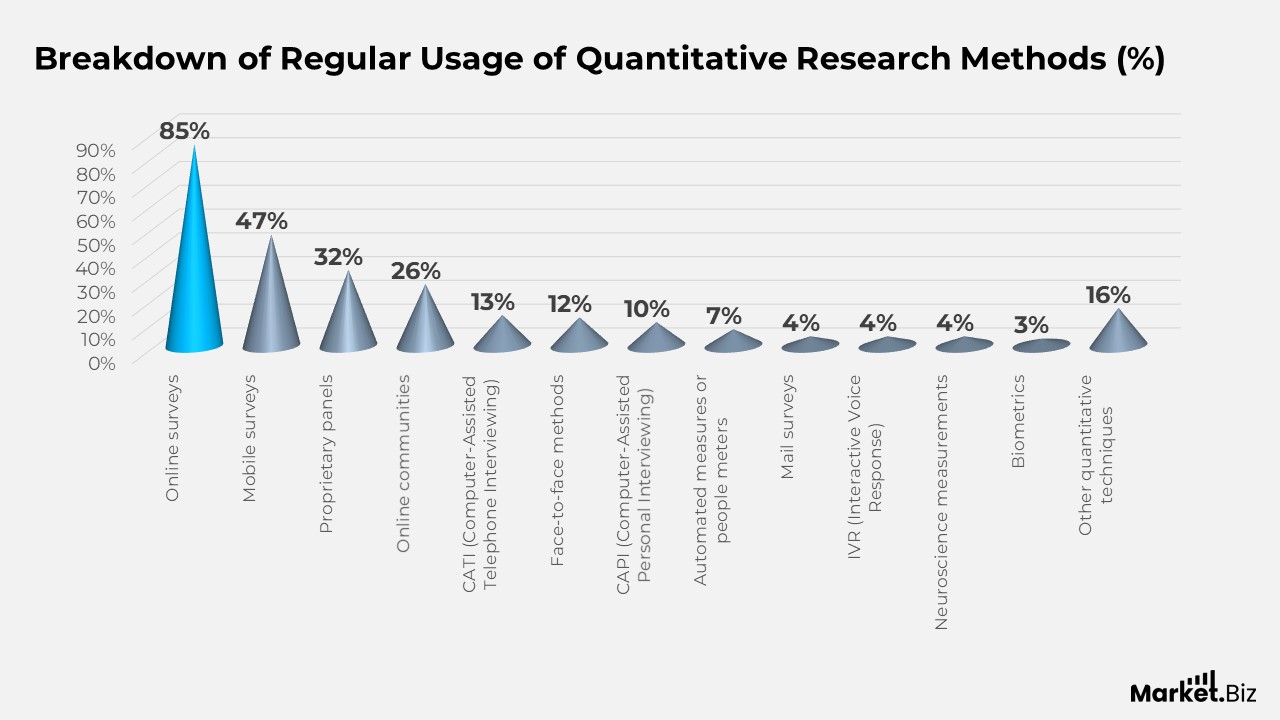
(Source: Semrush Inc., DemandSage)
Social Media Video Marketing
- 34% of researchers regularly use online IDIs (In-Depth Interviews) with webcams.
- 28% of researchers regularly use online focus groups with webcams.
- 28% of researchers regularly use online communities.
- 20% of researchers regularly use mobile qualitative methods.
- 16% of researchers regularly use in-person IDIs.
- 14% of researchers regularly use in-person focus groups.
- 13% of researchers regularly use telephone IDIs.
- 11% of researchers regularly use bulletin board studies.
- 11% of researchers regularly use in-store/shopping observations.
- 10% of researchers regularly use chat (text-based) online focus groups.
- 10% of researchers regularly use other qualitative methods.
- 7% of researchers regularly use chat (text-based) online IDIs.
- 7% of researchers regularly monitor blogs.
- 5% of researchers regularly use automated interviewing via AI systems.
- 3% of researchers regularly use telephone focus groups.
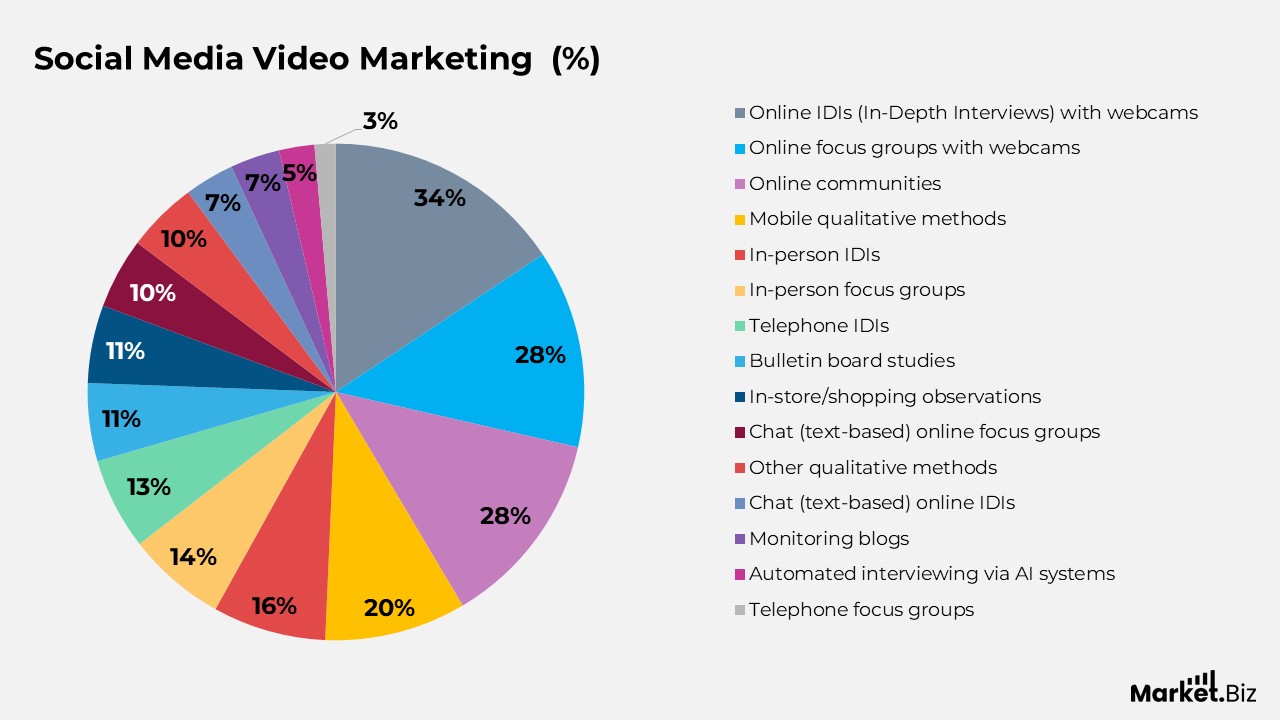
(Source: Semrush Inc, DemandSage, Statista)
Survey Method Spending Distribution
- 16.4% of spending goes to CRM systems and customer satisfaction surveys.
- 15% of spending is allocated to market measurement surveys.
- 12.4% of spending is directed towards user experience surveys.
- 11% of spending is invested in usage and behavioral studies.
- 10.3% of spending is dedicated to (media) audience research.
- 9.3% of spending goes to new product/service development surveys.
- 5% of spending is focused on opinion surveys/polling.
- 5% of spending is used for omnibus/cost-sharing surveys.
- 4.6% of spending is directed to advertising/brand tracking surveys.
- 2.5% of spending goes to employee satisfaction surveys.
- 1.9% of spending is allocated to ad pre-tests.
- 1.8% of spending is invested in business-to-business research.
- 1.4% of spending is used for market modeling.
- 0.9% of spending is directed towards non-profit research.
- 0.5% of spending is allocated to mystery shopping.
- 1.9% of spending is directed to other survey methods.
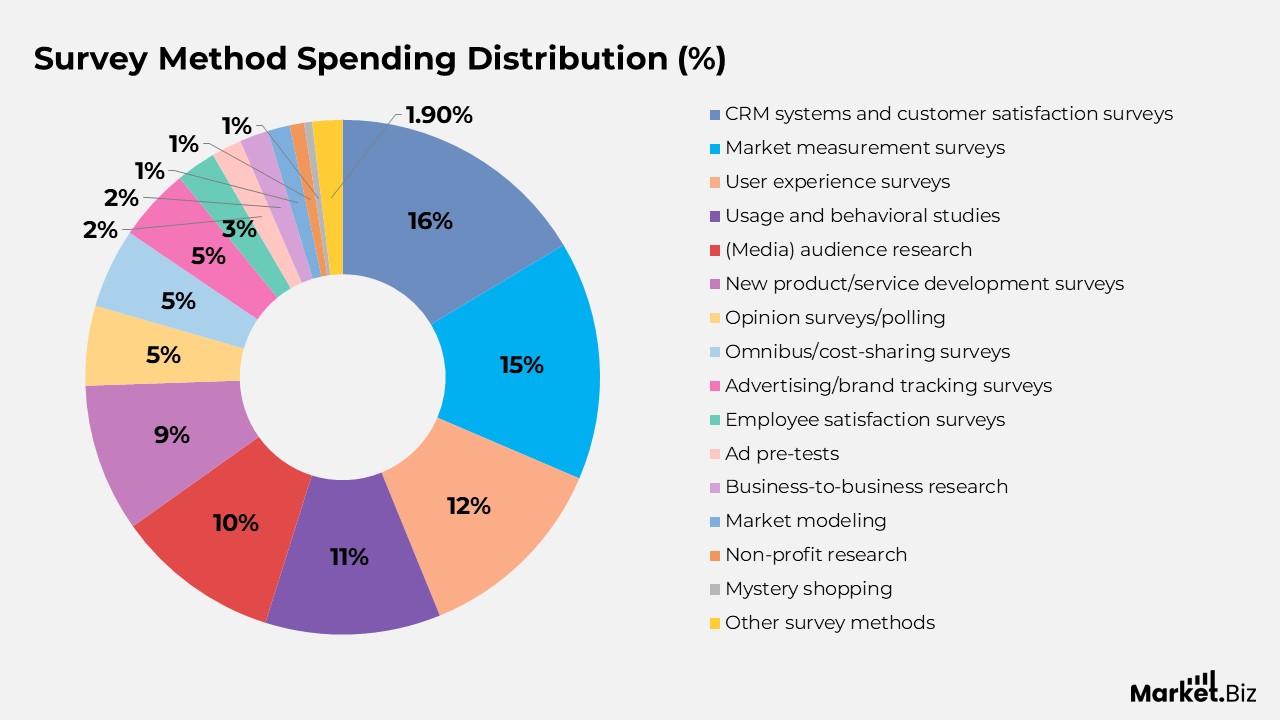
(Source: Statista, DemandSage)
Trend in the Average Number of Questions in Online Surveys
- In 2023, the average number of questions in online surveys was 11.0.
- In 2022, the average number of questions was 10.7.
- In 2021, the average number was 10.5.
- In 2020, the average number of questions dropped to 10.2.
- In 2019, the average number of questions was 11.8.
- In 2018, the average number of questions was 12.2.
- In 2017, the average number of questions increased to 13.2.
- In 2016, the average number of questions was 13.1.
- In 2015, the average number of questions was 13.0.
- In 2014, the average number of questions remained at 11.5.
- In 2013, the average number of questions dropped to 11.5.
- In 2012, the average number of questions was 11.8.
- In 2011, the average number of questions was 12.0.
- In 2010, the average number of questions was 12.1.
(Source: Semrush Inc, DemandSage, Statista)
AI in Market Research
- 83% of market research professionals report that their organizations plan to invest in AI for research activities by 2025.
- 47% of researchers globally use AI regularly in their market research activities.
- AI adoption varies by region, with 58% of researchers in Asia-Pacific & Japan using AI regularly, while only 39% in North America do the same.
- The majority of researchers, 73%, feel “very confident” or “extremely confident” about applying AI in their market research activities.
- Around 25% of researchers express concerns that the impact of AI might outpace their personal or team skills.
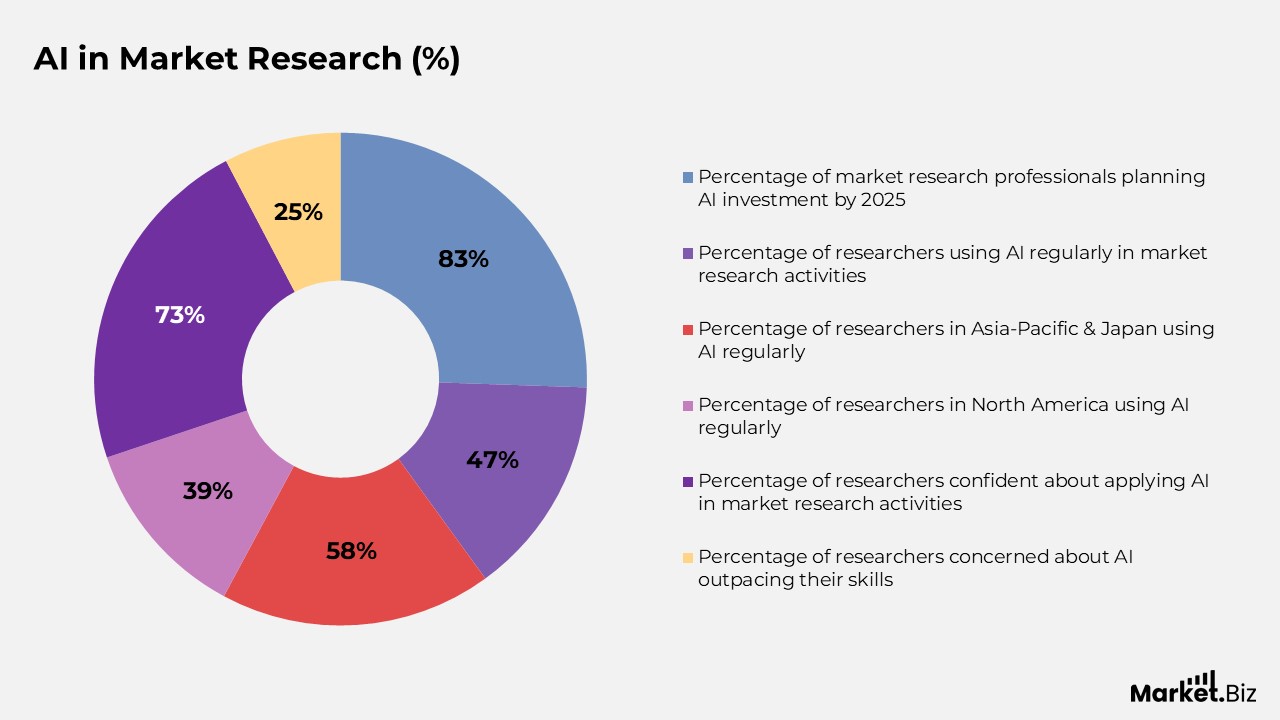
(Source: Semrush Inc, DemandSage, Qualtrics)
Conclusion
The market research industry is rapidly evolving, playing a crucial role in helping businesses make informed, data-driven decisions. The statistics underscore the growing dependence on a variety of research methods, from online surveys and mobile studies to the increasing use of AI and synthetic data.
As technology progresses, the industry is adopting new tools and platforms, such as online communities and social media monitoring, to gather deeper insights into consumer behavior. This shift towards more personalized, real-time, and accessible data showcases the industry’s ability to adapt to the changing needs of businesses.
With the rise of video marketing, AI, and mobile surveys, the market research industry is set for continued growth, providing essential insights that guide business strategies and decisions.
FAQ’s
The market research industry is adapting to new technologies and methodologies, with an increasing focus on online surveys, mobile-based research, and the integration of AI and synthetic data. Platforms like social media monitoring and online communities are also being leveraged to gather real-time consumer insights.
Popular research methods in the industry include online surveys, mobile surveys, focus groups, in-depth interviews, and data analytics. In addition, AI-powered tools, social media monitoring, and online research communities are gaining traction for providing valuable insights.
AI is transforming market research by enhancing data collection, analysis, and interpretation processes. AI-driven tools help uncover patterns, forecast trends, and provide deeper insights, enabling businesses to make more accurate, data-driven decisions.
Video content and social media are becoming increasingly important in market research. Social media monitoring enables businesses to track customer sentiment and trends in real-time. Video content, such as product reviews and focus groups, offers valuable insights into consumer behavior and preferences.
Mobile technology has made market research more accessible and flexible. It allows researchers to engage a broader audience and collect data in real-time. Mobile surveys and apps are particularly useful as smartphones become a key tool in everyday life for gathering consumer insights.
Real-time data enables businesses to make prompt, informed decisions by providing immediate insights into trends, consumer behavior, and market dynamics. This is especially crucial in fast-moving industries where the ability to adapt quickly can offer a competitive advantage.