
Introduction
Voice-over Statistics: The voice-over industry has become a measurable, data-driven component of the broader media, entertainment, and digital content economy, fueled by the expansion of streaming services, online advertising, audiobooks, e-learning platforms, gaming, and AI-powered content tools.
The growing demand for multilingual, localised, and emotionally authentic audio has increased reliance on voice talent across commercials, films, podcasts, virtual assistants, explainer videos, and enterprise training content.
Improvements in remote recording technology, affordable home studio setups, and cloud-based production workflows have widened global access to voice-over work. At the same time, the emergence of synthetic and AI-generated voices is transforming production efficiency, cost structures, and usage dynamics, introducing new competitive and ethical considerations.
Collectively, voice-over statistics point to a rapidly evolving market shaped by rising content volumes, diversified platforms, and heightened expectations for scalable, high-quality audio delivery.
Editor’s Choice
- Voice technology has reached mass scale, with more than 8.4 billion active voice assistants in use globally, exceeding the world’s population and confirming voice as a mainstream digital interface.
- Voice search is becoming habitual, as 65% of users aged 25–49 interact with voice-enabled devices daily, and 21% of consumers use voice search as part of their weekly routine.
- Smart speakers are deeply embedded in daily life, with 93% of users reporting satisfaction and 65% saying they cannot imagine life without their device.
- Voice commerce is gaining traction, with voice-driven shopping projected to reach USD 45 billion by 2028, while 43% of device owners already use voice to support purchasing decisions.
- Local intent drives voice usage: 76% of smart speaker users perform local searches weekly, and 28% of voice searches result in direct phone calls to businesses.
- Personalisation and experience quality are decisive: 72% of consumers engage only with tailored messaging, and 76% are willing to abandon a brand after just one poor experience.
Voice Technology Adoption and Usage Statistics
- The global base of active voice assistants exceeded 8.4 billion last year, meaning voice-enabled devices now outnumber the world’s population.
- Voice interaction has reached mainstream awareness, with 58.6% of US consumers having used voice search at least once.
- Regular usage is becoming habitual, as 21% of people rely on voice search as part of their weekly routine.
- Monthly voice search activity has crossed 1 billion queries, reflecting steady growth as users grow more comfortable with voice interfaces.
- Mobile remains a key access point, with 27% of users performing voice searches on smartphones, particularly while multitasking or on the move.
- Smart speaker penetration is accelerating, with 75% of households projected to own at least one device by 2025.
- Demand is not limited to early adopters, as 34% of consumers without a voice assistant express interest in purchasing one.
- Voice search continues to rank among the most common voice-driven activities, placing sixth overall behind calling and texting, but ahead of many other digital tasks.
(Sources: GeoMarketing, Magenest, SEOClarity)
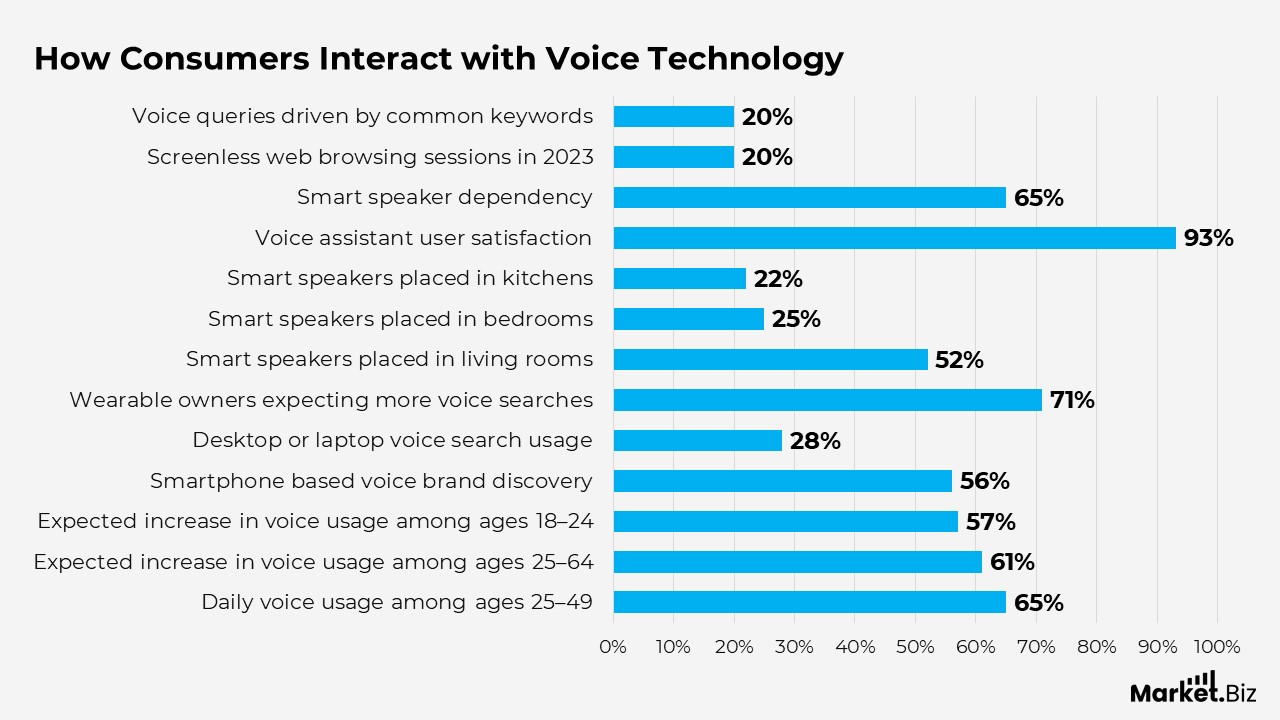
How Consumers Interact with Voice Technology
- Around 65% of people aged 25–49 interact with voice-enabled devices at least once per day, making this group the most active daily voice users.
- Younger adults aged 18–24 closely follow in daily usage intensity and played a critical role in accelerating early adoption of voice technology.
- Usage momentum is expected to continue, as 61% of individuals aged 25–64 anticipate increasing their reliance on voice devices.
- Growth expectations are also strong among younger users, with 57% of those aged 18–24 planning to increase their use of voice devices over time.
- Smartphones dominate voice-based brand discovery, with 56% of mobile users using voice search to find information about businesses, compared with only 28% on desktops or laptops.
- Wearable technology users are most optimistic about voice interaction, with 71% expecting to perform more voice searches from now on.
- In home environments, voice-activated speakers are most commonly placed in living rooms (52%), followed by bedrooms (25%) and kitchens (22%).
- Consumer sentiment toward voice assistants remains highly positive, with 93% of users expressing satisfaction with their multitasking abilities, instant responses, and everyday convenience.
- Smart speakers have become deeply embedded in daily routines, with 65% of owners saying they cannot imagine life without their devices.
- Digital behavior is shifting away from screens, with 20% of web browsing sessions in 2023 occurring without a screen.
- Voice search behaviour is highly concentrated, with nearly 20% of queries driven by a small group of commonly used question-based keywords such as “how,” “what,” “best,” and “easy.”
(Sources: PwC, Google, Yaguara, GeoMarketing, Magenest, SEOClarity)
Voice Commerce Is Emerging as a Revenue Channel
- Voice-enabled commerce is expanding rapidly, with spending projected to reach USD 45 billion by 2028, up from more than USD 3.3 billion today.
- Shopping behavior via voice is becoming mainstream, with up to 43% of voice device owners using it to support purchase decisions.
- Product discovery drives voice commerce, as 51% of users use voice to research products before buying.
- Transactional usage is growing, with 22% completing purchases via voice and 17% using it to reorder products.
- Habitual buying is forming, as 11.5% of smart speaker owners make voice purchases monthly.
- Brand engagement through voice is gaining traction, with 52% of users open to receiving deals and promotions via voice assistants.
- Voice advertising shows promise: 38% find it less intrusive, and 39% consider it more appealing than other ad formats.
Voice Search Is Closely Tied to Local Discovery
- Spoken search results strongly favor top-ranked listings, with most voice responses coming from the top 3 traditional search results.
- Local intent dominates usage: 76% of smart speaker operators conduct local searches weekly, and 46% do so daily.
- Business discovery through voice is common, with 58% of consumers using voice to find local business information.
- Restaurants are the most searched category, with 51% of users relying on voice to research dining options.
- Voice searches often trigger immediate action, as 28% of users call the business they searched for.
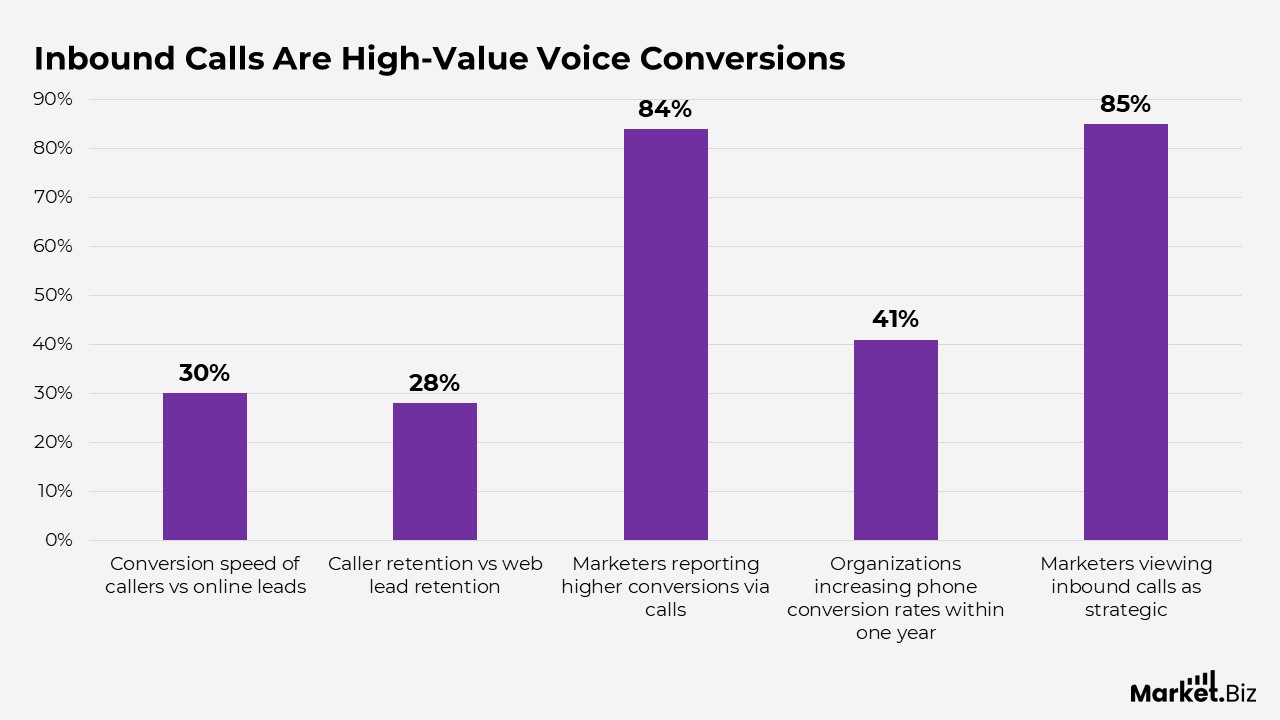
Inbound Calls Are High-Value Voice Conversions
- Phone calls generated through voice search produce 10–15× more revenue than web-based leads.
- Callers move faster through the funnel, converting 30% quicker than online leads.
- Long-term value is higher, with caller retention rates exceeding web lead retention by 28%.
- Conversion performance improves via calls, as 84% of marketers report higher conversion rates and larger order values.
- Recent performance gains are notable: 41% of organisations increased phone conversion rates by 25% or more over the past year.
- Strategic importance is rising, as 85% of marketers consider inbound calls a key part of digital-first strategies.
Conversation Analytics Is Improving Marketing Effectiveness
- Enhanced customer experience is a key outcome, with 48% of marketers benefiting from scaled conversation analytics.
- Acquisition and retention improve as well, with 43% reporting gains from analysing call-level data.
- Organisations that use conversation analytics report improved operational efficiency, employee productivity, and system integration.
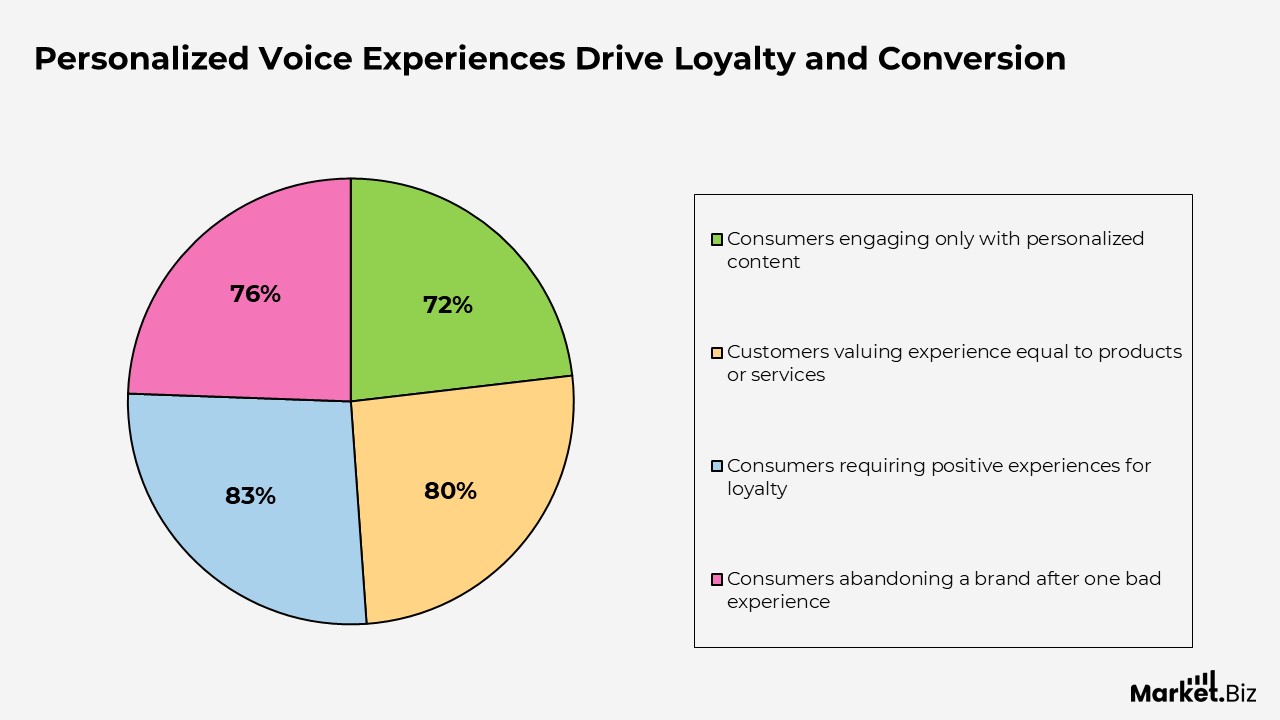
Personalized Voice Experiences Drive Loyalty and Conversion
- Personalization is now essential, with 72% of consumers engaging only with content tailored to their interests.
- Experience quality rivals product value, as 80% of customers rate experience as equally important as offerings.
- Loyalty depends on positive engagement, with 83% requiring good experiences across all interaction channels.
- Tolerance for poor experiences is low, as 76% of consumers stop doing business after a single bad interaction.
(Sources: Narvar, Voicebot, Google, Demand Sage, Learn.G2, BrightLocal, Search Engine Journal, BIA/Kelsey, Forrester, SmarterHQ, Salesforce, Glassbox Digital, Invoca)
Voice-Over Pricing Incentives by Content Format
- E-learning course voice-over services commonly offer discounts of around 20%, reflecting demand for long-form and repeat content.
- Audioguide voice-over projects show some of the highest incentives, with discounts reaching 30%.
- Podcast voice-over work typically features more moderate reductions, averaging about 15%.
- IVR voice-over rates are often discounted by approximately 25% due to volume-based corporate usage.
- Audiobook voice-over services carry relatively lower discounts of around 10%, reflecting high production effort and narration time.
- Documentary voice-over projects generally offer discounts of around 20%, balancing creative input with longer runtimes.
- Educational video voice-over services see nearly 35% discounts, supported by recurring institutional demand.
- Television advertising voice-over rates offer the deepest discounts, up to 40%, driven by competitive bidding and campaign scale.
- Film dubbing voice-over services typically offer discounts of about 20%, depending on language and localization scope.
- Corporate video voice-over projects commonly include discounts of around 30%, reflecting bulk and repeat engagements.
- Casting-related voice-over services offer more limited discounts, typically around 10%, due to specialised talent requirements.
- Cartoon dubbing voice-over work offers approximately 25% discounts, driven by episodic production volumes.
(Sources: Narvar, Voicebot, Google, Demand Sage, Learn.G2, BrightLocal, Search Engine Journal, BIA/Kelsey, Forrester, SmarterHQ, Salesforce, Glassbox Digital, Invoca)
How Voice Actors Allocate Their Upgrade Budgets by Work Commitment
- About 53% of full-time voice actors prioritise microphone upgrades, indicating that sound capture quality remains the most critical investment area.
- Nearly 49% of full-time professionals focus on enhancing their recording studio environment to achieve cleaner acoustics and consistent output.
- Close to 34% of full-time voice actors invest in improved audio interfaces, reflecting a secondary but important need for better signal processing.
- Around 66% of part-time voice actors rank microphones as their top upgrade choice, indicating a stronger reliance on entry-level gear improvements.
- Approximately 48% of part-time professionals upgrade their recording studios, signalling a growing seriousness about the quality of home-based production.
- Nearly 47% of part-time voice actors prioritise upgrades to digital audio workstations, highlighting a greater reliance on software tools to streamline voice-over workflows.
(Sources: Statista, Voices. com)
Why Personalized and Seamless Experiences Define Modern Customer Loyalty
- 72% of consumers engage only with marketing messages that align closely with their personal interests, making relevance a core driver of attention and response.
- 80% of customers value the experience a company delivers as much as its products or services, indicating that poor experiences directly increase customer churn risk.
- 83% of consumers expect a positive experience across every interaction channel, and brands that fail to deliver consistency risk losing long-term customer value.
- 76% of consumers stop doing business after a single negative experience, highlighting how quickly trust erodes when expectations are not met.
(Sources: SmarterHQ, Salesforce, Glassbox Digital, Invoca)
How Conversation Analytics Is Reshaping Customer Experience and Growth Strategies
- 48% of marketers report delivering or expecting to deliver more advanced customer experiences after scaling conversation analytics across the enterprise, using insights from phone conversations to refine voice search visibility and interaction quality.
- 43% of marketers indicate stronger customer acquisition and retention outcomes as conversation analytics enables more precise experience personalization based on real consumer dialogue.
(Sources: Forrester)
Conclusion
Voice-over Statistics: In conclusion, voice-over statistics indicate that voice-driven communication has become an integral component of today’s digital ecosystem, extending far beyond entertainment into marketing, commerce, customer service, and search behavior.
The growing adoption of voice assistants, the rising frequency of voice search, and increasing comfort with voice-based transactions reflect a shift toward more natural, frictionless interactions. At the same time, data highlights the strong connection between voice usage, local discovery, and high-value outcomes such as phone calls and conversions.
As consumer expectations for personalisation and seamless experiences continue to rise, voice-over technologies and analytics are playing a critical role in helping brands understand intent and optimise engagement. Overall, the statistics suggest that voice over is no longer an emerging trend but a strategic channel, with a long-term impact tied to accuracy, relevance, and user-centric voice experiences across platforms.
FAQ’s
Voice-over statistics show sustained growth driven by increasing adoption of voice assistants, smart devices, and voice-enabled applications across media, commerce, and customer engagement platforms. This growth reflects a broader shift toward conversational and hands-free digital interaction.
Voice offers speed, convenience, and accessibility, allowing users to interact with technology without screens or manual input. Statistical trends suggest that multitasking behavior and on-the-go usage are key drivers of voice adoption.
Voice-over data highlights a strong connection between voice usage and search intent, particularly for local queries. Users tend to act quickly on voice search results, making voice an important channel for discovery and immediate decision-making.
Voice-over statistics indicate that voice is increasingly used for product research, reordering, and transactions. While discovery remains the primary use case, transactional confidence is steadily increasing as users become more familiar with voice interfaces.
Personalization is critical, as consumers expect voice responses to be context-aware, relevant, and tailored to their preferences. Data shows that customized voice interactions significantly improve engagement and loyalty.