
Introduction
Animation industry statistics offer a data-driven overview of how animated content is created, delivered, and consumed across films, television, gaming, advertising, and digital media platforms. These statistics capture essential indicators such as market size, revenue trends, production activity, technology adoption, workforce patterns, and regional performance.
They also reflect the growing role of CGI, 3D animation, real-time rendering, and AI-enabled tools. Alongside the increasing demand from streaming services, mobile games, and social media platforms. In addition, animation statistics highlight evolving audience preferences, including the rise of short-form content, adult-oriented animation, and region-specific productions.
Collectively, these insights help explain market behavior, investment direction, and the broader economic significance of animation within the global media and entertainment landscape.
Editor’s Choice
- In 2022, computer-generated animation accounted for roughly 85% of the overall animation market, underscoring its dominance across content formats.
- The global 3D animation market is expected to exceed USD 50 billion by 2025, expanding at an estimated CAGR of 11%.
- More than 60% of animators worldwide were employed within the film and television sectors in 2023. Reflecting strong demand from traditional media industries.
- Animation studios are increasingly adopting sustainable production methods. Achieving close to a 50% reduction in carbon emissions through environmentally friendly animation techniques.
- By 2026, nearly 50% of animation studios are expected to operate on cloud-based infrastructure. Supporting remote collaboration and reducing physical infrastructure costs.
- The global animation audience skews young, with the average viewer age estimated at around 14 years, driven largely by children and early teen consumption.
- More than 55% of animation studios reported year-on-year revenue growth in 2022, reflecting stronger content demand and wider distribution channels.
Moreover
- Since 2000, Disney’s animated titles have collectively generated over $30 billion in worldwide box office and related revenues.
- Around 80% of consumers favour watching animated content on mobile devices, highlighting the shift toward on-the-go, smartphone-based viewing.
- Annual production of animated television series has risen by roughly 25% over the last 5 years, supported by streaming-led content expansion.
- “Pirates of the Caribbean: On Stranger Tides” remains the costliest animation-heavy production to date. With total production and visual effects spending of about $379 million.
- Adobe Animate is one of the most widely adopted animation platforms, with more than 10 million active users globally.
- Computer-generated imagery is now used in approximately 45% of animated film productions, underscoring its growing role in modern animation workflows.
- The Asia Pacific region accounts for about 52% of the global animation industry. Supported by large-scale production hubs and rising local demand.
- Nearly 70% of professional animators prefer open-source animation tools, citing flexibility, customization, and cost efficiency.
- Global streaming platforms delivered over 1.2 billion hours of animated content in 2023, reflecting strong viewer engagement across age groups.
- The average production budget for a feature-length animated film in 2023 stood at roughly $128 million. Reflecting higher quality standards and advanced visual technologies.
Global Animation Industry Trends
- In the European Union, the animation film industry is valued at over $5 billion and continues to expand steadily across multiple content formats.
- Employment within the European animation sector is increasing at an annual pace of around 5–7%, indicating sustained workforce demand and studio expansion.
- France, the United Kingdom, and Germany are the leading animation markets in Europe, with shares of approximately 20%, 16.4%, and 10.7%, respectively.
- The use of artificial intelligence across animation workflows is increasing, supporting higher production efficiency and meaningful cost optimization for studios.
- 7 of the 10 highest-grossing animated films in North America were released in the latter half of the 2010s, with Frozen II ranking as the top-performing animated title.
- The media and entertainment sector accounted for nearly 60% of total animation video demand by 2022, making it the largest end-user segment globally.
- Streaming platforms accounted for close to 30% of overall animation consumption in 2022, driven by rising on-demand viewing and investments in original animated content.
- Disney emerged as the highest-grossing animation studio worldwide in 2022, generating approximately $12 billion in animation revenue, while Pixar ranked fifth with about $770 million.
(Source: Statista, Zippia, Abdalslam, MarketSplash)
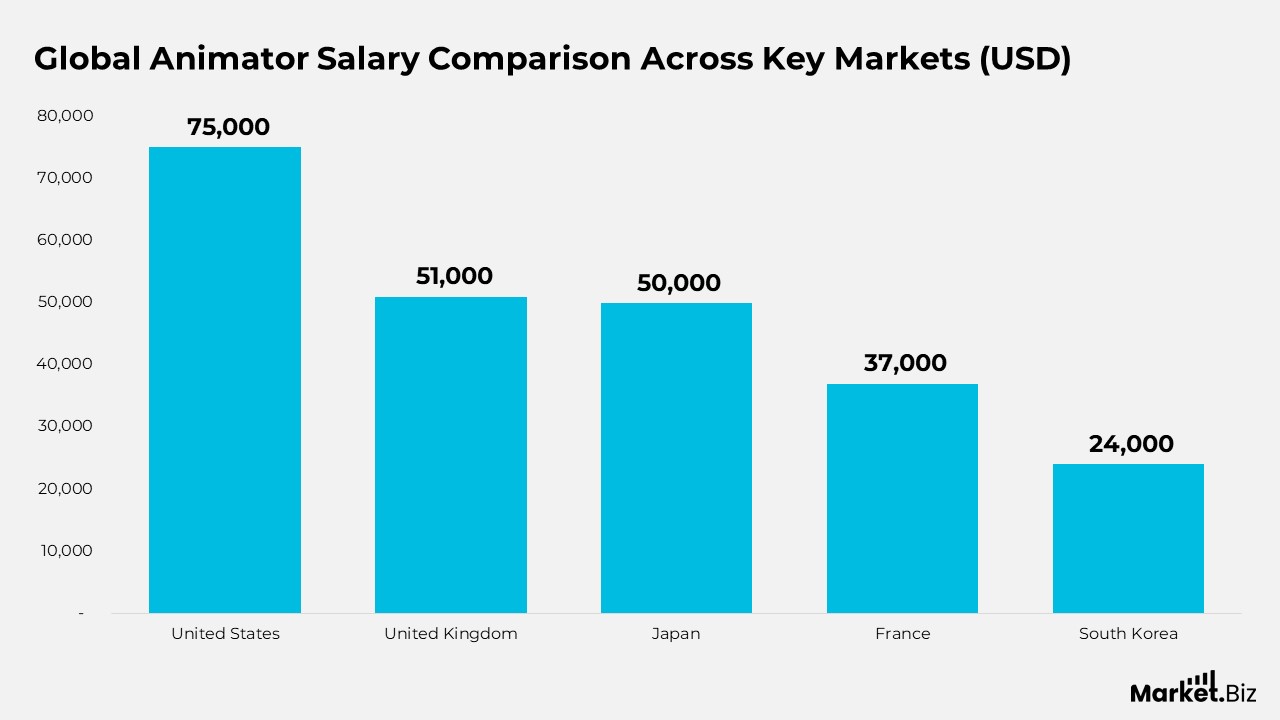
Global Animator Salary Comparison Across Key Markets
- The United States records the highest average animator salary at around USD 75,000, reflecting strong demand from film, gaming, and streaming studios.
- In the United Kingdom, animators earn an average annual salary of approximately USD 51,000, supported by a mature media and post-production ecosystem.
- Japan follows closely, with average animator earnings near USD 50,000, driven largely by anime production and digital content exports.
- France reports an average animator salary of about USD 37,000, aligned with its growing animation studios and government-backed creative programs.
- South Korea shows comparatively lower average earnings at roughly USD 24,000, despite increasing global demand for Korean animation and digital media content.
(Source: Sortlisst, Data Hub, GlassDoor)
Animation Industry Workforce and Technology Landscape Statistics
- The global animation workforce reached approximately 2 million jobs in 2022 and is expected to expand to nearly 2.5 million positions by 2027, reflecting sustained industry growth.
- Average annual animator salaries were around $75,000 in the US, $50,000 in Japan, and $51,500 in the UK, highlighting regional variations in compensation.
- Freelance professionals represented close to 20% of the worldwide animation workforce in 2023, supported by project-based production models and remote collaboration.
- Demand for skilled animation professionals increased by nearly 30% between 2018 and 2023, driven by rising content production across entertainment and digital platforms.
- Strategic collaborations between animation studios and streaming platforms led to a 25% increase in animated original content, strengthening exclusive digital libraries.
- The use of virtual reality and augmented reality in animation is projected to grow by roughly 35% by 2026, supported by demand for immersive visual experiences.
- Animation adoption in the education sector is accelerating, with nearly 70% of e learning platforms expected to integrate animated content by 2025.
- Anime is projected to increase its global market share by around 10% by 2026, driven by higher viewership in non-native-language markets.
- By 2025, nearly 60% of video game developers are expected to rely on animation to enhance interactive, immersive gameplay.
- Computer-generated animation accounted for approximately 85% of total animation video output in 2022, underlining its dominance across formats and applications.
(Source: Statista, Yahoo Finance, MarketSplash, Data Hub)
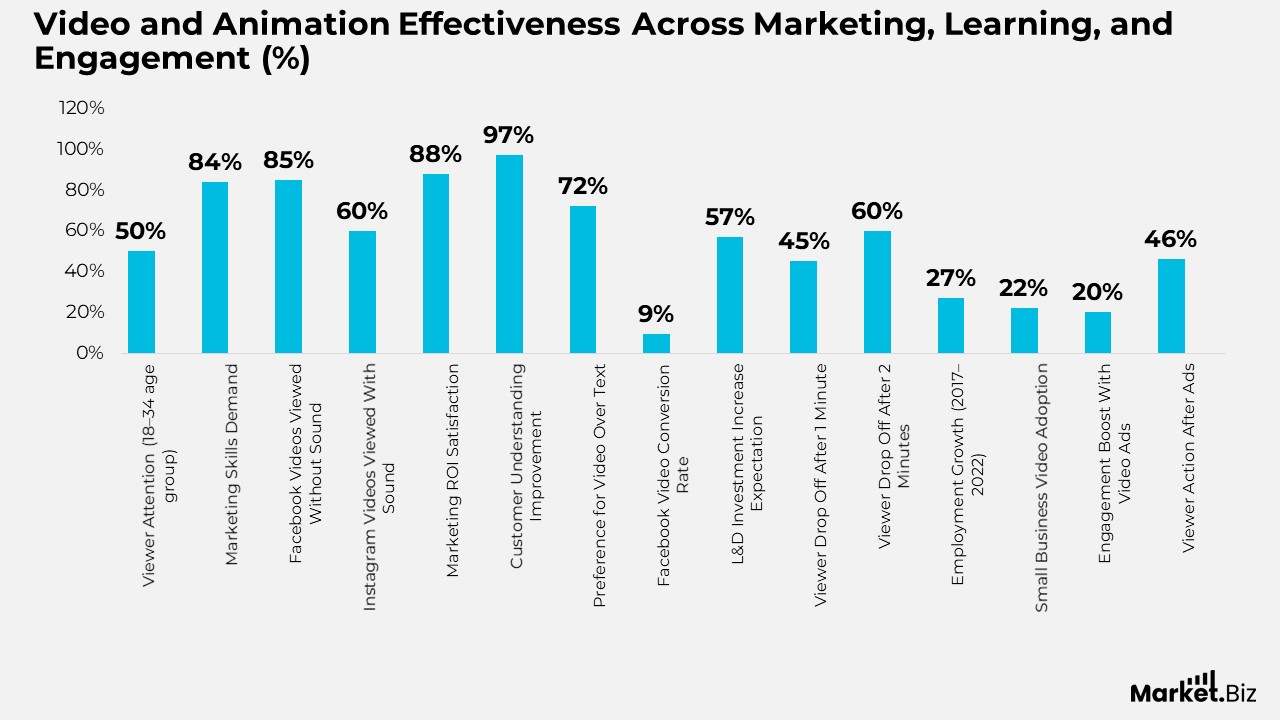
Video and Animation Effectiveness Across Marketing, Learning, and Engagement
- About 50% of viewers aged 18–34 report pausing their current activity to watch videos from their favourite content creators.
- Nearly 84% of marketers consider video production skills essential when recruiting for marketing-focused roles.
- On Facebook, around 85% of videos are viewed without sound. While on Instagram, nearly 60% of video views occur with sound enabled.
- Approximately 88% of marketers are satisfied with the return on investment from social media video marketing initiatives.
- Around 97% of marketers agree that video-based explanations significantly improve customer understanding of products or services.
- When both formats are available, nearly 72% of website visitors prefer watching a video rather than reading text to understand an offering.
- Web pages featuring relevant video content are about 53 times more likely to appear in Google search results than text-only pages.
- Social media videos can drive Facebook conversion rates up to approximately 9.21%, outperforming many static ad formats.
- Around 57% of learning and development professionals expect to increase their investment in learning-related content, including video-based formats.
- Video content on social media generates nearly 12,000% more shares than text-only or image-only posts.
- Viewer drop-off rates rise sharply with duration: about 45% leave after 1 minute and nearly 60% after 2 minutes of video playback.
- Employment in the US film animation services sector increased by approximately 27% between 2017 and 2022, reflecting steady industry expansion.
- Nearly 22% of small businesses in the US plan to publish video content within the next year as part of their marketing strategies.
- Combining video with full-page advertisements can boost audience engagement by roughly 20%.
- Following exposure to advertisements, around 46% of viewers take some form of action, such as visiting a website or seeking additional information.
(Source: Google, HubSpot, LinkedIn, Ad Age, Visible Measures, Online Publishers Association, BIA/Kelsey, Rhythm and Insights)
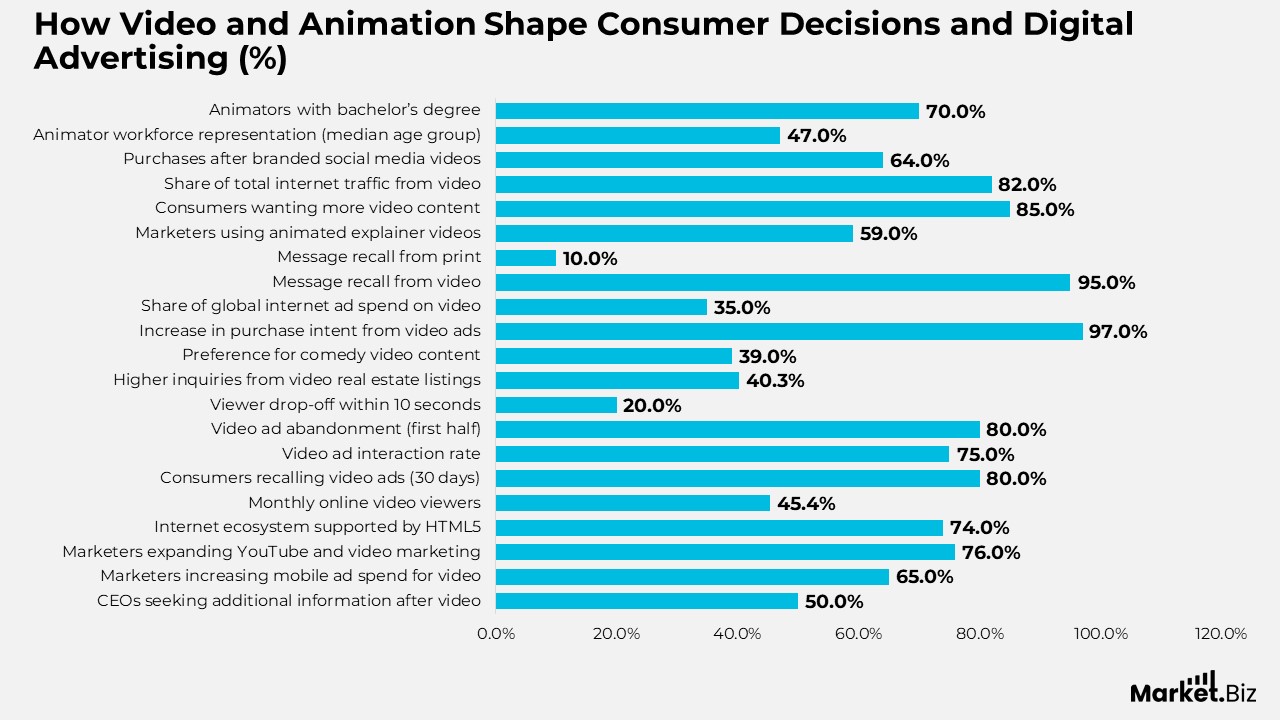
How Video and Animation Shape Consumer Decisions and Digital Advertising
- Nearly 50% of CEOs actively seek additional product or service information after watching a related video, highlighting the video’s influence on decision-making.
- Around 65% of marketers plan to increase mobile advertising budgets to integrate video-focused campaigns.
- About 76% of marketers aim to expand their use of YouTube and video marketing as part of their core promotional strategies.
- HTML5 currently supports roughly 74% of the global internet ecosystem, enabling smoother, more compatible video delivery.
- Approximately 45.4% of internet users watch at least one online video each month.
- The average user spends over 16 minutes per month viewing online video advertisements, reflecting steady exposure to video ads.
- Nearly 80% of consumers recall seeing a video advertisement within the last 30 days, indicating strong ad memorability.
- Around 75% of users who watch online videos each month interact with at least one video advertisement.
- About 80% of internet video advertisements are skipped or abandoned within the first half of the ad duration.
- Nearly 20% of viewers stop watching a video within the first 10 seconds, emphasizing the importance of strong opening visuals.
- Real estate listings featuring video content generate approximately 40.3% more customer inquiries than listings without video.
Moreover
- Comedy is the most preferred online video genre, selected by about 39% of viewers worldwide.
- Exposure to video advertising increases brand association by roughly 139% and purchase intent by about 97%.
- Video commercials account for nearly 35% of total global internet advertising expenditure.
- Viewers retain about 95% of a message delivered through video, compared to just 10% when the same message is presented in print.
- Animated explainer videos are used by approximately 59% of marketers to promote products and services.
- Around 85% of consumers say they want to see more video content from businesses, reinforcing video’s role in customer engagement.
- Websites featuring video content increase average visit duration from 8 seconds to nearly 2 minutes and are about 53 times more likely to appear in search results.
- Consumers spend an average of 100 minutes per day watching online videos, with video accounting for more than 82% of total internet traffic by 2022.
- The volume of ad-supported videos has increased by approximately 800% globally, while about 64% of viewers report making purchases after seeing branded social media videos.
- The median age of animators is around 40, representing roughly 47% of the workforce.
- A bachelor’s degree is the most common qualification among animators, held by nearly 70% of professionals in the field.
(Source: Forbes, eMarketer, Social Media Examiner, ComScore, HubSpot, Unruly, Break Media, CustomerThink, Tubular Insights, and global animation workforce studies)
How Innovation and Collaboration Are Reshaping Animation Production
- More than 55% of animation studios reported higher revenues in 2022 compared with the previous year. Indicating strong commercial momentum across the sector.
- The annual output of animated television shows has increased by approximately 25% over the last five years, driven by rising demand on platforms.
- The highest production spend recorded for an animation-heavy film is nearly $379 million. Reflecting the scale of investment in premium visual effects.
- Around 45% of animated films are now created using computer-generated imagery, highlighting its mainstream adoption.
- Nearly 70% of professional animators worldwide favour open-source tools, citing flexibility and cost efficiency.
- The average budget for a feature-length animated film reached about $128 million in 2023, reflecting higher production quality standards.
- Japan leads global animation output by volume, producing close to 4,000 anime titles annually.
- More than 60% of animated content is now designed specifically for streaming platform audiences.
- International co-production has become the norm, with over 75% of animated series involving cross-border collaboration.
- Successful animated television franchises typically run for an average of 6 seasons, indicating long-term audience engagement.
Further
- The use of artificial intelligence in animation production rose by about 40% in 2023. Mainly supporting rendering and character design tasks.
- Over 35% of animated films released in 2023 integrated augmented reality elements to enhance viewer experience.
- Animating one minute of high-quality 3D content costs approximately $15,000, underscoring the capital-intensive nature of production.
- The dominant animation styles in 2023 were 3D animation (60%), 2D animation (30%), and stop motion (10%).
- Nearly 48% of animated feature films released in 2023 featured diverse casts, reflecting broader inclusion efforts.
- Virtual production techniques helped reduce overall animation production timelines by about 25% in 2023.
- Motion capture usage increased by roughly 30% in 2023, particularly in video game-related animation projects.
- About 50% of animated series produced in 2023 focused on social awareness or educational themes.
- Close to 70% of animation studios increased spending on cloud-based rendering solutions in 2023.
- The share of independent animators grew by around 12% in 2023, supported by accessible tools and digital platforms.
- User-generated animation accounted for nearly 38% of all animated content consumed in 2023.
Moreover
- Female-led animation projects increased by approximately 20% between 2018 and 2023, indicating progress in gender representation.
- More than 90% of major animation studios have integrated eco-friendly practices into their production processes.
- Adoption of 4K resolution in animation workflows increased by about 35% in 2023, enhancing visual fidelity.
- The average production time for a full-length animated film declined from 5 years in 2018 to roughly 3.5 years in 2023, driven by technological advancements.
- Autodesk Maya remained the most widely used animation pipeline software in 2023, adopted by over 70% of studios.
- Direct-to-streaming animated feature releases increased by around 25% in 2023, reflecting shifting distribution strategies.
- Approximately 65% of animation studios now use real-time rendering technologies to accelerate production workflows.
- The number of new female-led animated series rose by about 22% between 2018 and 2023.
- The average animated series in 2023 featured around 15 characters, supporting more complex narrative structures.
(Source: Zipdo, Statista)
Global Animation Workforce Demographics and Employment
- Women represent approximately 36% of the global animation workforce, indicating gradual progress toward gender balance within the industry.
- The number of female directors working in animation has increased by around 15% since 2018, reflecting expanding leadership opportunities.
- Disney Animation Studios is the largest animation employer globally, with a workforce exceeding 10,000 professionals.
- The animation industry is projected to generate more than 1.5 million new jobs worldwide by 2025, driven by rising content demand and digital expansion.
- In 2023, over 60% of animation professionals aged 30–45 had completed formal higher education in animation or related creative disciplines.
- In the US, the average annual salary for professional animators reached approximately $77,000 in 2023. With higher earnings concentrated in major production hubs such as Los Angeles and New York.
(Source: Zipdo, Statista)
Conclusion
Animation industry statistics point to a dynamic, steadily expanding sector driven by digital-first consumption, continuous technological innovation, and a broadening global reach.
Growth in content production, streaming activity, and mobile engagement confirms animation’s growing role across entertainment, education, gaming, and marketing applications.
Increasing reliance on computer-generated imagery, cloud-based workflows, and open-source tools is enhancing production efficiency while supporting higher creative quality. Asia Pacific remains the leading hub for animation activity, while mature markets continue to generate strong value through high-budget and premium content.
Taken together, these statistics reflect an industry positioned for sustained growth, rising talent demand, and long-term impact across the global media landscape.
FAQ’s
Animation industry statistics refer to structured data that explain how the animation industry, as a creative and commercial sector, performs over time. They describe patterns related to production activity, market expansion, workforce composition, technological adoption, and audience consumption across different animation formats and platforms.
These statistics provide a factual basis for analysing industry behavior and long-term trends. They support theoretical assessment of how creative industries evolve in response to technological change, shifts in media consumption, and globalization.
Growth is influenced by factors such as digital media diffusion, technological innovation cycles, content globalization, and changing consumer behavior. Animation statistics help illustrate how these forces interact within the broader media ecosystem.
Technology determines production efficiency, creative capability, and scalability. Statistics on CGI adoption, cloud workflows, and AI integration reveal how technological frameworks shape industry structure and competitiveness.
Regional data highlight variations in production capacity, labor availability, cultural content demand, and infrastructure development. These differences explain why certain regions emerge as dominant hubs of production or consumption.