
Introduction
Average Screen Time Statistics: In the modern digital era, screens have become integral to the way people work, study, communicate, and consume entertainment, with average screen time rising steadily due to rapid technological adoption, the expansion of streaming and social media platforms, and the increasing prevalence of remote work and online learning.
Analyzing these statistics is vital for sectors such as technology, healthcare, education, advertising, and policy-making, as they provide insights into consumer behavior while drawing attention to issues like eye strain, declining productivity, and mental health challenges.
This report explores the most recent global and regional patterns, demographic variations, and key drivers of screen usage, delivering evidence-based insights to support strategic planning, informed policy decisions, and initiatives aimed at fostering healthier digital habits.
Editor’s Choice
- People worldwide spend about 6 hours and 40 minutes on screens each day.
- In the US, average daily screen time has reached 7 hours and 3 minutes.
- 41% of teenagers spend more than 8 hours on screens each day.
- South Africans average 9 hours 24 minutes of daily screen time, the highest globally.
- The average person spends 2 hours and 24 minutes per day on social media.
- The average Gen Z person spends about 7 hours and 18 minutes per day on screens, with some estimates reaching 9 hours.
- An average American checks their phone 96 times each day.
- Nearly half (41%) of American teenagers aged 13–18 have screen time exceeding 8 hours daily.
- Entertainment screen time among US children increased from 4 hours 44 minutes in 2019 to 5 hours 33 minutes in 2021.
- South Africans spend 2 hours and 59 minutes more than the global average on screens.
- Daily screen time has risen by over 30 minutes since 2013.
- Almost half (49%) of children aged 0–2 interact with smartphones.
Average Screen Time Statistics
- As of 2025, individuals average 6 hours 40 minutes of screen time each day, adding up to 46 hours 40 minutes per week.
- By Q3 2023, daily usage ticked up to 6 hours 40 minutes, though annual change data for this year was unavailable.
- However, in Q3 2022, average screen time fell notably to 6 hours 36 minutes, the steepest decline in the period at -5.1%.
- The upward trend continued into Q3 2021, with usage reaching 6 hours 58 minutes, a slight 0.8% gain over the previous year.
- In Q3 2020, screen time rose sharply to 6 hours 54 minutes, up 4.2%, largely driven by heightened digital activity during the pandemic.
- By Q3 2019, this figure had decreased to 6 hours 38 minutes, marking a 2.4% drop year-over-year.
- In Q3 2018, the average daily screen time stood at 6 hours 48 minutes, reflecting a modest 0.4% increase from the year before.
(Source: DemandSage, Statista)
Average Daily Screen Time by Activity
- On average, individuals spend 3 hours and 16 minutes each day watching television or online videos.
- Gaming contributes approximately 1 hour and 46 minutes to daily screen usage.
- Time spent on social media averages 1 hour 27 minutes per day.
- Website browsing consumes about 51 minutes of daily screen time.
- Miscellaneous screen-based activities account for 29 minutes each day.
- Video chatting takes up around 20 minutes per day.
- E-reading is engaged in for roughly 15 minutes daily.
- Content creation occupies about 14 minutes of daily screen use.
(Source: Statista, Enterprise Apps Today, DemandSage)
Smartphone Screen Time by Country
- People in the Philippines spend an average of 5 hours and 20 minutes on smartphones each day, which is 1 hour and 30 minutes above the global average.
- In Brazil, daily smartphone use reaches 5 hours 19 minutes, surpassing the global average by 1 hour 29 minutes.
- South Africans log about 5 hours and 15 minutes of daily smartphone time, 1 hour and 25 minutes more than average.
- Smartphone users in Thailand average 5 hours 2 minutes a day, exceeding the global benchmark by 1 hour 12 minutes.
- In Ghana, daily smartphone engagement is 4 hours 58 minutes, 1 hour 8 minutes higher than average.
- Chile records 4 hours 48 minutes of smartphone use per day, which is 58 minutes above the global norm.
- Colombia’s average stands at 4 hours 47 minutes daily, 57 minutes beyond the global average.
- In Indonesia, smartphone time totals 4 hours 45 minutes per day, 55 minutes above the average.
- Argentina and Malaysia both average 4 hours 37 minutes daily, 47 minutes more than the global figure.
- Kenya’s daily smartphone usage is 4 hours 36 minutes, 46 minutes higher than average.
- In the UAE, people spend 4 hours 34 minutes on smartphones each day, which is 44 minutes above the global norm.
(Source: Cropink, Statista, DemandSage)
Laptop Screen Extender Market Size
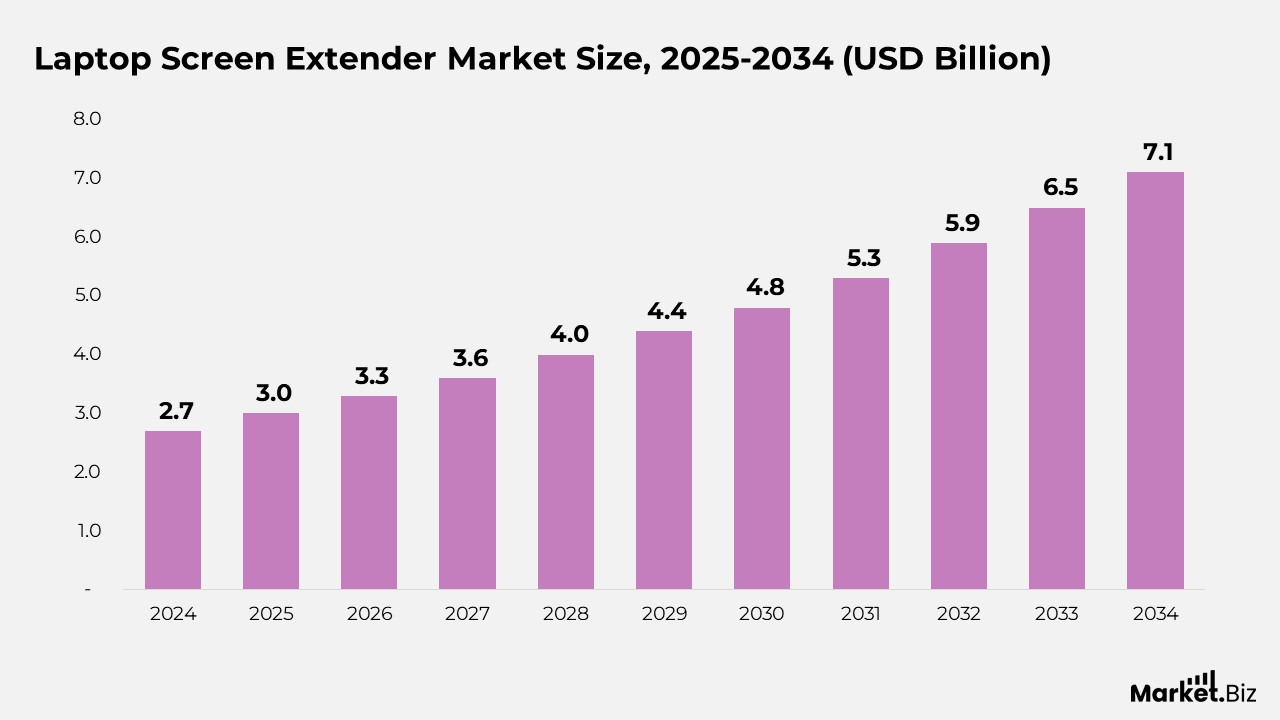
- According to Market.us, the laptop screen extender market is projected to rise from $3.0 billion in 2025 to $7.1 billion by 2034, representing a compound annual growth rate (CAGR) of 10.2% from 2025 to 2034.
- The Laptop Screen Extender Market is experiencing rapid growth as hybrid and remote work arrangements reshape workspace requirements, driving strong demand for portable, multi-screen solutions that enhance productivity and flexibility.
- In 2024, North America dominated the market with a 37.4% share (USD 1 billion), supported by high levels of technology adoption, a well-established remote work culture, and growing interest in portable productivity tools.
- The US segment, valued at USD 0.85 billion in 2024 with a projected CAGR of 8.8%, is thriving due to the expansion of freelance work, the rise of online learning, and a tech-savvy consumer demographic.
- Transportable Laptop Screen Extenders accounted for 64.7% of the global market in 2024, driven by innovations in lightweight materials, sleek and compact designs, and broad compatibility with multiple devices.
- The 12–15 inches size category secured 42.6% market share in 2024, attracting professionals, students, and creatives with its portability, ergonomic fit for standard laptops, and balanced screen space for productivity.
- Wired Laptop Screen Extenders held a dominant 70.7% share in 2024, favored for their stable connections, superior video quality, and suitability for demanding tasks such as graphic design, gaming, and corporate presentations.
- Offline sales channels contributed 60.2% of total market revenue in 2024, benefiting from the ability to offer hands-on product evaluation, enabling buyers to assess display quality, durability, and portability before purchase.
- Professionals represented 38.7% of the user base in 2024, with sectors like IT, finance, and creative design increasingly integrating multi-screen setups to improve multitasking capabilities and decision-making speed.
(Source: Market.us)
Multi-Screen Advertising Market Size
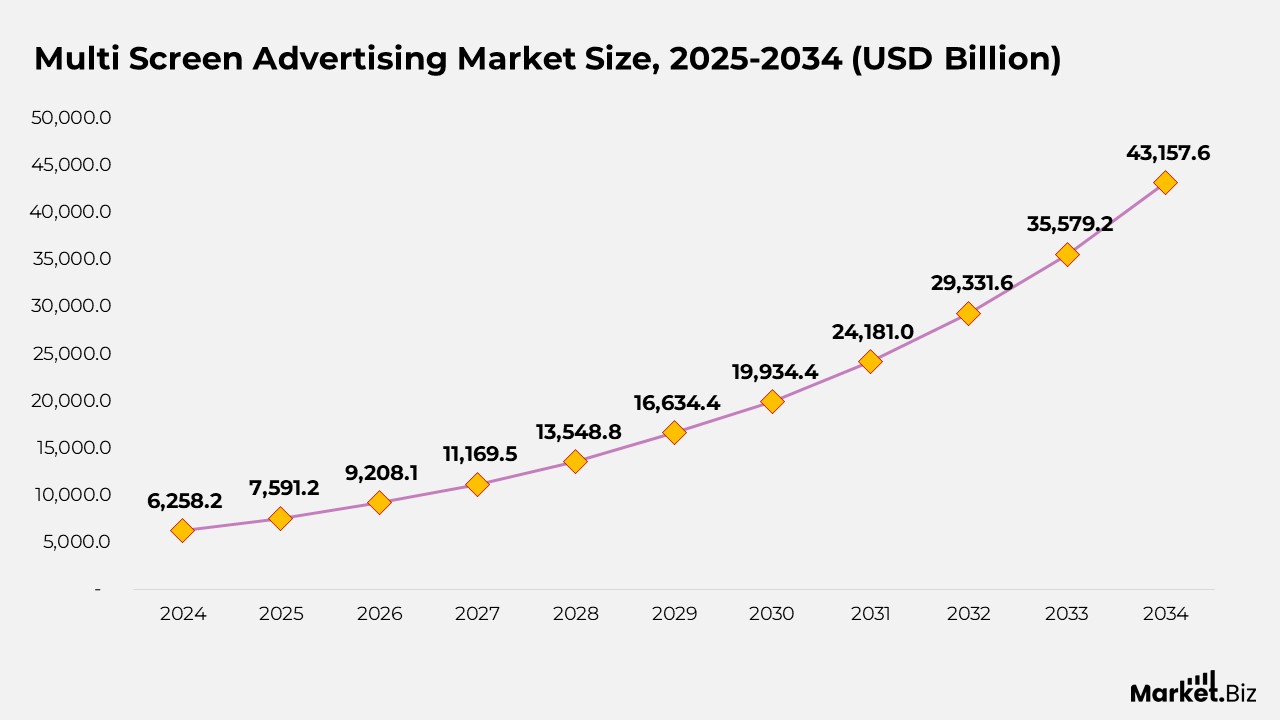
- According to Market.us, the multi-screen advertising market is expected to rise from $7,591.2 million in 2025 to $43,157.6 million by 2034, representing a compound annual growth rate (CAGR) of 21.3% from 2025 to 2034.
- The market is expanding due to the adoption of programmatic advertising, real-time bidding, and cross-device tracking, enabling automated, efficient, and highly targeted multi-screen campaigns.
- In 2024, the Software segment dominated with a 64% global share, driven by the rapid uptake of automation platforms for managing ads across multiple screens.
- The Mobile/Tablet segment held over 45% market share in 2024, fueled by rising smartphone and tablet penetration, especially in Asia-Pacific, North America, and Latin America.
- The Dynamic content segment led with a 51% share in 2024, supported by advertisers’ preference for real-time, personalized content tailored to user behavior, location, and device.
- In-app ads accounted for more than 35% of the market in 2024, benefiting from increased time spent on apps for entertainment, gaming, social media, and e-commerce.
- The U.S. Multi-Screen Advertising Market reached USD 2,252.1 million in 2024, driven by cross-platform campaigns spanning smartphones, tablets, laptops, and smart TVs.
- North America captured over 38% of the global market in 2024, generating revenues above USD 2,378 million due to high digital adoption, smart device penetration, and advanced advertising infrastructure.
(Source: Market.us)
Average Daily Screen Time on Streaming Platforms
- Viewers spend an average of 2 hours and 10 minutes streaming content on Hulu each day.
- Netflix users log around 1 hour and 50 minutes of daily viewing time.
- Amazon Prime members dedicate approximately 1 hour and 37 minutes per day to streaming.
- Disney+ audiences watch for about 1 hour and 29 minutes daily.
(Source: Cropink, Slicktext.com, DemandSage)
Year-on-Year Changes in Screen Time Allocation
- Time spent using the internet increased from 6 hours 54 minutes in Q3 2020 to 6 hours 58 minutes in Q3 2021, marking a 1% rise.
- Watching TV, including streaming services, declined slightly from 3 hours 24 minutes to 3 hours 20 minutes, a 2% drop.
- Social media usage rose marginally from 2 hours 25 minutes to 2 hours 27 minutes, reflecting a 1.4% increase.
- Gaming on consoles inched up from 1 hour 11 minutes to 1 hour 12 minutes, also a 1.4% gain.
(Source: Cross River Therapy, Statista)
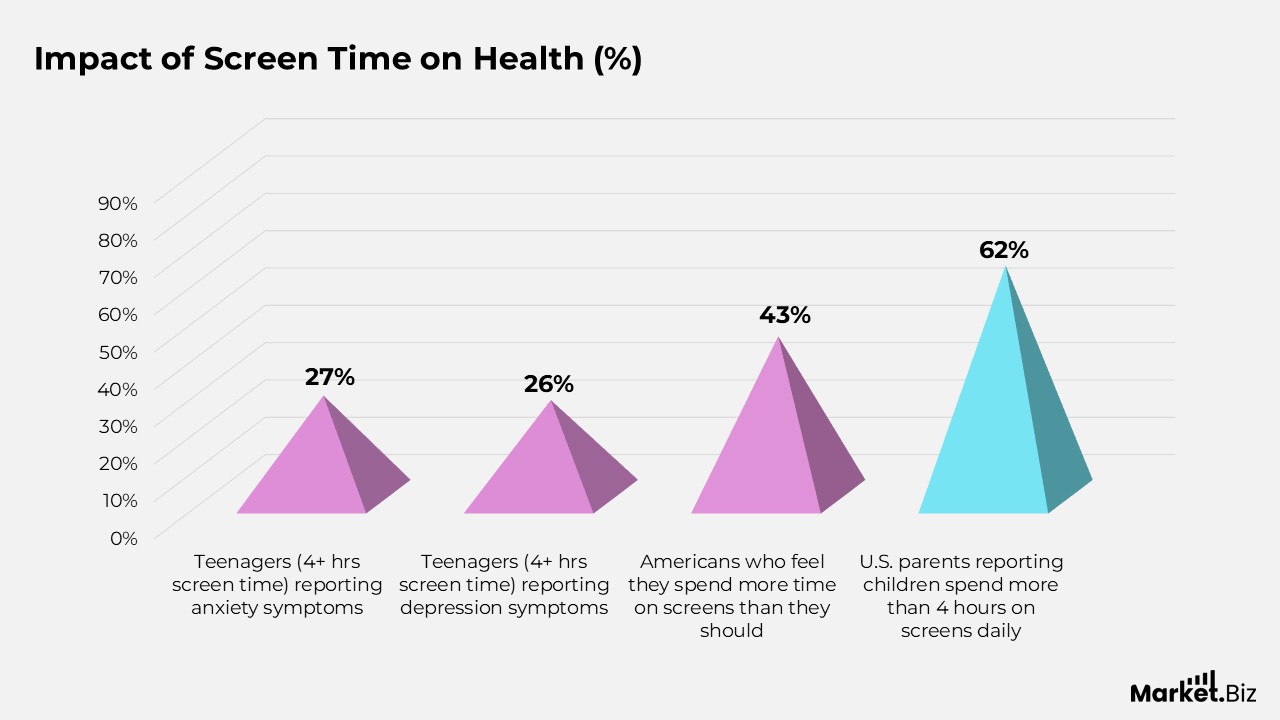
Impact of Screen Time on Health
- Research shows that 27.1% of teenagers who spend 4 or more hours on screens daily report experiencing anxiety symptoms, while 25.9% report symptoms of depression.
- Teenagers from lower-income households average 9 hours 19 minutes of daily screen use, substantially more than their higher-income peers.
- People who check screens immediately after waking experience stress levels 23.52% higher than those who delay screen use.
- Around 43% of Americans feel they spend more time on screens than they should, reflecting growing concern over digital dependency.
- A significant 62% of US parents report that their children spend more than 4 hours on screens each day.
(Source: Magnet ABA Therapy, Cross River Therapy)
Daily Social Media Usage Among Children
- On average, children spend 1 hour and 53 minutes each day on TikTok, making it their top social media platform.
- Daily Snapchat use among children averages 1 hour and 30 minutes.
- Children spend approximately 20 minutes per day on Pinterest.
- Facebook sees comparatively low engagement, with children averaging 18 minutes of daily use.
- Reddit usage among children is about 13 minutes per day.
- Twitter ranks lowest, with children spending roughly 10 minutes daily on the platform.
(Source: Statista, explodingtopics.com, DemandSage)
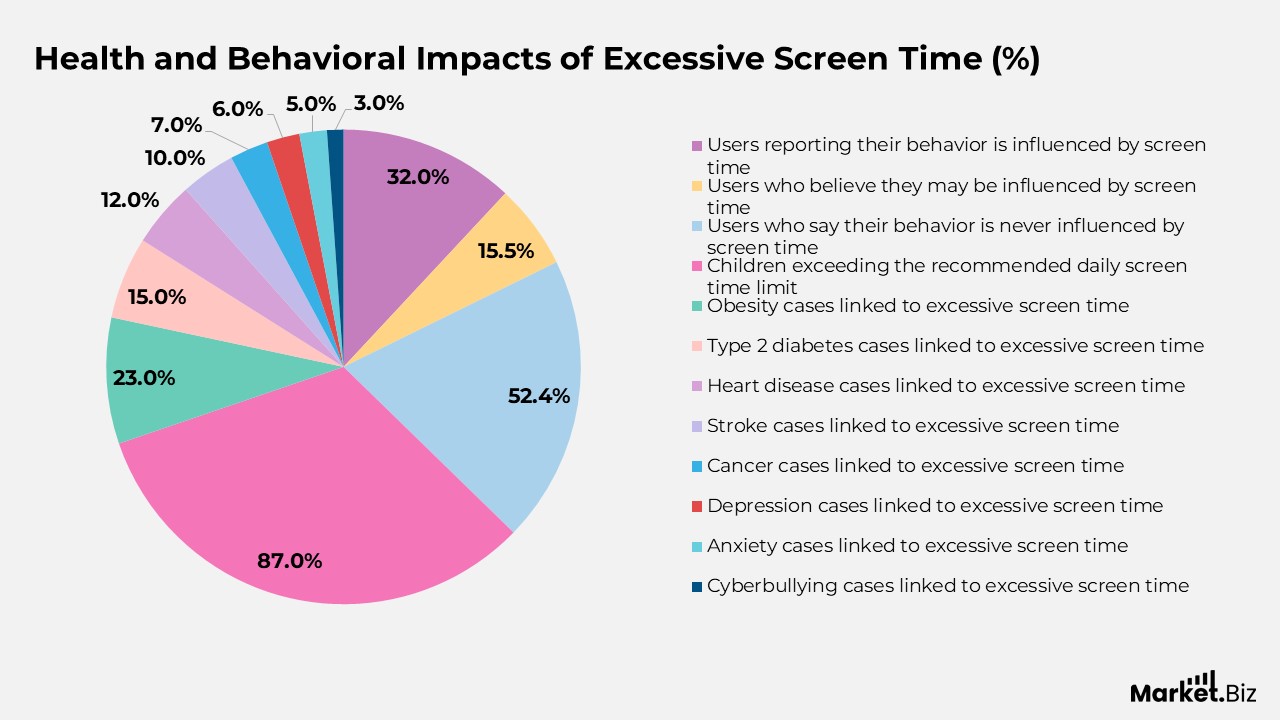
Health and Behavioral Impacts of Excessive Screen Time
- The recommended daily screen time is two hours, while children under two years old should have no screen exposure.
- 32% of users report that their behavior is influenced by screen time.
- 15.5% of users believe they may be influenced by screen time.
- 52.4% say their behavior is never influenced by screen time.
- 87% of children exceed the recommended daily screen time limit.
- Obesity is the most common health issue linked to excessive screen time, accounting for 23% of cases.
- Type 2 diabetes is associated with 15% of excessive screen time cases.
- Heart disease is linked to 12% of cases caused by high screen use.
- Stroke accounts for 10% of health issues tied to excessive screen time.
- Cancer is associated with 7% of excessive screen time cases.
- Depression is reported in 6% of cases linked to high screen usage.
- Anxiety is connected to 5% of excessive screen time cases.
- Cyberbullying affects 3% of individuals due to excessive screen time.
(Source: researchgate.net, headphonesaddict.com, DemandSage)
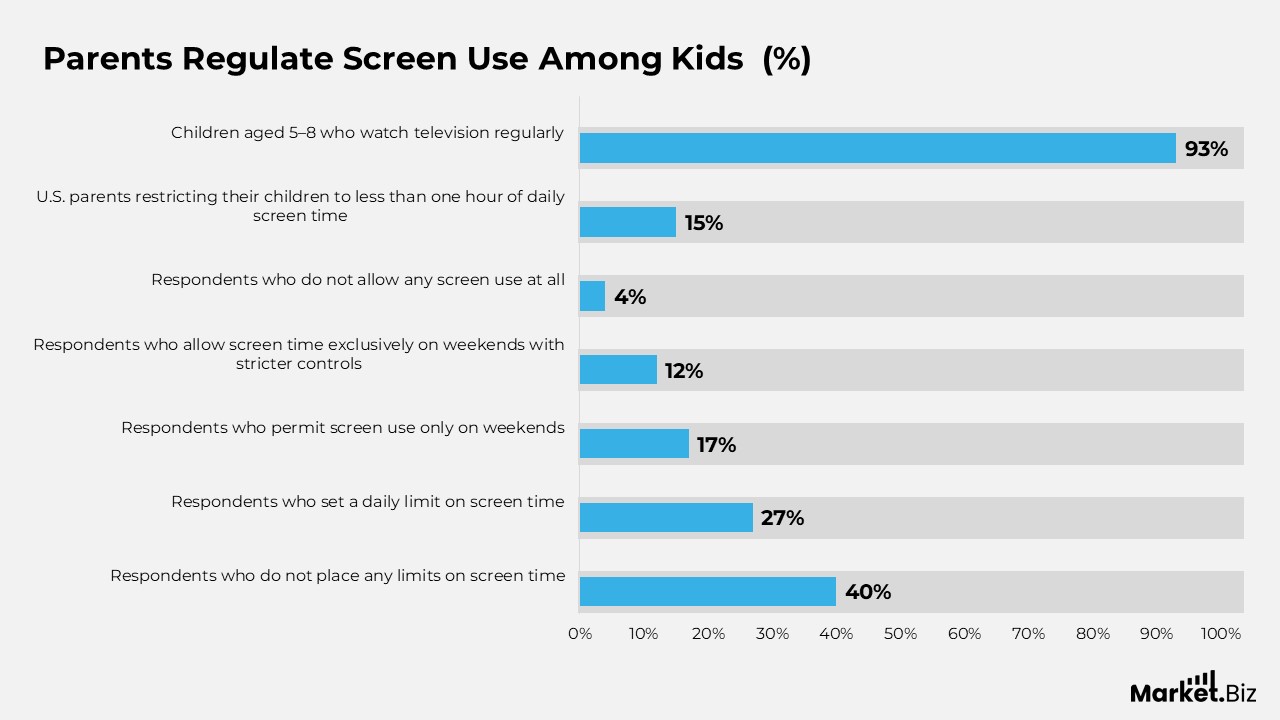
How Parents Regulate Screen Use Among Kids
- 40% of respondents reported that they do not place any limits on screen time.
- 27% set a daily limit on the amount of screen time allowed.
- 17% permit screen use only on weekends.
- 12% allow screen time exclusively on weekends with stricter controls.
- 4% do not allow any screen use at all.
- In the United States, 15% of parents restrict their children to less than one hour of screen time per day.
- 93% of children aged 5 to 8 watch television regularly.
(Source: explodingtopics.com, Statista)
Screen Time Patterns Across Age and Gender
- . The 16–24 age group, females average 7 hours 35 minutes of daily screen time, compared to 7 hours 11 minutes for males.
- Among those aged 25–34, females spend about 7 hours 17 minutes per day on screens, while males average 7 hours 13 minutes.
- For individuals aged 35–44, females record 6 hours 43 minutes of daily screen time, slightly higher than males at 6 hours 37 minutes.
- In the 45–54 age bracket, females average 6 hours 7 minutes per day, with males close behind at 6 hours 4 minutes.
- Among those aged 55–64, males spend approximately 5 hours 21 minutes daily on screens, slightly more than females at 5 hours 18 minutes.
- In the 65+ category, females average 4 hours 7 minutes of screen time each day, compared to 3 hours 59 minutes for males.
(Source: Semrush Inc, DemandSage)
Conclusion
Average screen time has become a defining feature of modern life, reflecting how deeply technology is woven into daily routines. Usage patterns vary widely across regions, age groups, and activities, spanning entertainment, social media, work, education, and creative pursuits.
While the growing reliance on screens offers unparalleled opportunities for connection, learning, and productivity, it also raises concerns about physical health, mental well-being, and overall lifestyle balance. This trend highlights the importance of encouraging mindful technology use. Fostering healthier digital habits and ensuring that screen time serves to enhance rather than diminish the quality of life.
FAQ’s
Keeping track of screen time reveals patterns in how technology is used, helps assess its impact on productivity and well-being, and supports the development of strategies for healthier digital habits.
In recent years, screen time has seen consistent growth, fueled by remote work, online education, social media engagement, and the increasing popularity of streaming and gaming.
Variables such as age, profession, lifestyle choices, device availability, and cultural influences all shape how much time people spend in front of screens.
Setting boundaries, taking regular breaks, engaging in offline activities, and using tools to monitor usage can help achieve a healthier balance.
Screens are now deeply embedded in everyday life, and while they offer many benefits, intentional and mindful use is crucial to ensure they enhance rather than diminish the quality of life.