
Introduction
Sports Tourism Statistics: From exciting stadiums filled with adrenaline to tranquil golf resorts, the flourishing sports tourism sector is revolutionizing our travel experiences, one game, race, and match at a time. The worldwide sports tourism market was valued at nearly 565 billion U.S. dollars in 2023 and is projected to exceed 1.3 trillion U.S. dollars by 2032. Indeed, it was estimated that sports tourism accounted for approximately 10% of global tourism spending as of 2025.
In the United States, the sports sector encompasses far more than just the action on the field – it represents a vast realm of entertainment. For instance, the Super Bowl stands as one of the most significant sporting occasions on the calendar, attracting numerous viewers who tune in not only for the game itself but also for the halftime performance and the renowned commercials.
In 2024, the sports events industry in the United States generated a direct economic impact exceeding 47 billion U.S. dollars. A considerable number of fans travel from other states or even from overseas to partake in the excitement and grandeur of an American sporting event.
Editor’s Choice
- Sports travelers, event organizers, and venues collectively spent $9.7 billion on transportation, $8.4 billion on accommodations, and $7.5 billion on food and beverages.
- Over 30% of tourists in 2023 participated in some form of sporting activity during their travels.
- The growth trend continued in 2024, with revenues reaching USD 685.0 billion.
- A notable increase was observed in 2025 as the market grew to USD 831.0 billion.
- Switzerland, with a health index of 90.93, has 71.8% of its population participating in sports and 4.31 medals per 100,000, leading to a score of 68.6, with football (soccer) as the favored sport.
- Adult and amateur events also enjoyed significant popularity, occurring in 94% of locations.
- In 2021, there were notable variations in the funding sources for sports tourism organizations, which were influenced by their budget size.
What is Sports Tourism?
Sports tourism refers to the act of traveling to a location with the purpose of engaging in a sporting activity or event. Many individuals assume that sports tourism is solely about observing a sporting event. However, this assumption is inaccurate. The sports industry encompasses far more than that. Sports tourism includes travel for sporting reasons in its own right, such as enrolling in a yoga teacher training program, competing in a padel tournament, learning to surf, or participating in a marathon.
Additionally, sports tourism involves attending sporting events like a Formula One race or a La Liga football match – a sector with growing potential due to the emerging concept of ‘Sportainment’. It also covers nostalgic trips to historically significant sites, such as the Olympic stadium in Greece, or visiting places that showcase memorabilia related to your favorite sports icon, like the museum at the renowned Santiago Bernabeu stadium.
General Sports Tourism Statistics
- The sports tourism sector had an economic impact of $91.8 billion in 2021, with direct expenditures amounting to $39.7 billion. This industry supported 635,000 jobs and generated $12.9 billion in tax revenue.
- In 2021, the sports tourism sector saw a strong recovery from the COVID-19 pandemic, with the number of sports travelers increasing by 82% compared to the previous year, totaling 175 million. This figure was only 2.6% lower than the peak levels recorded in 2019.
- Sports travelers, event organizers, and venues collectively spent $9.7 billion on transportation, $8.4 billion on accommodations, and $7.5 billion on food and beverages.
- Accommodations played a crucial role, representing 21% of all expenditures related to sports travel and resulting in 66.5 million room nights.
Moreover
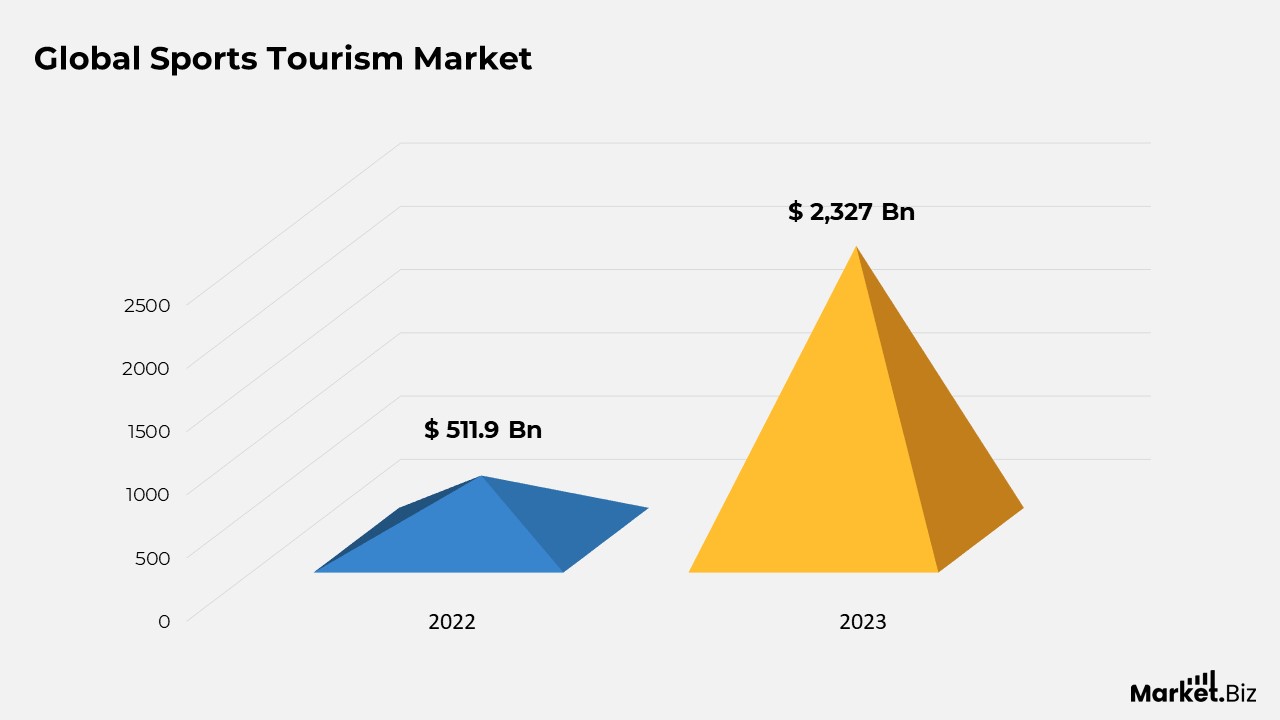
- The global sports tourism market is anticipated to reach approximately $2,327 billion by 2032, a significant increase from $511.9 billion in 2022, with a compound annual growth rate (CAGR) of 16.8% projected from 2023 to 2032. This growth is fueled by international sporting events such as the Paris Olympics and Formula 1.
- Europe stands as the largest market for sports tourism, accounting for 38.01% of global revenue. For instance, Spain welcomed 4.8 million sports tourists in 2021, with 57% of the revenue derived from active tourists engaging in sports.
- In India, the sports tourism sector is gaining momentum, with 71% of Indians indicating a willingness to travel to support their favorite teams and athletes. The nation ranks among the top five countries making bookings for the Paris Olympics 2024.
- Over 30% of tourists in 2023 participated in some form of sporting activity during their travels.
- FIFA’s revenue reached a peak of USD 5,769.21 million in 2022. The opening ceremony of the 2012 London Olympics recorded the highest viewership in the U.S., attracting 40.7 million viewers.
Sports Tourism Market Size
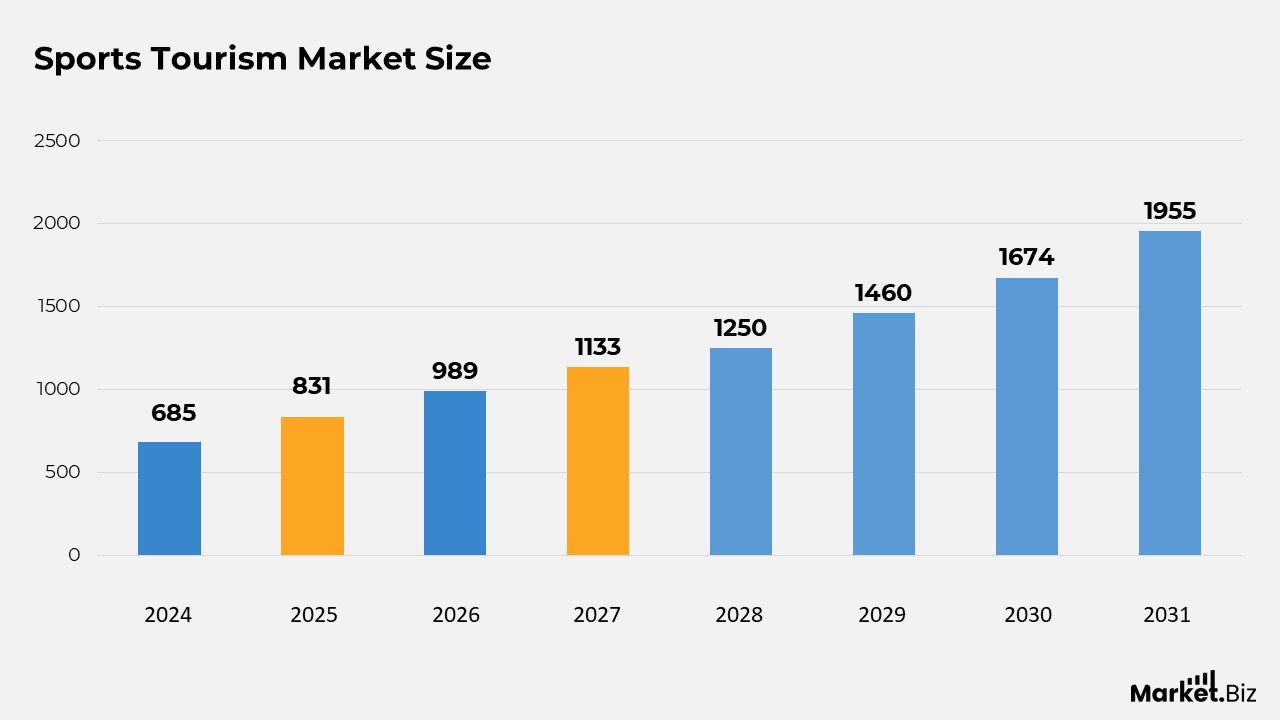
- The global sports tourism sector has experienced remarkable expansion over the years, achieving a compound annual growth rate (CAGR) of 16.80%, with revenue figures demonstrating a strong upward trajectory.
- In 2022, the market revenue was noted at USD 511.9 billion. This amount increased to USD 598.0 billion in 2023, signifying a considerable rise.
- The growth trend continued in 2024, with revenues reaching USD 685.0 billion.
- A notable increase was observed in 2025 as the market grew to USD 831.0 billion.
- The upward trend persisted steadily, with revenues reaching USD 989.0 billion in 2026 and USD 1,133.0 billion in 2027.
- By 2028, the market had expanded to USD 1,250.0 billion, followed by a further rise to USD 1,460.0 billion in 2029.
- The momentum continued into 2030, with revenues hitting USD 1,674.0 billion.
- In 2031, the market surged to USD 1,955.0 billion, culminating in a projected revenue of USD 2,327.0 billion by 2032.
Olympic Sports Tourism Viewership
- The Summer Olympics opening ceremony in the United States attracted nearly 40.7 million viewers, marking the highest viewership for the 2012 London Games.
- A considerable audience also tuned in for the Atlanta Games in 1996, which drew approximately 39.77 million spectators.
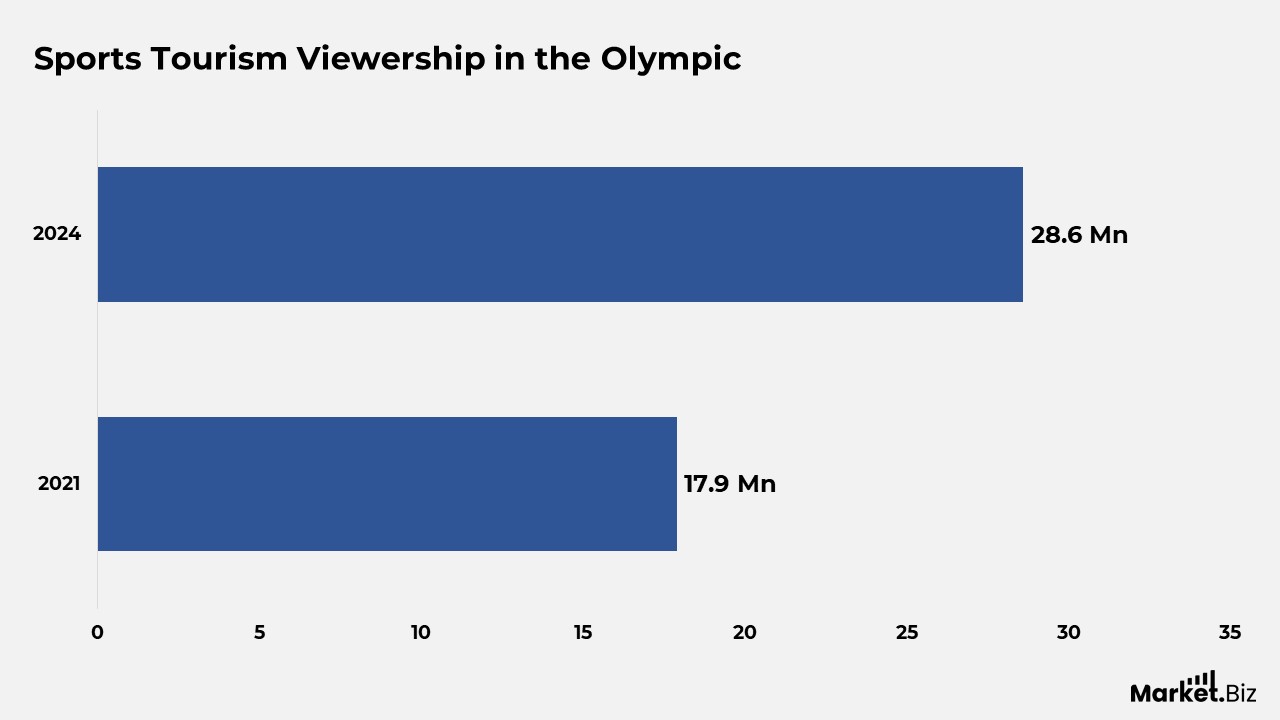
- In contrast, the 2021 Tokyo Games recorded the lowest viewership with 17.9 million viewers, likely due to the COVID-19 pandemic and the absence of in-person attendees.
- However, the 2024 Paris Games experienced a notable increase in viewership, reaching 28.6 million viewers compared to the 2021 Tokyo Games.
- According to sports tourism data, it can be deduced that viewership has varied significantly, with peaks often occurring during periods of Olympic enthusiasm or events held in countries that share close historical and cultural ties with the United States.
Sports Travellers Statistics
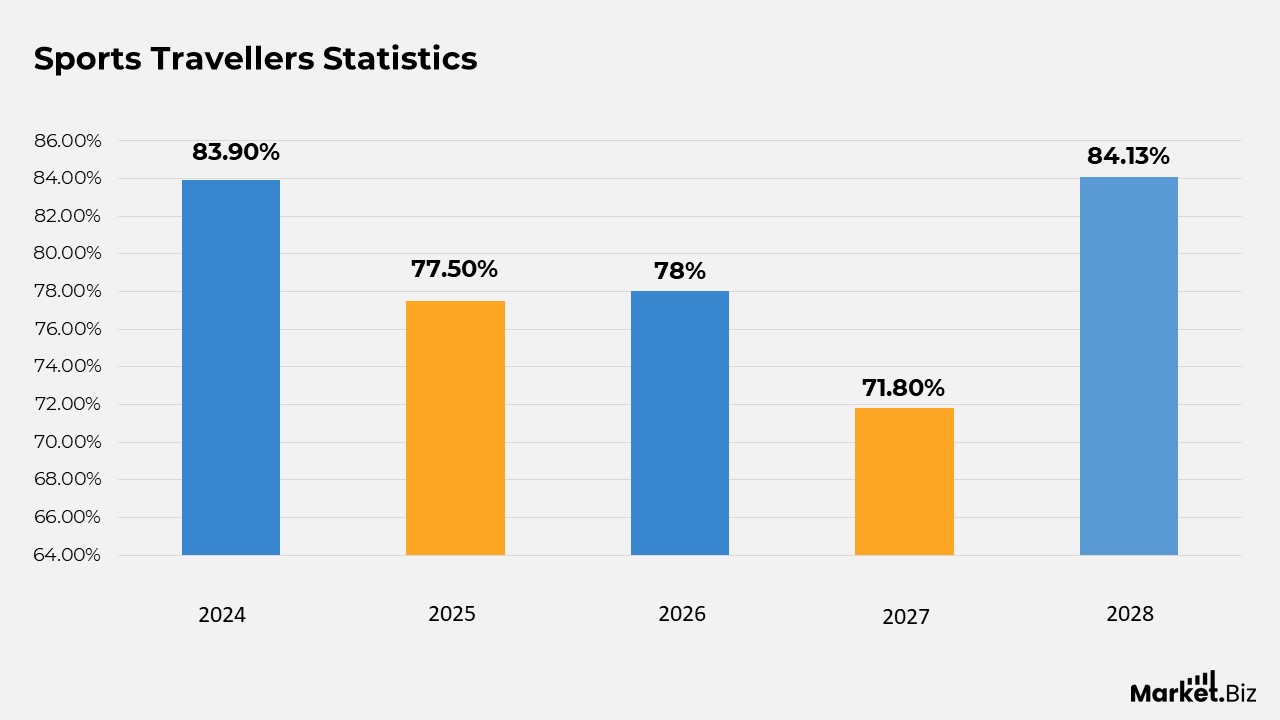
- Norway ranks first with a Bloomberg Health Index of 89.09, showcasing an impressive 83.9% of its population engaged in sports, and achieving 10.31 medals per 100,000 individuals, which culminates in a high overall score of 90.3. The most favored sport is football (soccer).
- Finland is in second place with a health index of 85.89, where 77.5% of the population participates in sports, earning 8.74 medals per 100,000, and achieving a score of 82.2, with ice hockey being the preferred sport.
- Sweden presents the highest health index at 90.24, with 78% of its population participating in sports and securing 6.41 medals per 100,000, resulting in a score of 76.9, while football (soccer) is the most popular sport.
- Switzerland, with a health index of 90.93, has 71.8% of its population participating in sports and 4.31 medals per 100,000, leading to a score of 68.6, with football (soccer) as the favored sport.
- Australia holds a health index of 89.75, having the highest sports participation rate at 84.1%, yet only achieving 2.11 medals per 100,000, which results in a score of 66.7, with Australian football being the most popular sport.
Statistics of Sports Tourism Events
- In 2021, a wide collection of sports tourism events took place across numerous locations, demonstrating the extensive appeal of the industry.
- Youth events were the most common, with 97% of locations hosting such activities, underscoring the strong importance of involving younger athletes.
- Adult and amateur events also enjoyed significant popularity, occurring in 94% of locations.
- Collegiate sports events were organized by 83% of locations, highlighting the significance of competitions at the university level.
- Senior sports events were conducted in 53% of locations, reflecting a moderate level of engagement with this age group.
- International events were arranged by 43% of locations, showcasing the global attraction and reach of sports tourism.
- Events sanctioned by the United States Olympic & Paralympic Committee (USOPC) were hosted by 39% of locations, highlighting the importance of activities related to the Olympics.
- Lastly, other types of events made up 6% of the locations, representing niche or specialized sporting activities.
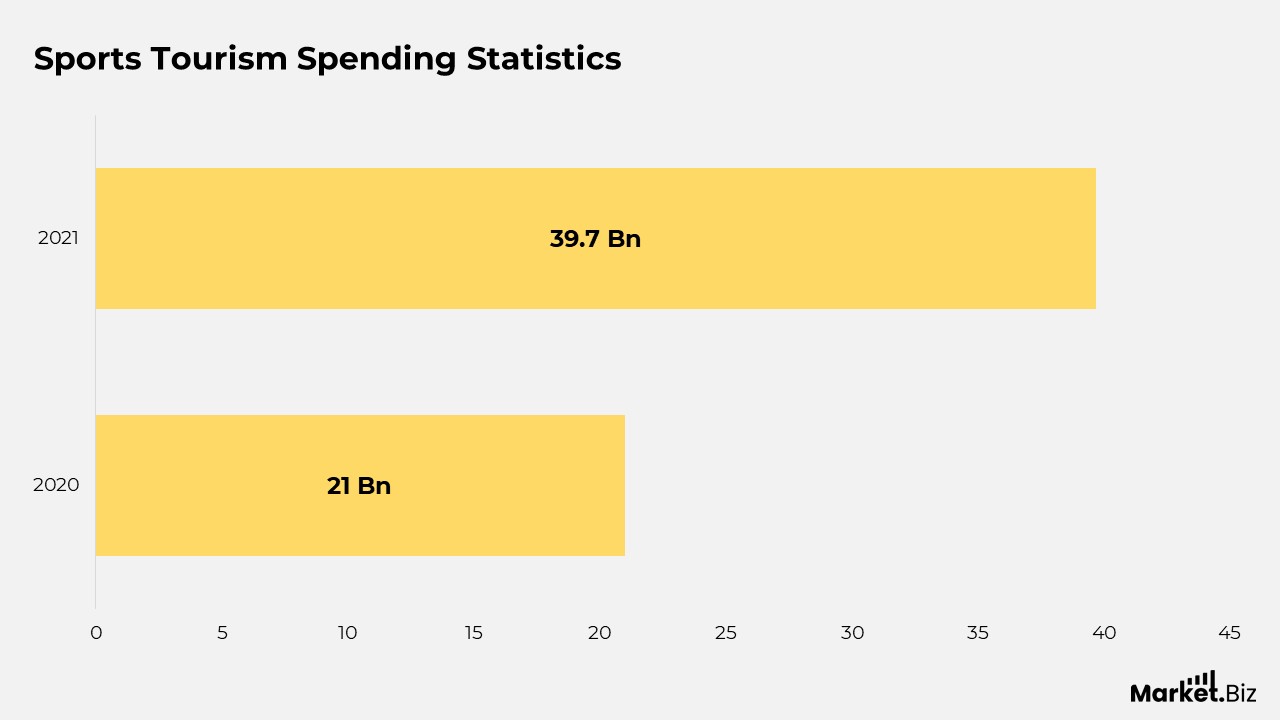
Sports Tourism Spending Statistics
- The global expenditure on sports-related travel has experienced significant variations from 2015 to 2021.
- In 2015, the expenditure stood at USD 38.7 billion, remaining unchanged from the prior year.
- This amount increased to USD 39.4 billion in 2016, indicating a 1.80% rise.
- The upward trajectory persisted more vigorously in 2017, with expenditures reaching USD 41.4 billion, signifying a 5.20% growth.
- In 2018, the growth rate saw a slight decline, with expenditures at USD 42.9 billion, which represented a 3.60% increase.
- The year 2019 experienced another 5.20% increase, elevating the expenditure to USD 45.1 billion.
- However, 2020 marked a significant downturn due to the global COVID-19 pandemic, which severely affected travel and sports events globally.
- Sports-related travel expenditure fell dramatically to USD 21 billion, reflecting a substantial 53.50% decrease from the previous year.
- This steep decline highlights the pandemic’s significant impact on the sports tourism industry.
- Anyhow, this setback, 2021 witnessed a strong recovery, with expenditures bouncing back to USD 39.7 billion, an impressive 89.20% increase compared to 2020.
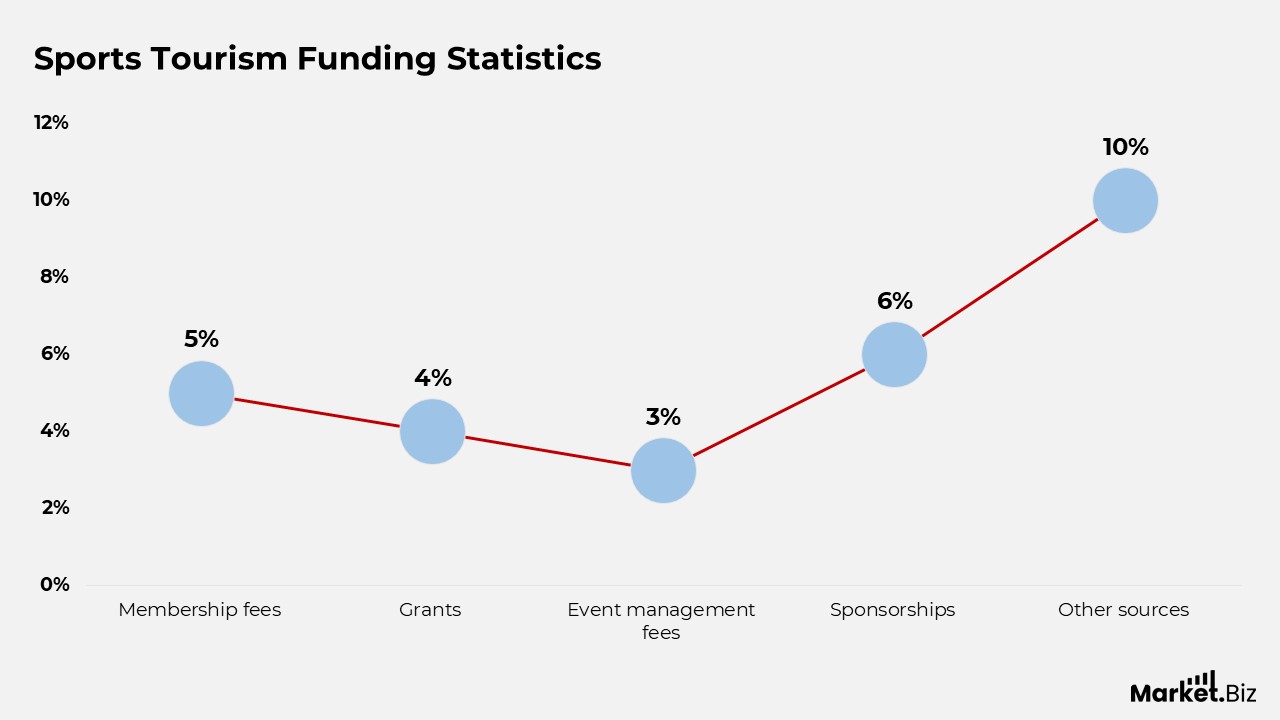
Sports Tourism Funding Statistics
- In 2021, there were notable variations in the funding sources for sports tourism organizations, which were influenced by their budget size.
- For destinations operating with a budget of $1 million or less, the predominant funding source was the hotel tax, which constituted 72% of their total funding.
- Subsequently, contributions from the general fund represented 9%. Contributions from Business Improvement District/Tourism Improvement District accounted for 4%, as did grants.
- Membership fees contributed 3%, event management fees added 2%, sponsorships provided 3%, and other sources made up 5%.
- Conversely, destinations with budgets surpassing $1 million depended less on the hotel tax, which supplied 57% of their funding.
- The contribution from the general fund was marginally higher at 11%, while BID/TID contributions remained unchanged at 4%.
- Membership fees represented 5%, grants accounted for 4%, event management fees contributed 3%, sponsorships provided 6%, and other sources constituted 10%.
Conclusion
Sports Tourism Statistics: The sector of sports tourism is flourishing and holds a promising future, marked by substantial increases in both participation and revenue. This expansion is driven by the growing appeal of major sporting events, the emergence of adventure tourism, and a widespread rise in travel centered on fitness.
Although there are challenges such as event cancellations stemming from regulations or financial constraints, the establishment of strategic partnerships and the incorporation of technology, especially virtual reality, are assisting in alleviating these problems and generating new prospects.
FAQs
The study conducted in 2024 indicated that spectator sports tourism resulted in $47.1 billion in direct expenditures, leading to a total economic impact of $114.4 billion and supporting 664,860 full-time and part-time positions nationwide. Additionally, it generated $8.5 billion in state and local tax revenues.
Positive Social Effects: The financial advantages of tourism can result in enhanced infrastructure and services, including improved roads, healthcare facilities, and educational institutions. These improvements benefit not only visitors but also local residents, thereby improving the overall quality of life.
A key goal of tourism is to foster economic development. This encompasses generating revenue, creating employment opportunities, and contributing to the GDP of the area. Furthermore, tourism promotes investment in infrastructure and services, which benefits both visitors and local communities.