
Introduction
Call Center Statistics: Call centers play a crucial role in customer service, serving as the main point of contact between businesses and their clients. With the evolution of technology, including AI, automation, and cloud systems, call center operations have been significantly improved, boosting efficiency and enhancing the customer experience.
Analyzing call center statistics provides essential insights into areas like response times, problem resolution, and the success of multichannel support. These metrics allow businesses to assess their operational performance, fine-tune customer service approaches, and ensure that customer interactions are managed effectively, resulting in greater satisfaction and loyalty.
Editor’s Choice
- 86% of consumers believe call center services are crucial for their overall customer experience.
- The call center AI market is projected to reach USD 2.8 billion by 2024.
- On average, a call center handles about 4,400 calls per month, with approximately 48 calls missed.
- 71% of consumers expect personalized interactions from call center service providers.
- By 2026, conversational AI is anticipated to reduce labor costs for contact center agents by USD 80 billion.
- According to Deloitte, 73% of call center leaders plan to offer remote or hybrid work options long-term to boost agent recruitment and retention.
- 81% of agents prefer remote work due to better work-life balance and less commuting time compared to working on-site.
- Companies can save over USD 11,000 per employee annually with half-time remote work, and the savings for fully remote employees could be even greater.
- A study by Stanford University revealed that agent performance can improve by 13% when working from home.
General Call Center Statistics
- The ideal occupancy rate for call center agents should be between 75% and 90%, indicating how much time agents spend on live calls or related tasks.
- First response times (FRT) should be under 3 minutes for phone calls and under one and a half minutes for live chat interactions.
- The average speed of answer (ASA) in call centers is 28 seconds, serving as a standard benchmark.
- Average handling time (AHT) in call centers typically averages 6 minutes per call.
- The typical call abandonment rate for call centers falls between 5% and 8%.
- The average time spent in the line for contact centers across all industries is 46 seconds.
- A good first call resolution rate (FCR) is typically between 70% and 75%.
- The ideal customer satisfaction rate (CSAT) for call centers is between 75% and 84%.
- A good net promoter score (NPS) is considered to be 50 or higher.
- Call centers aim to keep the percentage of inbound calls blocked at 2% or less.
Moreover
- The average after-call work (ACW) time through call centers is 45 seconds.
- The average staff turnover rate in call centers ranges from 30% to 45%.
- Most call centers aim to answer 80% of calls within 20 seconds, with efforts underway to improve this to 90% within 15 seconds.
- Gartner projects a 5x increase in the rate of automation for agent interactions, reaching approximately 10% by 2026, up from 1.8% in 2022.
- 73% of consumers believe that brands valuing their customers’ time is an important indicator of good customer service.
- 58% of U.S. customers are willing to pay more to a brand that offers a better customer experience.
- 78% of customers have abandoned a planned purchase due to a negative experience.
- Nearly 62% of millennials and 75% of Gen-Z customers choose self-service options, even when support is available.
(Source: Smith.AI, Inc., Klipfolio, Sisense, Call Centre Helper, HubSpot, Ozonetel, Scorebuddy, ROI Call Center Solutions, The KPI Institute, Replicant, Gartner, Forbes Media LLC.)
Call Centre AI Market Size
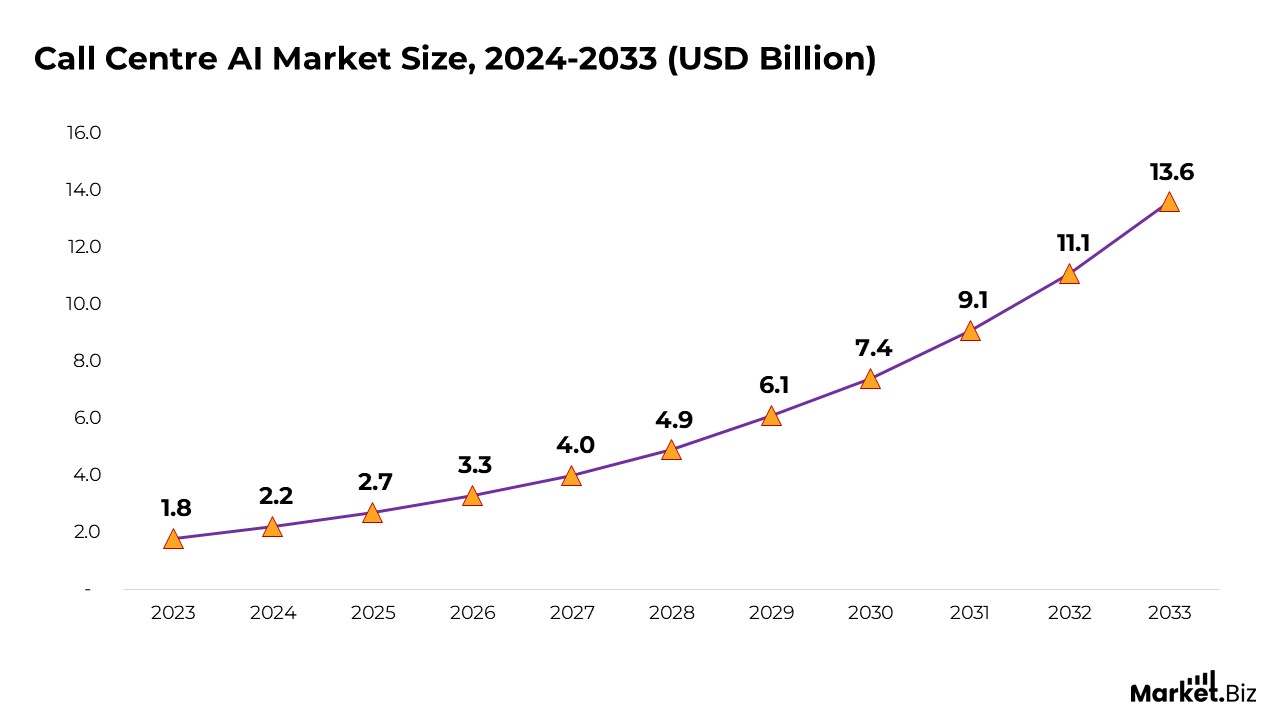
- According to Market.us, the global call center AL market is expected to rise from $2.7 billion in 2025 to $11.1 billion by 2032, representing a compound annual growth rate (CAGR) of 22.4% from 2024 to 2033.
- The rise in automation to handle large volumes of customer queries is a key driver of market growth, with digital transformation pushing companies to adopt advanced technologies.
- In 2023, the Solutions segment led the Call Centre AI Market with a 68.5% market share, driven by the demand for AI tools that streamline operations and enhance customer interactions.
- In 2023, the On-premise segment captured 58.5% of the market, valued for its control and security, especially in industries like finance and healthcare.
- The Predictive Call Routing segment held a 23.6% market share in 2023, improving efficiency and customer satisfaction by routing calls based on customer data and history.
- Large Enterprises dominated the market in 2023, with a 73.5% share, benefiting from greater resources to invest in advanced AI technologies.
- The BFSI (Banking, Financial Services, and Insurance) segment captured 24.2% of the market in 2023, driven by the demand for AI solutions to enhance service efficiency and security.
- In 2023, North America led the Call Centre AI Market with 42.6% of the share, generating USD 0.7 billion in revenues, due to rapid technology adoption and a competitive service industry.
- According to the 2023 CX Landscape Report by CallMiner, 45% of CX leaders are concerned about AI security risks, 43% worry about misinformation, and 41% fear biased or inappropriate AI responses in customer service.
- Only 6% of leaders report no concerns about AI integration in customer service, indicating widespread apprehension regarding its use.
(Source: Market.us)
Call Center Outsourcing Market Size
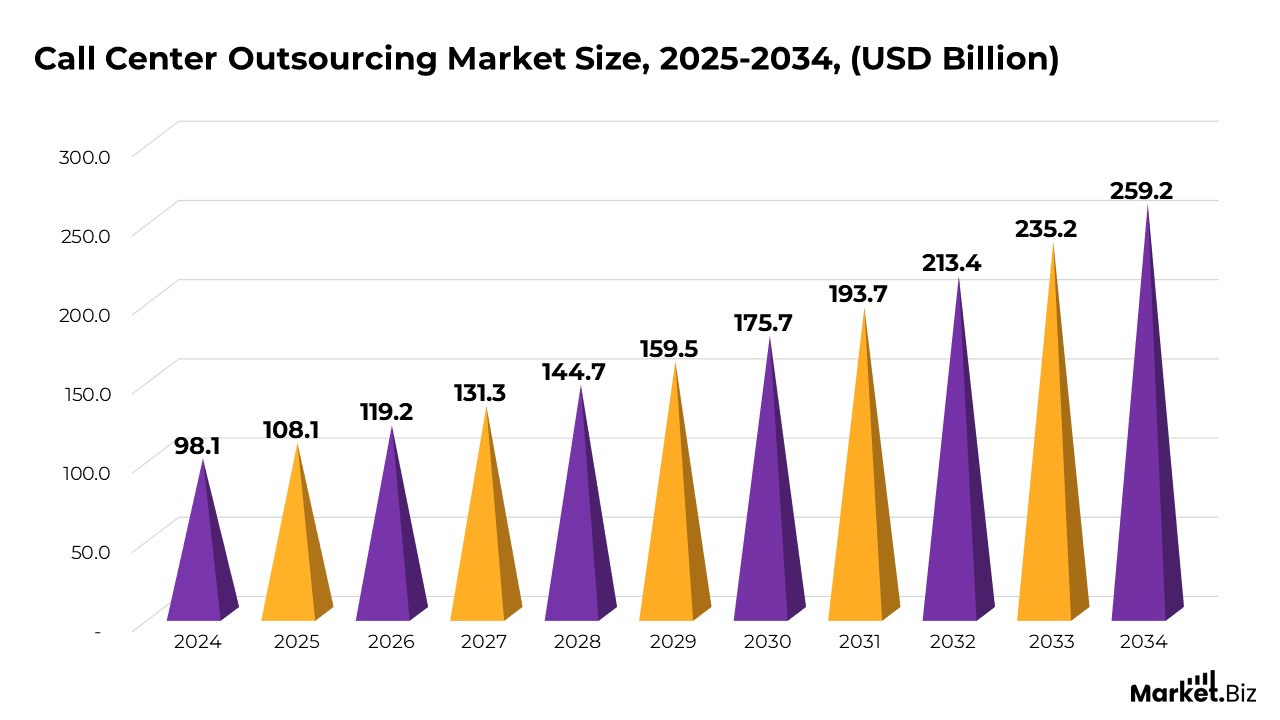
- According to Market.us, the global call center outsourcing market is expected to rise from $108.1 billion in 2025 to $259.2 billion by 2034, representing a compound annual growth rate (CAGR) of 10.2% from 2025 to 2034.
- Market growth is driven by the need for cost containment, rapid scaling, specialized expertise, digital transformation, globalization, multilingual support demand, and omnichannel customer expectations.
- In 2024, the Onshore segment led the market with a 58.6% share, favored for its benefits in communication, compliance, and customer experience.
- The Inbound Services segment captured 63.7% of the global call center outsourcing market in 2024, emphasizing its critical role in customer satisfaction and loyalty.
- Large Enterprises dominated the market in 2024, holding 69.4% of the share, driven by their large customer bases and ability to invest in advanced outsourcing solutions.
- The BFSI segment captured 26.7% of the market in 2024, due to the financial services industry’s need for high-quality engagement and regulatory compliance.
- North America led the call center outsourcing market in 2024 with a 33.1% share, generating approximately USD 32.47 billion in revenue, driven by the concentration of global enterprises in the region.
- The U.S. Call Center Outsourcing Market was esteemed at USD 29.2 billion in 2024 and is expected to reach USD 66.7 billion by 2034, growing at a CAGR of 8.6% from 2025 to 2034.
- According to callin.io, 78% of companies now outsource part of their customer service operations.
- Outsourcing adoption varies by sector: 72% in financial services, 65% in healthcare, 61% in retail, and 58% in technology, reflecting industry-specific needs.
- Outsourcing partners have shown significant improvement, with top providers achieving customer satisfaction scores of 85-90% and first-call resolution rates averaging 78%.
- 76% of outsourcing providers are using artificial intelligence in some form, reshaping the outsourcing model.
(Source: Market.us)
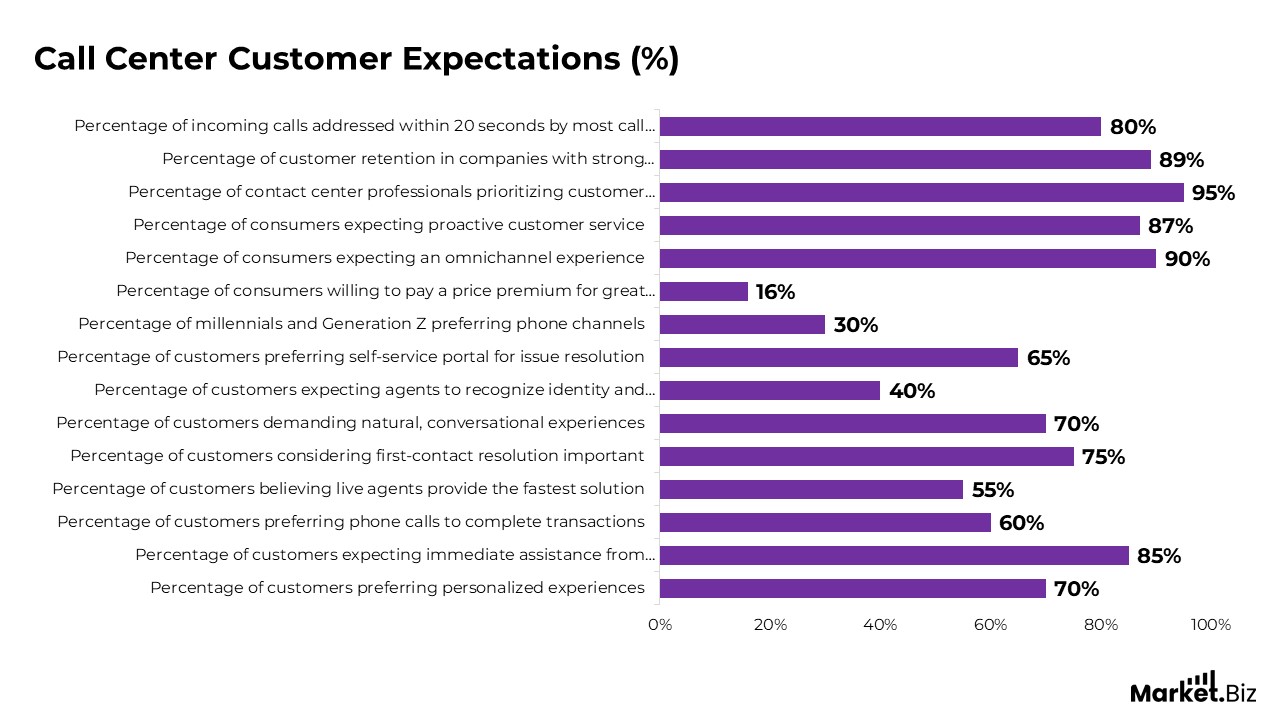
Call Center Customer Expectations
- 70% of customers prefer organizations to provide personalized experiences, and about 75% are dissatisfied when this expectation is not met.
- Around 85% of customers expect immediate assistance from a customer service team when they call a company.
- 60% of customers prefer to call a company by phone to complete a transaction.
- About 55% of customers believe interacting with a live agent provides the fastest solution, and 75% consider first-contact resolution to be the most crucial factor in enhancing customer experience.
- 70% of customers demand natural, conversational experiences when interacting with brands.
- Approximately 40% of customers expect call agents to recognize their identity and the context of their inquiry immediately.
- 65% of customers prefer resolving their issues through a self-service portal.
- Around 30% of millennials and 30% of Generation Z in the U.S. prefer using the phone channel to contact brands. Additionally, 74% of consumers are at least somewhat likely to make a purchase based solely on the experience.
Moreover
- Consumers are willing to pay a 16% price premium for an excellent customer experience. If companies save customers time and effort, they are likely to be rewarded.
- 9 out of 10 consumers expect an omnichannel experience with seamless service between communication channels, urging brands to connect their online and offline channels.
- 87% of consumers expect proactive customer service from the companies they engage with, expecting businesses to know their needs before they reach out.
- 95% of contact center professionals consider customer satisfaction the most important call center metric, emphasizing its direct impact on revenue.
- Companies with strong omnichannel engagement strategies retain 89% of their customers, highlighting the importance of great customer experiences for both acquisition and retention.
- Most call centers focus on addressing 80% of incoming calls within 20 seconds, with many aiming to improve this standard to 90% within 15 seconds.
(Source: ACSI, Forbes & Arm Treasure Data, Salesforce, PwC, CX Today, Call Centre Helper, Invesp, McKinsey & Company.)
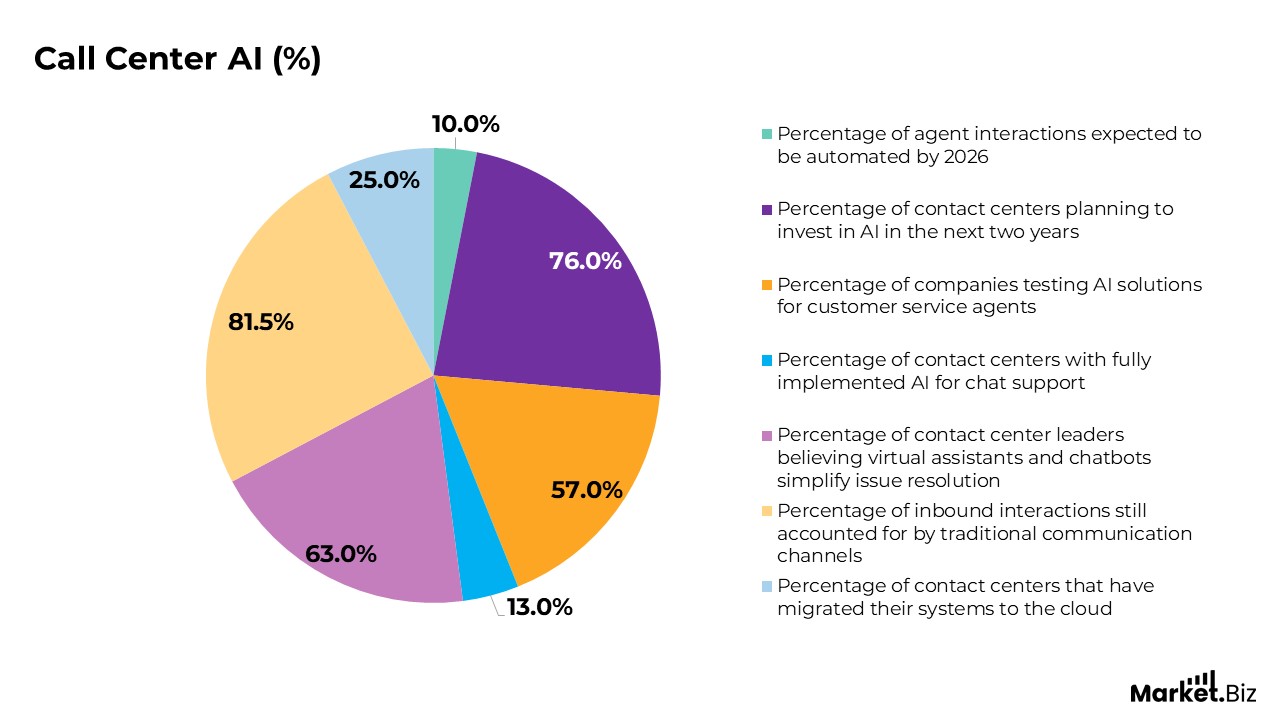
Call Center AI Statistics
- The automation rate in call center agent interactions is expected to grow fivefold, reaching approximately 10% by 2026, up from 1.8% in 2022.
- Around two-thirds of contact center managers surveyed believe that AI will simplify agents’ tasks, leading to an increase in the number of agents over the next decade.
- By 2026, conversational AI is projected to save $80 billion in labor costs for contact center agents.
- According to Gartner, by 2026, 10% of agent interactions are expected to be fully automated through AI technology.
- 76% of contact centers plan to invest in artificial intelligence within the next two years.
- 57% of companies are currently testing AI solutions to assist their customer service agents.
- Only 13% of contact centers have fully implemented AI for chat support.
- 63% of contact center leaders believe that virtual assistants and chatbots simplify the process of resolving customer issues.
- Despite the rise of bots and automation, traditional communication channels like telephone and email will still account for 81.5% of all inbound interactions in contact centers.
- 25% of contact centers have migrated their systems to the cloud, while 30% that haven’t yet are planning to do so within the next two years.
(Source: Gartner, Deloitte, PwC, Passive Secrets, LLC, Call Centre Helper)
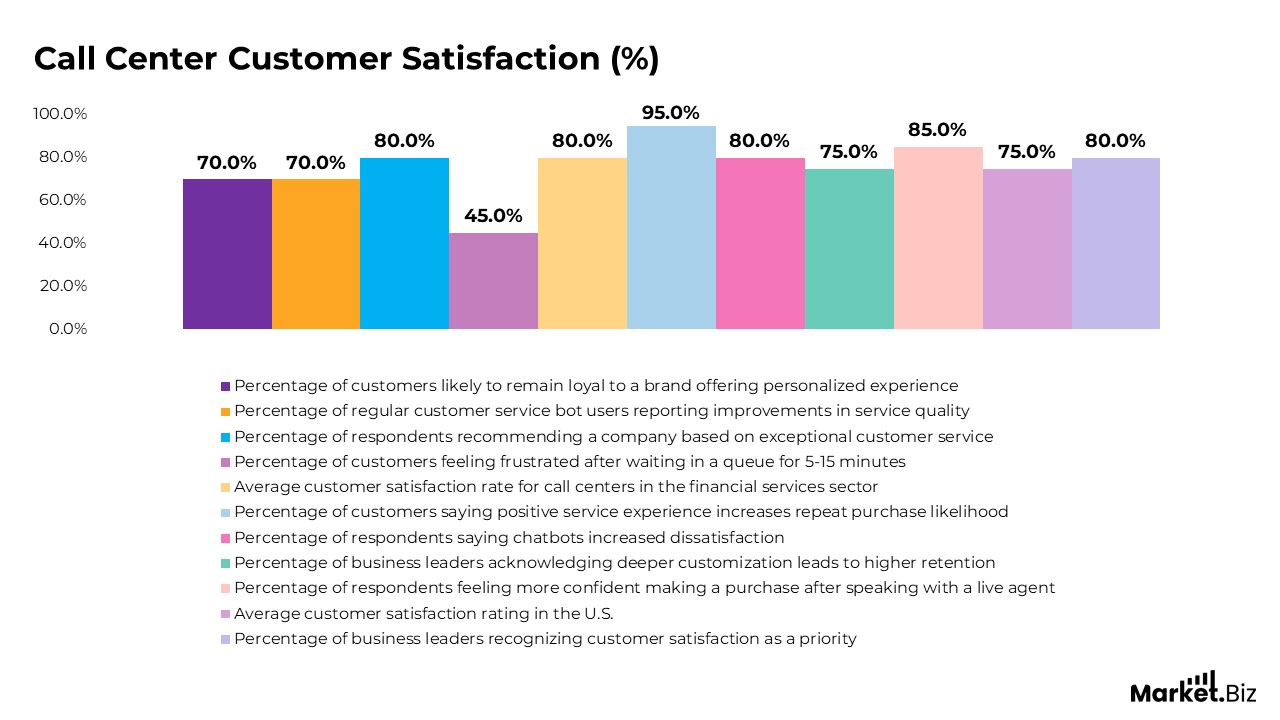
Call Center Customer Satisfaction
- Around 70% of customers are more likely to remain loyal to a brand that offers a personalized experience.
- Approximately 70% of regular customer service bot users report noticeable improvements in service quality, with dissatisfaction levels continuing to decrease.
- 80% of respondents say they have recommended a company based on exceptional customer service.
- 45% of customers feel frustrated or upset if they are kept waiting in a queue for 5 to 15 minutes.
- The average customer satisfaction rate for call centers in the financial services sector is about 80%.
- 95% of customers indicate that a positive customer service experience increases their likelihood of making a repeat purchase.
- 80% of survey respondents stated that using chatbots heightened their dissatisfaction, and 70% felt they were a waste of time.
- Around 75% of business leaders acknowledge that offering deeper customization leads to higher customer retention, and 60% believe it helps lower acquisition costs.
- Compared to online shopping, 85% of respondents said speaking with a live person on the phone made them feel more confident in making a purchase.
- The average customer satisfaction rating in the U.S. is approximately 75%.
- 80% of business leaders recognize customer satisfaction and feedback management as increasingly important priorities.
(Source: Salesforce, Replicant, Customer Satisfaction Index, AIMultiple, UJET.CX., Invoca, CRESTA)
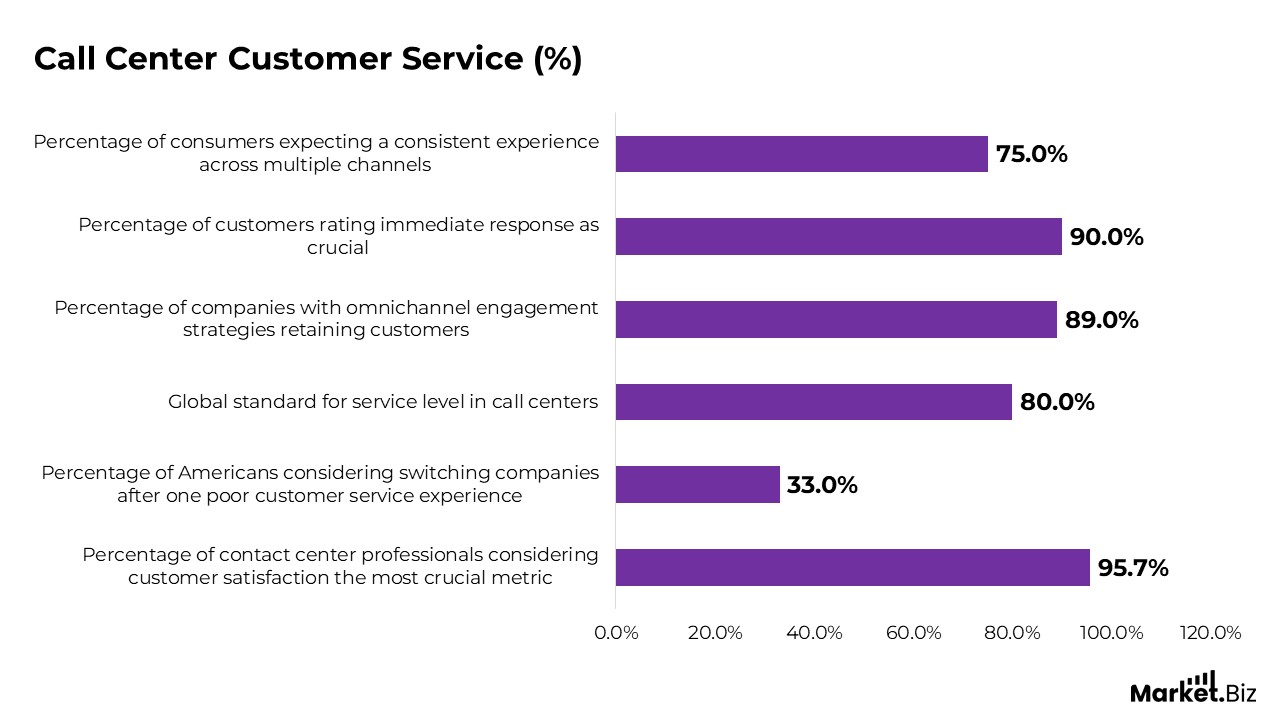
Call Center Customer Service Statistics
- When a customer’s issue is resolved on the first call, only 1% are likely to switch to a competitor, compared to 15% when the problem is not adequately addressed.
- 95.7% of contact center professionals consider customer satisfaction to be the most crucial metric for measuring call center performance.
- 33% of Americans are willing to consider switching companies after experiencing poor customer service just once.
- The global standard for service level in call centers is answering 80% of calls within 20 seconds, with the average response time being around 28 seconds.
- Companies with robust omnichannel engagement strategies retain 89% of their customers.
- Poor customer service leads to an annual loss of approximately $75 billion for businesses.
- When seeking service, 90% of customers rate an immediate response as crucial, with 60% defining immediate as a response time of 10 minutes or less.
- 75% of consumers expect a consistent experience across multiple channels, including social media, mobile, online, in-person, or via phone, and 73% would consider switching brands if they do not receive it.
- 89% of customer service professionals agreed in 2019 that customers are more likely to share both positive and negative experiences, with this figure slightly decreasing by 1% in 2020.
(Source: VOIP-Info.org, Cloudtalk, FinancesOnline, Call Centre Helper, Salesforce, Invesp, HubSpot, American Express, Forbes)
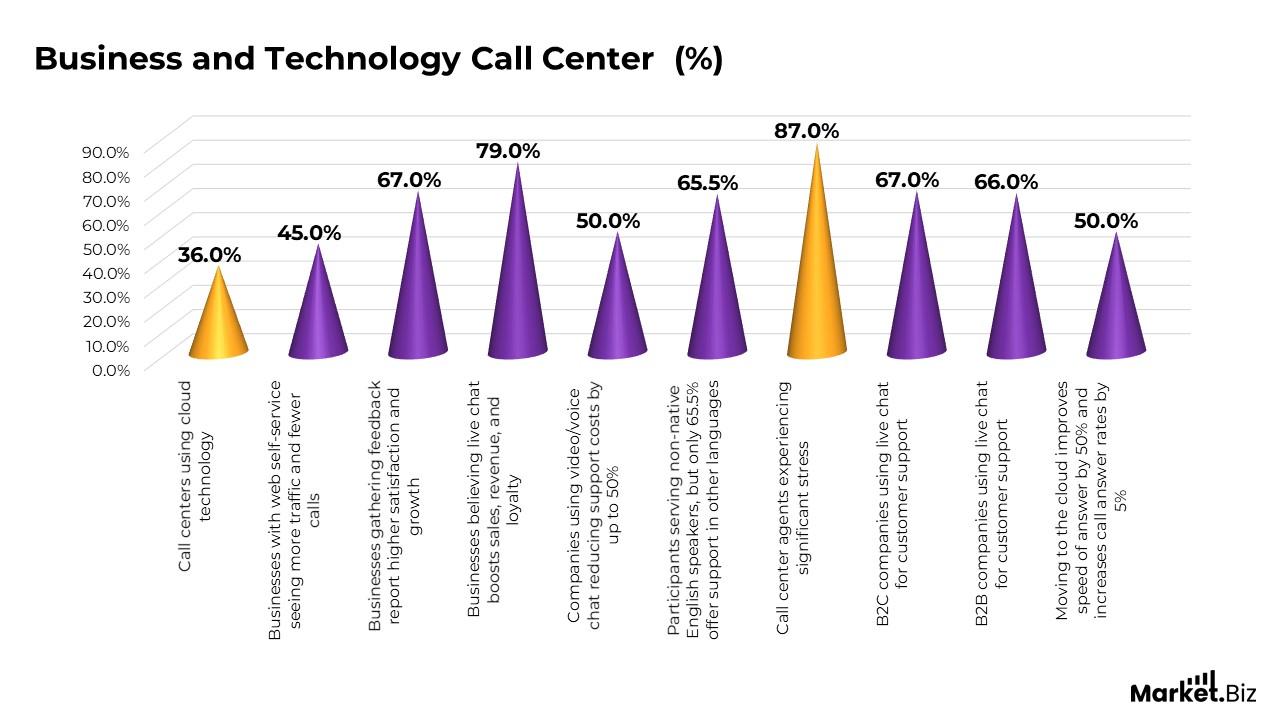
Business and Technology Call Center Statistics
- Poor customer service results in an annual loss of approximately $75 billion for businesses.
- Around 36% of call centers utilize cloud technology in their operations.
- 45% of businesses offering web self-service report an increase in site traffic and a decrease in phone call volumes.
- 67% of businesses that gather customer feedback report higher satisfaction levels and business growth.
- 79% of businesses believe that live chat positively impacts sales, revenue, and customer loyalty.
- Companies using live video and voice chat on their websites can reduce support costs by up to 50%.
- While 86% of surveyed participants serve non-native English-speaking customers, only 65.5% openly offer customer support in languages other than English.
- 87% of call center agents report experiencing significant stress from their jobs.
- 67% of B2C companies and 66% of B2B companies use live chat primarily for customer support, not sales.
- Moving to the cloud can improve the average speed of answer (ASA) by 50% and increase call answer rates by 5%.
(Source: Forbes, HubSpot, ICMI, Cornell University, Finance Online, Kayako, Destination CRM, Aberdeen, RingCentral, Smith. AI, Inc.)
Call Center Performance by Industry
- The median salary for medical contact center representatives is $92,085 annually.
- Concentrix, a business process outsourcing (BPO) company, employs approximately 80,000 people in the Philippines, making it the largest contact center globally.
- Business support services employ the highest number of customer service representatives in the U.S., with a total of 269,120 employees.
- Prominent companies that outsource their contact centers include Bank of America, Amazon, Microsoft, and Verizon.
- Around 80% of contact center employees in the BPO industry believe having a career growth path is crucial, compared to 45% in other industries.
- The telecommunications industry experiences the longest customer chat wait times, averaging over 2 minutes, with government call centers coming second at around 55 seconds.
- The industry offering the highest salary for customer service representatives is support activities for water transportation, with an annual mean wage of $94,790.
- The average customer satisfaction rate for call centers in the banking and financial services sector is 79%, highlighting the critical role of delivering high-quality service in this industry.
Moreover
- Healthcare call centers have an average call abandonment rate of 7%, demonstrating their ability to manage patient inquiries efficiently and minimize abandonment.
- Call centers within the technology industry maintain an average service level of 79%, ensuring most calls are answered in the projected timeframe to meet customer expectations.
- E-commerce call centers achieve an average first call resolution (FCR) rate of 75%, emphasizing their commitment to resolving customer issues on the first contact.
- Only 39% of U.S. customers believe that retail call center agents understand their needs, leading to feelings of being unappreciated and negatively impacting brand engagement.
- Insurance call centers report an average schedule adherence rate of 80%, reflecting their focus on maintaining agent availability according to designated schedules.
- Telecom call centers have an average agent occupancy rate ranging between 80% and 90%, ensuring agents are efficiently engaged while maintaining a manageable workload.
(Source: American Customer Satisfaction Index, Healthcare Financial Management Association, Salary.com, Zoom Communications, Inc., Outsource Accelerator, U.S. Bureau of Labor Statistics, Magellan Solutions, Statista, TechTarget, PwC)
Call Center Challenges
- Call center and contact center customer service teams were among the 12 highest turnover jobs in 2021.
- The average tenure for agents in call centers is 15 months for sales roles and 13.7 months for support roles.
- About 60% of agents feel that the training provided by their call centers or contact centers offers no real value to their roles.
- Approximately 30% of customer service agents and supervisors are actively seeking new career opportunities, with 60% specifically looking for positions outside the call center industry.
- Around 55% of customer experience (CX) leaders consider recruiting and retaining talent their biggest challenge.
(Source: CRESTA, NICE, Talkdesk, Invoca, AIMultiple)
Conclusion
Call center statistics provide crucial insights into the effectiveness and efficiency of customer service operations. Metrics like occupancy rates, response times, handling times, and customer satisfaction levels are vital for evaluating how well call centers fulfill customer expectations and optimize their processes.
As companies increasingly adopt automation and cutting-edge technologies, tracking these statistics becomes essential for boosting agent productivity, lowering operational costs, and improving the customer experience.
By utilizing these insights, businesses can develop data-driven strategies to strengthen customer loyalty, streamline workflows, and maintain a competitive edge in a rapidly evolving, customer-focused landscape.
FAQ’s
The optimal occupancy rate for call center agents typically falls between 75% and 90%, representing the ideal amount of time agents spend handling live calls or completing tasks directly associated with those calls.
On average, handling time (AHT) in call centers tends to be around six minutes per interaction, covering both the duration of the call and any after-call work required.
Call centers typically aim to maintain a call abandonment rate (AAR) between 5% and 8%, focusing on reducing this figure to ensure better customer retention and satisfaction.
The average time a customer spends in the queue across various industries is typically around 46 seconds, though this can fluctuate based on call volume and staffing levels.
A first call resolution (FCR) rate between 70% and 75% is considered ideal, as it indicates that most customer concerns are resolved during their initial contact.
The target customer satisfaction (CSAT) rate for call centers generally falls between 75% and 84%, reflecting that customers are largely satisfied with the service provided.
A net promoter score (NPS) of 50 or higher is considered excellent, signifying a strong likelihood that customers would recommend the service to others.