Introduction
Pets & Animal Supplies Statistics: The Pet & Animal Supplies sector represents a dynamic industry dedicated to the production and distribution of food for domesticated animals, particularly dogs and cats.
Currently, it is experiencing growth, influenced by factors such as an increase in pet ownership, a focus on pet health, and a rising demand for high-quality and specialized pet food options. Prominent companies in this sector include Nestlé Purina PetCare, Hill’s Pet Nutrition, Mars Petcare Inc., and Blue Buffalo.
In the end, the pet food industry is evolving to accommodate changing consumer preferences and the increasing importance of pets in our everyday lives. The Pet & Animal Supplies market is thriving on a global scale, propelled by the trend of pet humanisation, where pets are regarded as family members. This shift has resulted in higher expenditures on premium foods, health supplements (such as probiotics and joint care), wellness products, and accessories.
The market is also witnessing significant online growth and a movement towards natural and fresh diets. However, it faces challenges such as rising supply costs and competition, all while transforming into a multi-billion-dollar industry that is expected to continue its growth trajectory through 2030 and beyond.
Editor’s Choice
- The global revenue from the pet food market is projected to reach 186.10 billion by 2028.
- In 2021, the market revenue escalated to USD 121 billion.
- Australia, also within this region, reports an impressive USD 3,062 million in pet food revenue, indicating its considerable market presence.
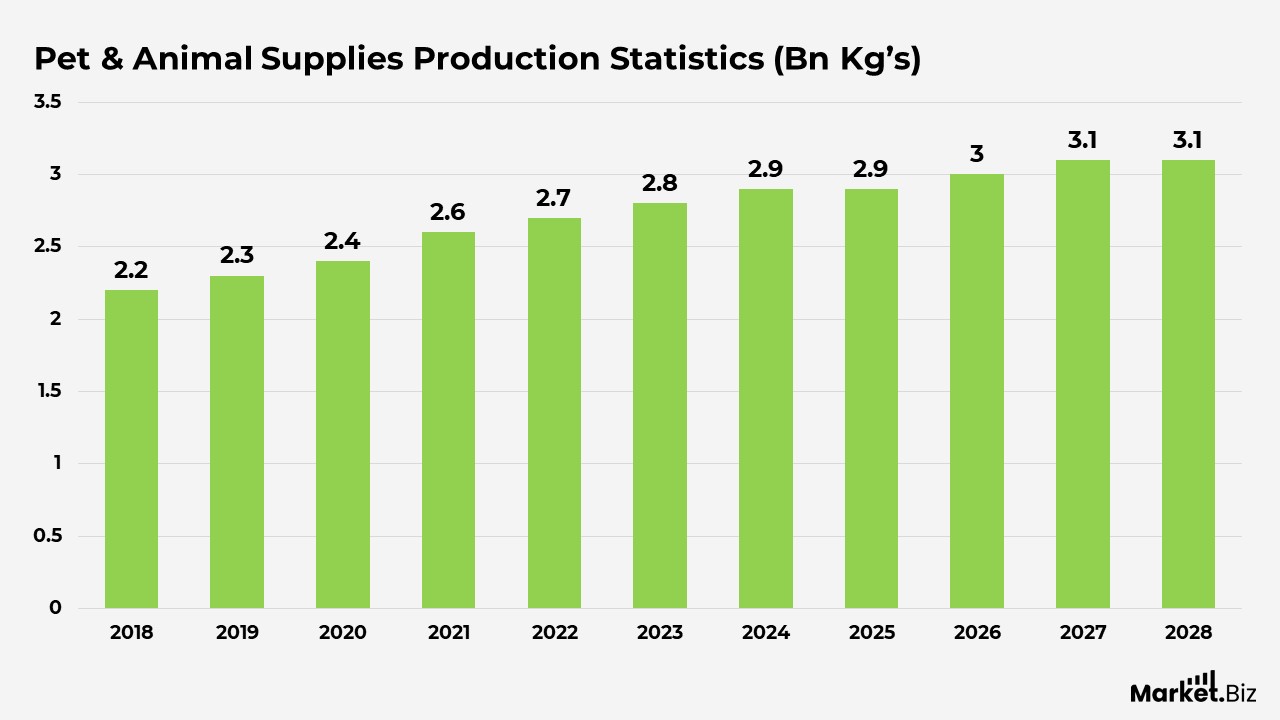
- Prices are projected to hit USD 3 in 2026, USD 3.08 in 2027, and USD 3.13 in 2028.
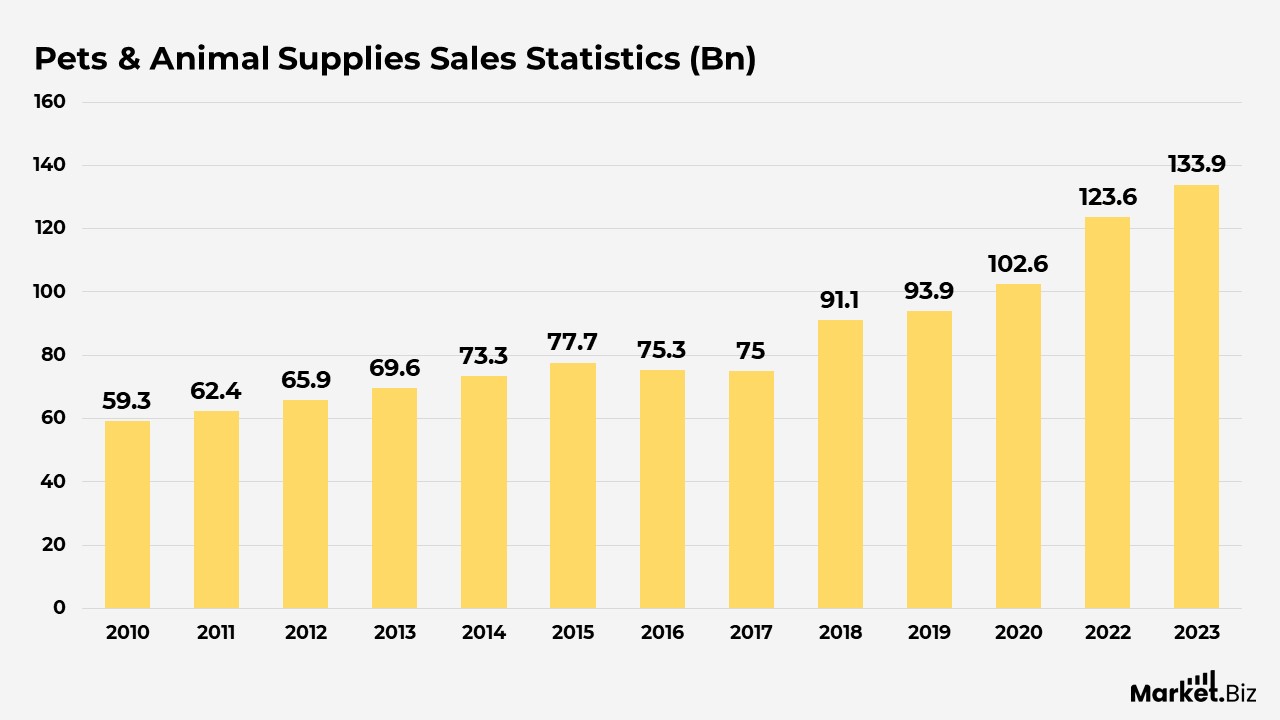
- In 2010, the sales of pet food reached USD 59.3 billion, and this amount consistently grew in the following years.
General Pets & Animal Supplies Statistics
- The global revenue from the pet food market is projected to reach 186.10 billion by 2028.
- In 2025, it is estimated that offline channels will account for 94.6% of the market share, whereas online channels are estimated to secure 5.4%.
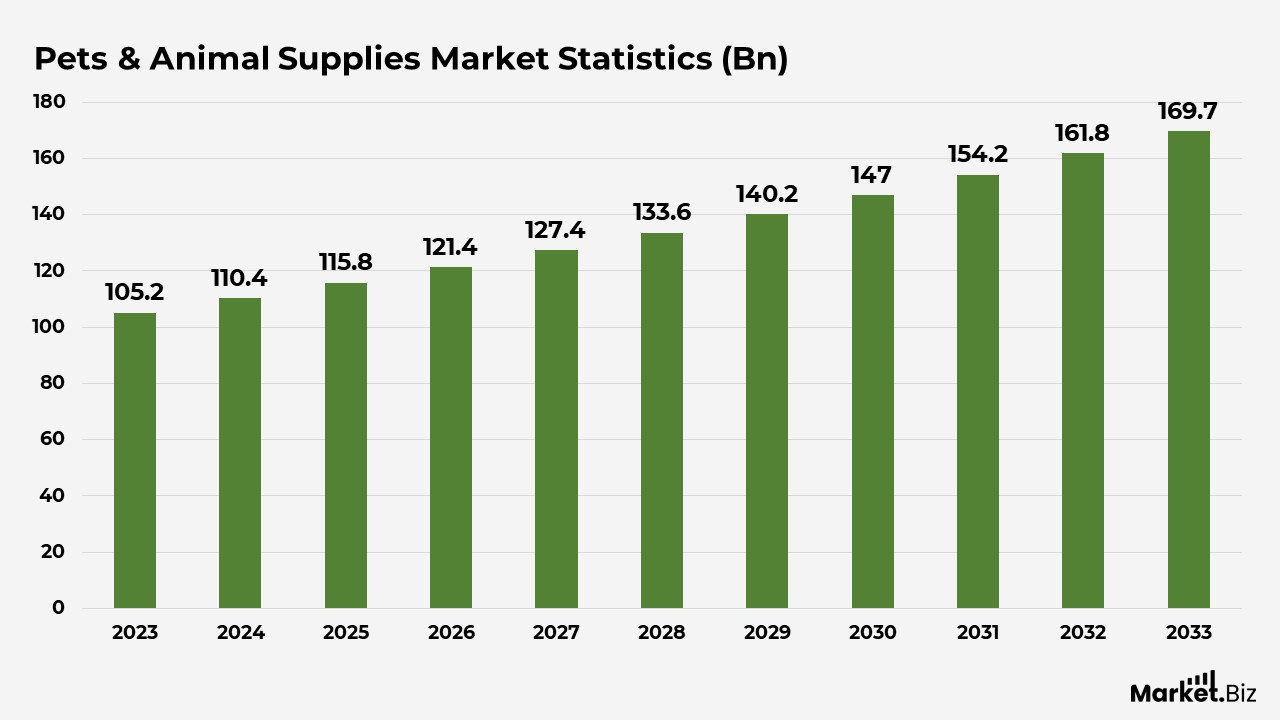
- The trend of rising production is anticipated to continue, with production volumes expected to reach 52.51 billion kilograms in 2024.
- In 2023, pet food sales amounted to USD 133.9 billion.
- A notable 93% of survey participants prioritise products that they believe their dogs or cats will find enjoyable, highlighting the significance of palatability.
- Approximately 37% of pet owners are actively seeking discounts on pet products, while 28% are utilising loyalty programs to save money.
- A considerable number of pet owners, about 77%, recognise that cats and dogs have distinct dietary needs.
Pets & Animal Supplies Market Size Statistics
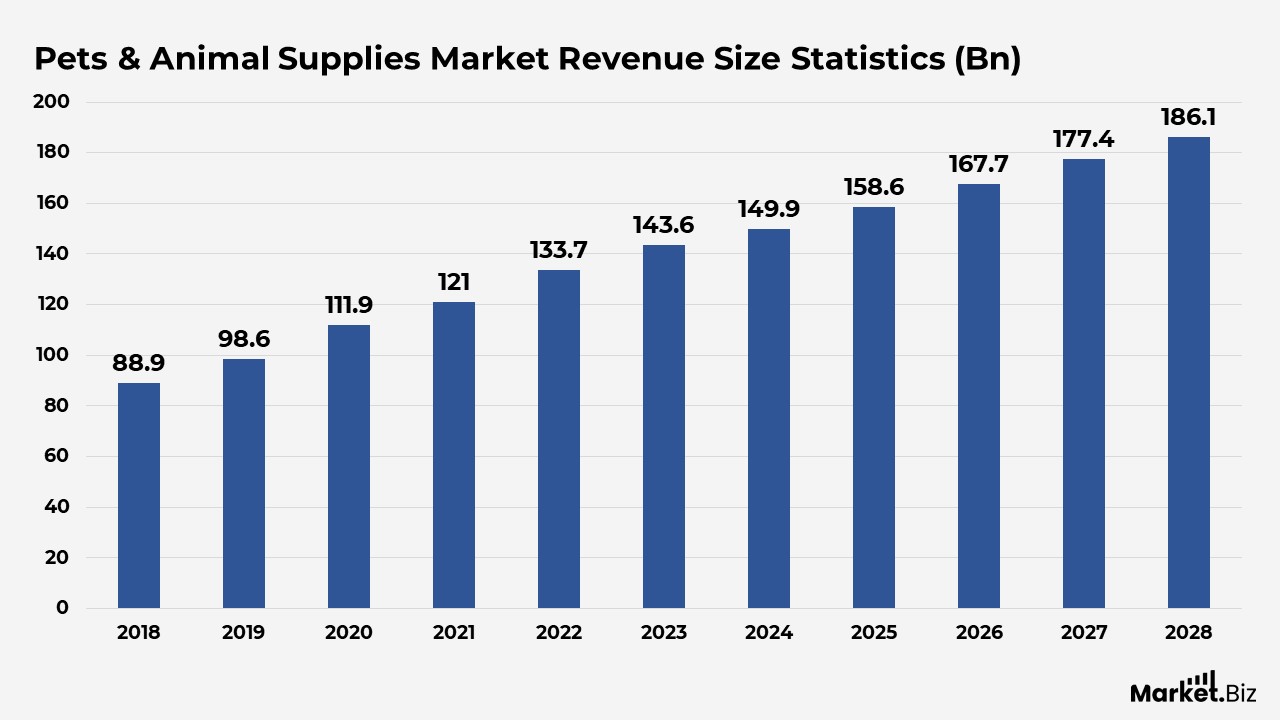
- The pet food market has shown significant growth over the last few years, achieving a compound annual growth rate (CAGR) of 5.6%.
- In 2018, the market’s revenue was stated at USD 88.91 billion, and by the conclusion of 2019, it had risen to USD 98.57 billion.
- The year 2020 saw a further considerable increase, with the market reaching USD 111.90 billion.
- In 2021, the market revenue escalated to USD 121 billion.
- Looking forward, the market is anticipated to continue its growth trajectory, with projected revenues of USD 133.70 billion in 2022 and USD 143.60 billion in 2023.
- The forecast for the upcoming years remains positive, with the pet food market expected to attain USD 149.90 billion in 2024, USD 158.60 billion in 2025, and a promising USD 167.70 billion in 2026.
- This growth is projected to continue, with revenues anticipated to reach USD 177.40 billion in 2027 and USD 186.10 billion in 2028.
Distribution Statistics by Pets & Animal Supplies
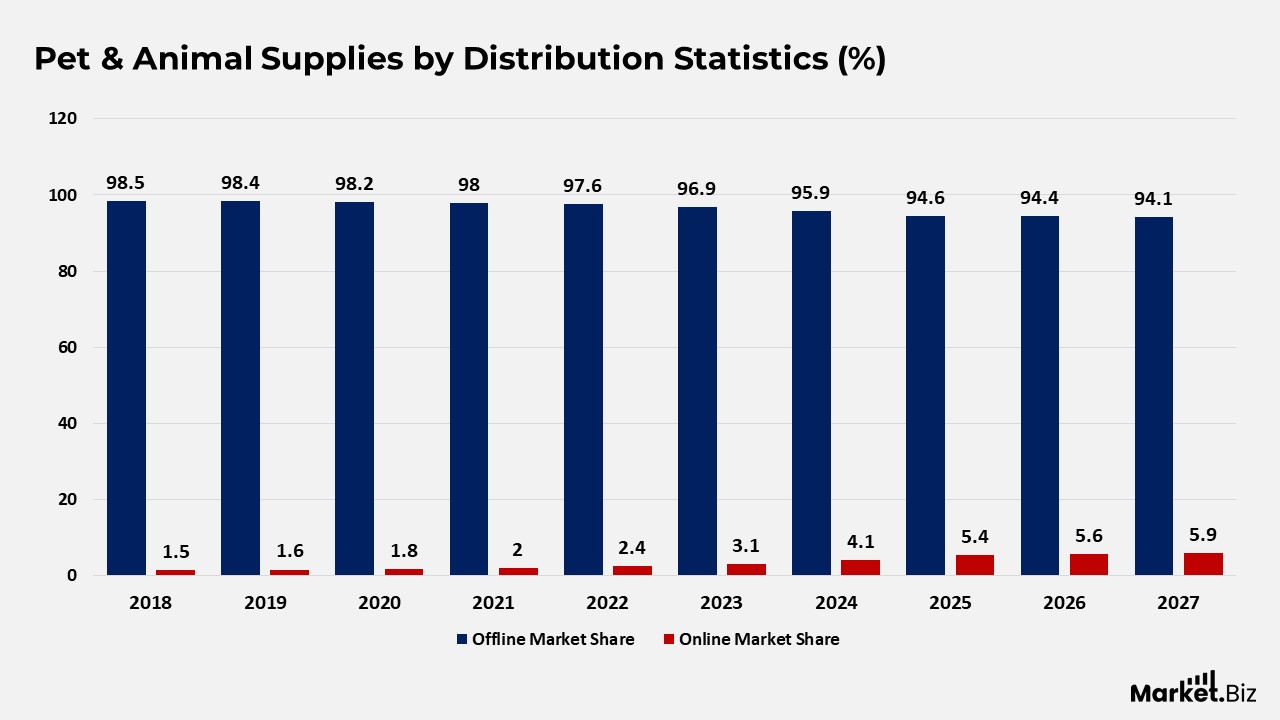
- In 2018, offline distribution channels were predominant, representing 98.5% of the market share. In contrast, online channels maintained a modest share of 1.5%.
- This pattern persisted in 2019, with offline channels at 98.4% and online channels increasing to 1.6%. However, a significant shift commenced in 2020, as offline channels slightly declined to 98.2%, while online channels experienced a gradual rise to 1.8%.
- The trend continued in 2021, with offline channels at 98.0% and online channels achieving a 2% market share.
- The movement towards online channels accelerated in the following years, with offline market shares decreasing to 97.6% in 2022 and further to 96.9% in 2023. Concurrently, online channels demonstrated consistent growth, capturing 2.4% in 2022 and a notable 3.1% market share in 2023.
- In 2024, when offline channels fell to 95.9%, while online channels made significant gains, reaching 4.1%.
- In the year 2025, it is anticipated that offline channels will account for 94.6% of the market share, whereas online channels are forecasted to reach 5.4%.
- In 2026, the gap narrows further, with offline channels at 94.4% and online channels expanding to 5.6%. This shift is predicted to reach a pivotal moment in 2027, as offline channels are forecasted to account for 94.1%, while online channels are expected to secure 5.9% of the market share.
Pets & Animal Supplies by Regional Statistics
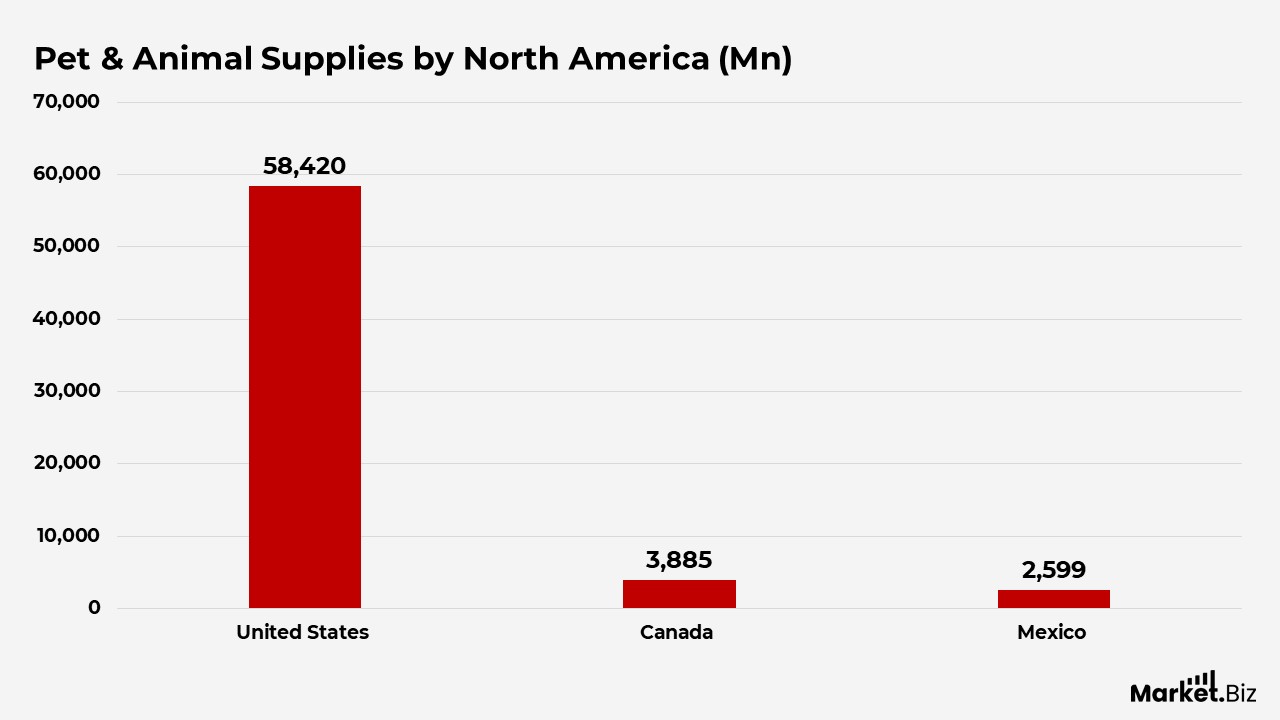
North America
- At the forefront, the United States distinguishes itself with a significant revenue of USD 58,420 million, underscoring its reputation as a prominent nation that loves pets.
- In North America, Canada and Mexico add USD 3,885 million and USD 2,599 million, respectively, emphasising the expansion of their pet food markets.
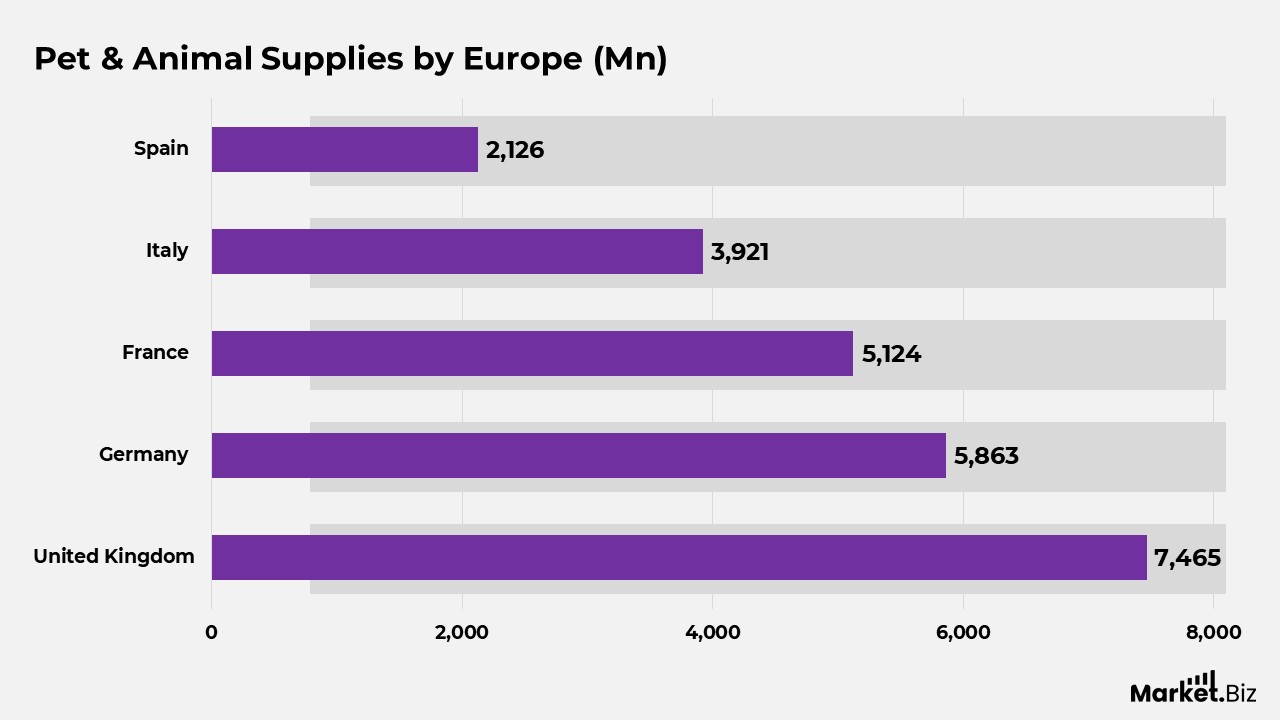
Europe
- Crossing the Atlantic, Europe highlights its significance in the industry.
- The United Kingdom, with a market value of USD 7,465 million, exhibits a robust market presence. This is followed by France at USD 5,124 million, Italy at USD 3,921 million, and Germany at USD 5,863 million.
- Although Spain is smaller in comparison, it still makes a significant contribution of USD 2,126 million to the regional market.
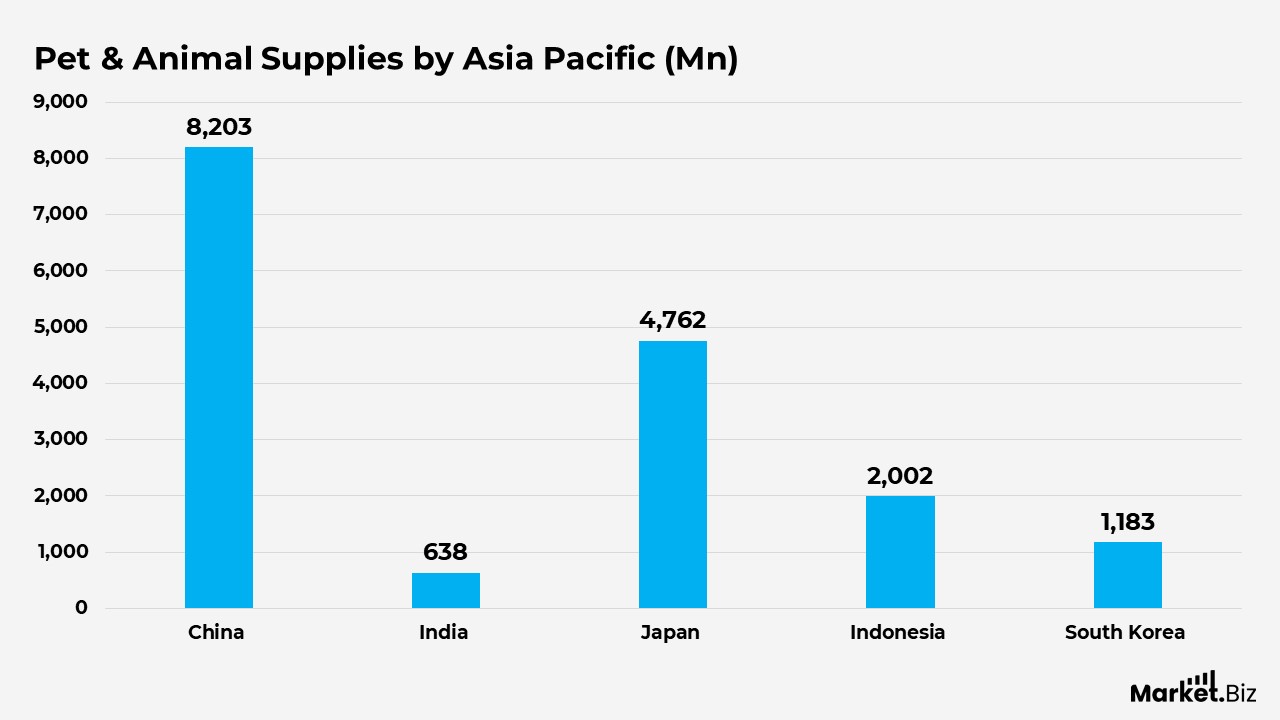
Asia Pacific
- In the Asia-Pacific region, China stands out as a significant contributor with pet food revenue amounting to USD 8,203 million, highlighting the growing trend of pet ownership.
- Japan, India, Indonesia, and South Korea display diverse market sizes, with India generating USD 638 million.
- Japan at USD 4,762 million, Indonesia at USD 2,002 million, and South Korea at USD 1,183 million.
- Australia, also within this region, reports an impressive USD 3,062 million in pet food revenue, indicating its considerable market presence.
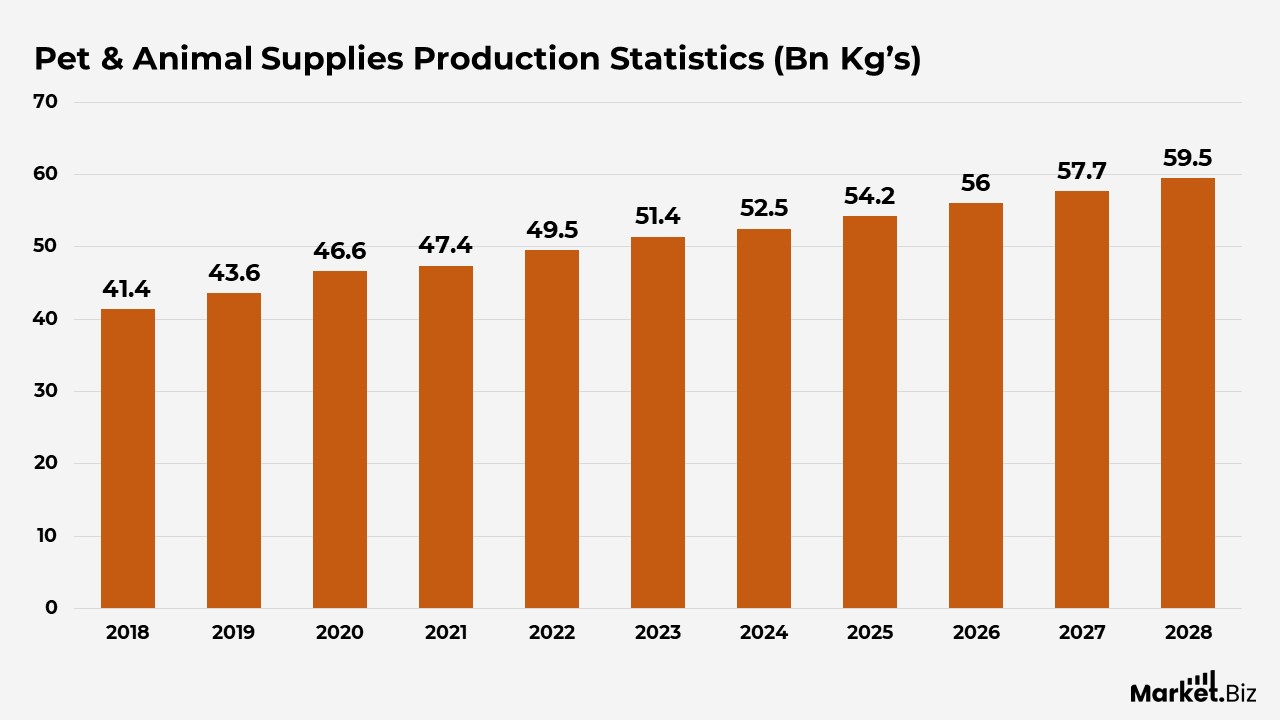
Pets & Animal Supplies Production Statistics
- In 2018, the production volume was noted at 41.43 billion kilograms, and this figure steadily increased to 43.61 billion kilograms in 2019.
- In 2020, production rose to 46.62 billion kilograms. In 2021, the sector generated 47.39 billion kilograms of pet food, indicating continuous expansion.
- The production volume is expected to maintain its positive trend. In 2022, it is forecasted to reach 49.53 billion kilograms, followed by an anticipated 51.44 billion kilograms in 2023.
- The trend of increasing production is projected to persist, with estimates suggesting production volumes of 52.51 billion kilograms in 2024, 54.22 billion kilograms in 2025, and 55.95 billion kilograms in 2026.
- The upward trend is expected to continue throughout the forecast period, with production volumes predicted to reach 57.69 billion kilograms in 2027 and 59.47 billion kilograms in 2028.
Pets & Animal Supplies Price Statistics
- In 2018, the unit price was noted at USD 2.15, which gradually rose to USD 2.26 in 2019, indicating moderate price growth.
- The upward trend persisted in 2020, as the unit price climbed to USD 2.40, and further accelerated in 2021 when it increased to USD 2.55.
- Looking forward, the unit price is anticipated to keep rising. In 2022, it is projected to reach USD 2.70, followed by USD 2.79 in 2023.
- The upward trend continues in 2024, with a unit price of USD 2.85, and in 2025, it is expected to be USD 2.93.
- As we progress into 2026 and beyond, the trend remains optimistic. Prices are projected to hit USD 3 in 2026, USD 3.08 in 2027, and USD 3.13 in 2028.
Sales Statistics of Pets & Animal Supplies
- In 2010, the sales of pet food reached USD 59.3 billion, and this amount consistently grew in the following years.
- By 2014, sales had climbed to USD 73.3 billion, reflecting an expanding market.
- Although 2016 experienced a minor decline in sales to USD 75.25 billion, the trend reversed, and by 2018, the industry saw a notable increase with sales hitting USD 91.1 billion.
- This upward trajectory persisted in 2019, with sales amounting to USD 93.9 billion, and further accelerated in 2020, when the industry reported sales of USD 102.6 billion.
- Looking forward, the outlook is promising, with anticipated sales of USD 123.6 billion in 2022 and USD 133.9 billion in 2023.
Consumer Trends in Pets & Animal Supplies
- A considerable number of pet owners, approximately 77%, recognise that cats and dogs possess distinct dietary needs.
- In particular, the notion that cats are inherently carnivorous is prevalent, with merely 16.4% holding a different view.
- Conversely, perspectives on the dietary classification of dogs are more diverse, with 45.6% identifying them as carnivores, 42.5% as omnivores, and a minor 2.4% categorising them as herbivores.
- Notably, a significant majority of those surveyed (around 79.9%) have not provided their dogs with a vegan or plant-based diet.
- Among the few who have, their reasons differ. About 58% believe it is advantageous for their dogs’ health, 41.7% consider it an environmentally friendly option, 38% are vegans themselves, and 30.6% do so because of their dogs’ allergies.
- Additionally, nearly half of pet owners (45.9%) indicate a readiness to shift their dogs to a vegan diet.
Pets & Animal Supplies Recent Development
- In February 2025, Mars Petcare unveiled new personalised nutrition solutions that utilise AI to create tailored pet food according to breed, age, activity level, and health conditions.
- Petco introduced an innovative subscription wellness platform that combines the consistent supply of healthcare products with virtual veterinary consultations and preventative care guidance in March 2025.
Pets & Animal Supplies Future Predictions
- The outlook for the upcoming years is positive, as the revenue market for pet supplies is anticipated to attain USD 167.70 billion by 2026, USD 177.40 billion by 2027, and USD 186.10 billion by 2028.
Conclusion
Pets & Animal Supplies Statistics: The pet food sector is flourishing, propelled by the changing preferences of pet owners. Consumers emphasise aspects such as flavour, brand reliability, and nutritional content when selecting pet products.
Quality continues to be a primary concern, prompting many to explore premium alternatives. Pet owners utilize a variety of shopping avenues, ranging from speciality shops to online marketplaces.
There is a high level of awareness regarding pets’ dietary requirements, with an understanding that cats and dogs have distinct needs. Some individuals are willing to provide dogs with a vegan diet, citing health benefits and environmental considerations. In summary, the industry is evolving to accommodate shifting demands, indicating potential growth as pets increasingly become beloved family members.
FAQ’s
The largest companies in the pet supply sector are primarily led by food industry giants such as Nestlé Purina PetCare and Mars Petcare, typically evaluated based on their substantial revenue. However, when taking into account retail and overall supply, significant contributors include major retailers like Chewy and Petco, as well as global distributors such as Pet Brands. These entities exert considerable market influence, particularly through brands owned by parent companies like Nestlé and Mars, alongside specialized companies like Hill’s Pet Nutrition.
Retailers that have made investments in this sector generally achieve an average profit margin exceeding 60%. This profitability enables their businesses to effectively manage costs and expand. The most sought-after products include chewing toys and bones, which can yield profit margins as high as 70%.
For directions to Maximum Pet Supplies, located at 87 Rata St, Lower Hutt, please use Waze.