
Introduction
Print on Demand Statistics: The Print on Demand (POD) industry is transforming publishing, merchandising, and custom product creation by enabling goods to be manufactured only after an order is placed, cutting inventory costs and supporting more agile business models.
Fueled by the growth of e-commerce platforms and advancements in digital printing, POD is seeing widespread adoption across apparel, home decor, books, and promotional merchandise.
Rising demand for personalized products and the emphasis on sustainable practices are further driving its growth, as POD helps reduce overproduction and waste. Analyzing POD statistics is vital to capture market trends, consumer preferences, and revenue opportunities, providing key insights into the evolving landscape of on-demand manufacturing and retail.
Editor’s Choice
- Around 36% of consumers now expect personalized products as a standard offering.
- More than 36,000 monthly Google searches in the U.S. are made for “print on demand.”
- Only about 24% of POD startups manage to achieve long-term sustainability.
- Nearly 49% of consumers are willing to pay extra for eco-friendly POD products.
- Leading POD items in 2025 include t-shirts, baby wear, and mugs.
- Roughly two-thirds of POD sellers rely on Printful as their fulfillment partner.
- Successful POD apparel stores generate $50–$100 per order on average.
- The POD business model shows a modest 24% success rate overall.
- Store longevity directly impacts website visibility and ranking performance.
- Average POD store conversion rates are around 1.7%, aligning with e-commerce benchmarks.
- Interest in POD has skyrocketed, increasing by 300% over the past five years.
- Over 60% of POD companies conduct business primarily through online channels.
- Profit margins in POD typically range between 20% and 30% per product.
- T-shirts remain dominant, accounting for about 40% of all POD sales.
- Popular POD categories include apparel, accessories, home décor, and stationery.
- The U.S. leads globally, representing nearly 40% of the market.
- Around 25% of POD businesses are startups under two years old.
- Shopify, Etsy, and WooCommerce are the top platforms, with Shopify holding a 30% share in 2023.
- The average order value in POD e-commerce is approximately $45.
- More than 75% of POD businesses report consistent year-over-year growth.
- Custom apparel, especially hoodies, t-shirts, and tanks, is the most common POD niche.
- Personalized artwork and designs account for over 55% of POD sales.
(Source: Gitnux.org, Printify, Inc., Kornit Digital, Do Dropshipping, LLCBuddy)
General Print on Demand Statistics
- Printify saw a 69% increase in monthly active users and a 39% rise in new registrations in the first half of 2020.
- A FicShelf survey revealed that 67% of top self-published titles were authored by women, compared to only 39% in traditional publishing.
- Amazon’s share of self-published print books in the U.S. surged from 6% in 2007 to 92% by 2018, according to Bowker.
- Deloitte estimated the global audiobook market at $3.5 billion, with the U.S. and China making up nearly 75% of demand.
- By 2022, digital printing’s market share in value was projected to grow from 15.7% to 19.3% due to advanced presses.
- Vanity press publishers declined sharply, falling from 73% of published books in 2007 to just 6%.
- Russian government statistics in 2012 indicated that 90% of available Russian e-books were pirated copies.
- Smithers forecasted the global printing market to reach $821 billion by 2022, driven by digital and POD printing.
- Self-publishing emerged as the fastest-growing print category, posting a CAGR of around 17%.
- Author Earnings reported that 85% of eBooks read on Amazon were self-published, alongside 2,000 audiobooks via Audible.
- About 18% of e-readers prefer using a different app for digital reading.
- If returns are available within 12 hours, 62% of consumers are more likely to complete an online purchase.
- Around 92% of buyers would repurchase if returns were simple, while 79% preferred free returns.
Moreover
- More than 90% of teachers and parents agreed that reading 15 pages daily on paper benefits children’s memory and language development.
- Amazon is estimated to sell 60% of all books, listing 1.4 million self-published titles.
- Nearly 49% of merchants offer free return shipping, while 67% of shoppers check return policies before buying.
- A social video marketing report found that a brand’s social media activity influenced 73% of consumers.
- Video streaming accounted for 82% of all global internet traffic in 2019.
- 86% of people earning above $75,000 annually read at least one book last year.
- Printful experienced a 70% order surge during the weekend, handling 204 orders per minute, double the 2019 rate.
- Printful also reported an 80% YoY rise in order volume and a 44% YoY increase in new stores across three quarters in 2020.
- Google Trends in 2021 showed custom tote bags being searched 100+ times per week, printed bed sheets 50–100 times weekly, and strong global demand for custom shoes.
- During Cyber Week, 43% of businesses launched campaigns early, while 33% introduced new products.
- Face masks made up 38% of top-selling new POD items during the pandemic.
- In the last year, 27% of consumers tried new products for sustainability reasons, and 25% spent more on eco-friendly fashion.
(Source: Printify, Selfpublishingadvice, Webinarcare, Cloudways, Asicentral, Statista)
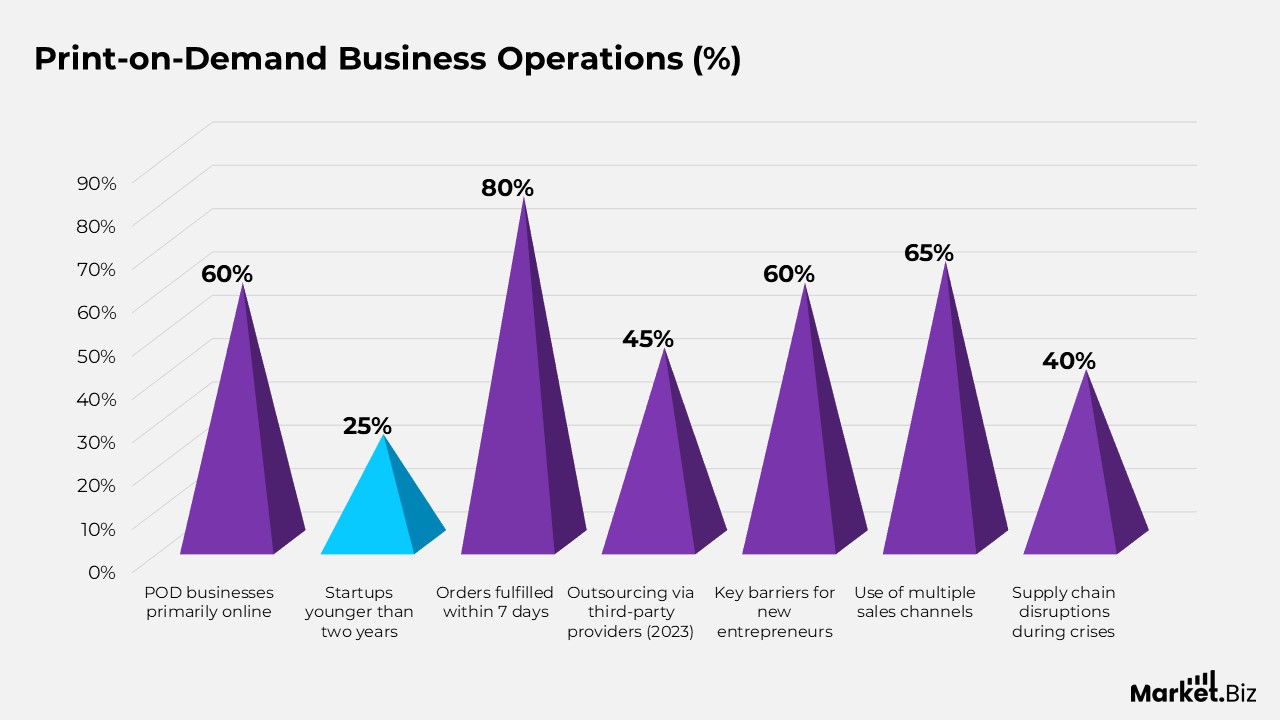
Print-on-Demand Business Operations Statistics
- More than 60% of POD businesses run primarily online, reflecting the digital-first nature of the industry.
- Nearly 25% of POD ventures are startups younger than two years, showing rapid entry and experimentation.
- The zero-inventory model of POD reduces upfront investment and minimizes financial risks for entrepreneurs.
- On average, it takes 2–3 weeks to move from product design to market launch in POD.
- About 70% of POD designers operate part-time or as hobbyists, while only 30% pursue it full-time.
- Roughly 80% of orders are fulfilled within seven days, with some platforms offering faster options.
- By 2023, nearly 45% of POD businesses outsourced production through third-party fulfillment providers.
- The average POD store operates for about 2.5 years, often closing after meeting short-term revenue targets.
- Launching a POD store typically costs under $500, making it a low-barrier entry for new sellers.
- The order-to-shipment downtime averages 3–5 days, with some services providing next-day dispatch.
- Over 60% of new entrepreneurs identify a lack of technical expertise, marketing know-how, and initial capital as key barriers.
- Around 65% of POD sellers use multiple channels online and offline to diversify sales streams.
- Approximately 40% of POD businesses reported supply chain disruptions during crises such as COVID-19.
(Source: Gitnux.org, DemandSage, Statista)
Consumer Preferences For Print-on-Demand
- Around 81% of consumers favor brands that deliver personalized shopping experiences.
- Nearly 80% of buyers are willing to spend about 9.7% extra on environmentally friendly products.
- Demand for sustainable POD apparel is expanding at a pace more than 5 times faster than traditional clothing.
(Source: Ecommerce-platforms.com, Statista)
Print on Demand Market Size
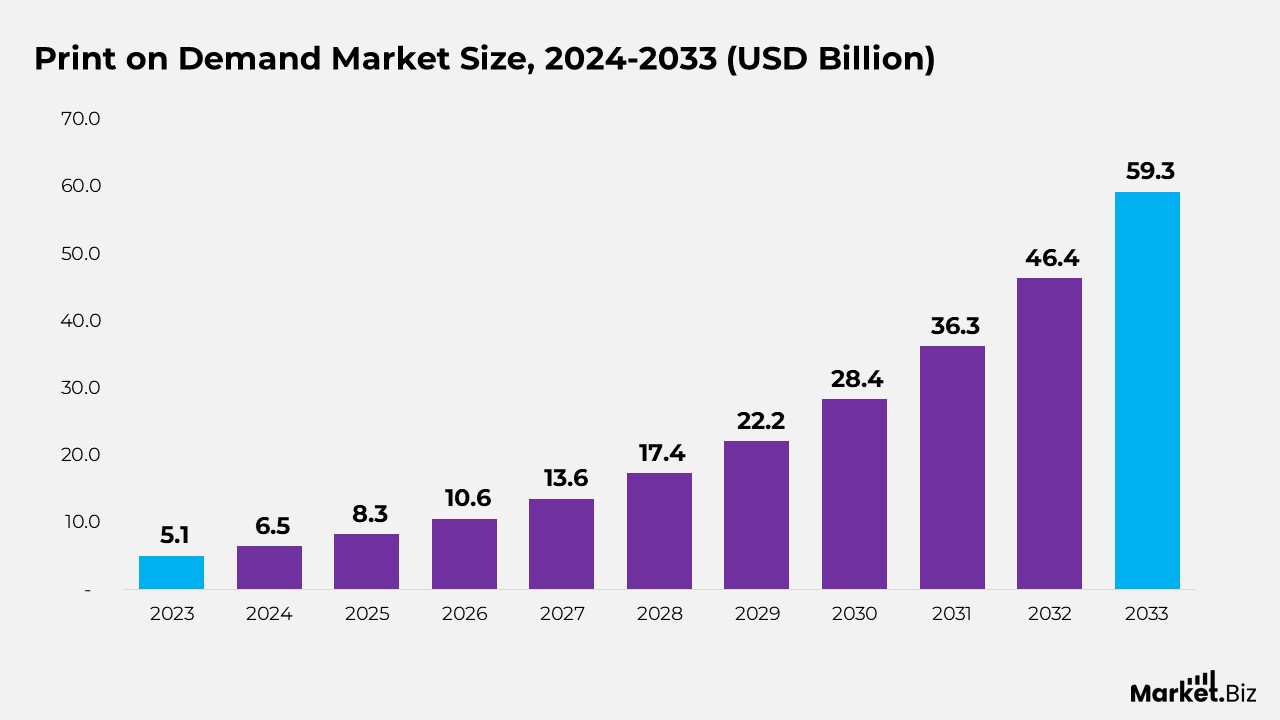
- According to Market.us, the print on demand market is expected to rise from $6.5 billion in 2024 to $59.3 billion by 2033, representing a compound annual growth rate (CAGR) of 27.8% from 2024 to 2033.
- The market is growing due to rising demand for customized products, flexibility of the model, and expansion of online shopping platforms, attracting small businesses and individuals.
- The Print on Demand market is segmented by platforms, with the software segment dominating 72% share through integrated and stand-alone systems.
- Apparel leads the product category with a 37.5% share and a strong 26.4% CAGR, ahead of home décor, drinkware, and accessories.
- Sellers on platforms like Printify typically reach $1,000 in revenue in 165 days, while top performers achieve it in just 118 days.
- Sustainability plays a major role, with 48% of U.S. consumers valuing eco-friendly products and 69% willing to pay more for them as per the Blue Yonder 2023 survey.
- The U.S. dominates globally, with 75.8% of top POD stores based there, supported by strong e-commerce and social commerce adoption.
- Social platforms drive sales, as 9 out of 10 shoppers purchase products from brands they follow online.
- North America holds a 40% market share, valued at USD 2.04 billion, supported by advanced e-commerce infrastructure and high consumer personalization demand.
(Source: Market.us)
Print on Demand App Market Size
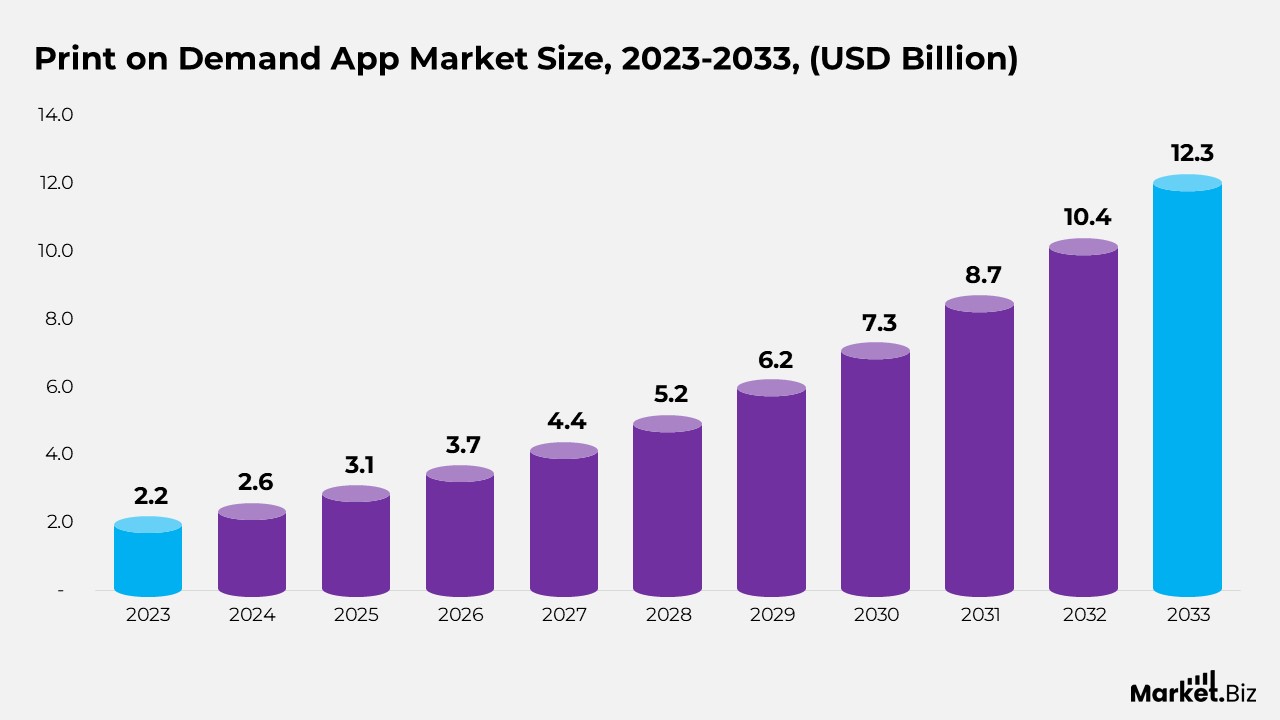
- According to Market.us, the print-on-demand app market is expected to rise from $2.6 billion in 2024 to $12.3 billion by 2033, representing a compound annual growth rate (CAGR) of 18.8% from 2023 to 2033.
- The market is expanding with the rise of personalized merchandise and e-commerce, enabling individuals and brands to enter with minimal upfront costs.
- In 2023, the Clothing and Apparel segment dominated with a 56.7% share, driven by the popularity of personalized fashion.
- In 2023, the Android segment led with a 41% share, supported by its global adoption and vast user base.
- In 2023, Small and Medium Enterprises (SMEs) captured a 47.8% share, leveraging POD apps for cost-effective growth and customer engagement.
- Over 10,000 Shopify stores now use POD, with the market growing 12% in four years, fueled by demand for customized products.
- Custom t-shirt brands are projected to earn $10 billion by 2025, with clothing contributing 62% of all POD sales and black being the most popular color.
- About two-thirds of POD stores rely on Printful, while top POD apparel stores generate $50–$100 per order, with the business model showing a 24% success rate.
- POD stores report an average 1.7% conversion rate, and interest in the sector has surged 300% in the last 5 years.
(Source: Market.us)
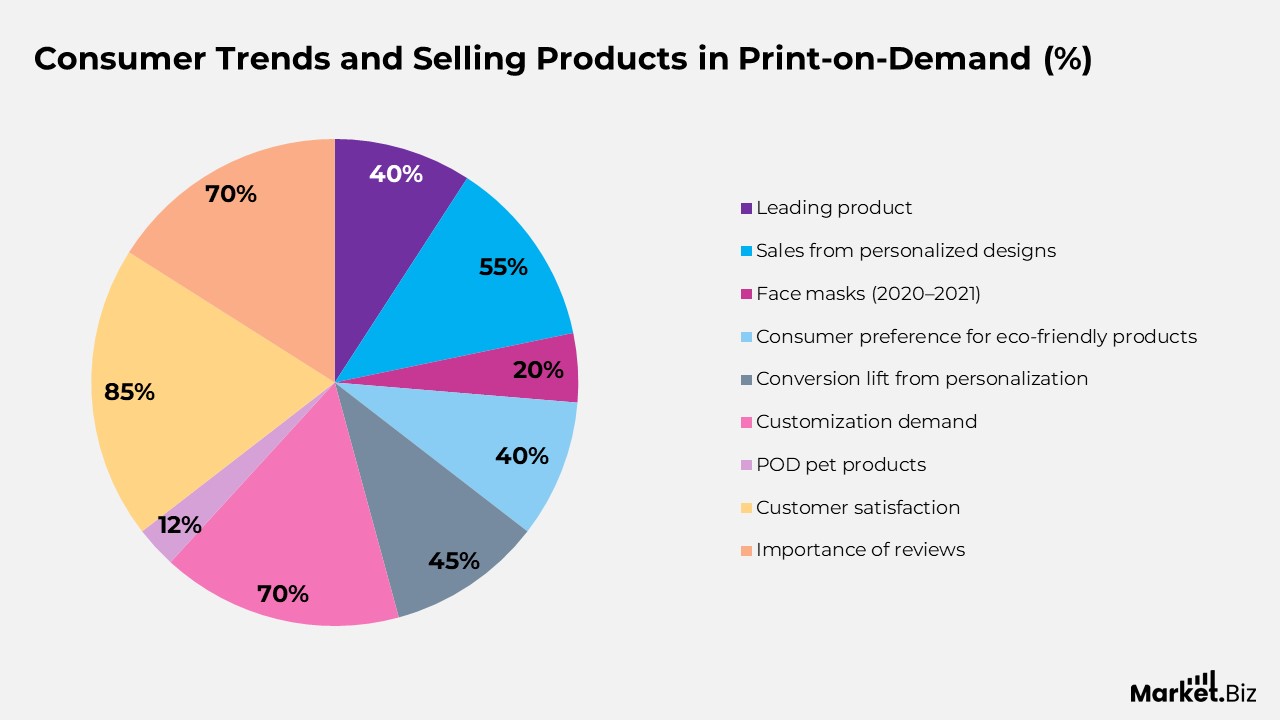
Consumer Trends and Selling Products in Print-on-Demand
- T-shirts remain the leading product, accounting for about 40% of all POD sales.
- Key product categories include apparel, accessories, home décor, and stationery.
- Custom apparel, especially hoodies, t-shirts, and tank tops, forms the most dominant niche.
- Personalized artwork and designs generate more than 55% of POD sales.
- Custom mugs consistently rank among the top 10 best-selling POD products worldwide.
- Face masks surged in popularity during 2020–2021, making up over 20% of POD sales in that period.
- Eco-conscious options are on the rise, with around 40% of consumers preferring sustainable POD products.
- Personalization features enhance sales, with some stores achieving up to a 45% increase in conversions.
- Holiday shopping trends favor personalized ornaments, custom mugs, and seasonal apparel.
- Customization is highly valued, with more than 70% of customers preferring tailored products over generic ones.
- Customized pet items, including apparel and accessories, now represent about 10–12% of POD pet-related sales.
- Customer satisfaction is strong, with over 85% of buyers happy with both product quality and delivery timelines.
- Peer reviews drive trust, with more than 70% of shoppers relying on them over product descriptions.
- The average life cycle of a POD product design is roughly 1.5 years, making constant innovation essential.
- Visual branding and professional mockups are crucial, boosting conversion rates by up to 50%.
(Source: Gitnux.org, Statista)
Financial Performance in Print-on-Demand
- The typical profit margin for POD products falls between 20% and 30%.
- The average order value in POD e-commerce is about $45.
- Margins can be increased by upselling and add-on sales, boosting profits by as much as 15%.
- Customer retention averages around 25%, reflecting strong repeat purchase potential.
- The standard order size is roughly 1.5 items per transaction.
- Customer acquisition costs (CAC) usually range from $15–$25, depending on the marketing channel used.
- A royalty or profit-sharing model is the most common payment structure, applied by nearly 65% of sellers.
- Around 20% of POD sellers generate annual earnings exceeding $50,000, showing strong income potential.
- Market saturation and thin margins contribute to about 30% of store closures.
- In their first year, POD businesses average $10,000 in revenue, while top performers surpass $100,000.
- CAC in POD dropshipping is about $20, considered moderate compared to other e-commerce models.
(Source: Gitnux.org, Statista, DemandSage)
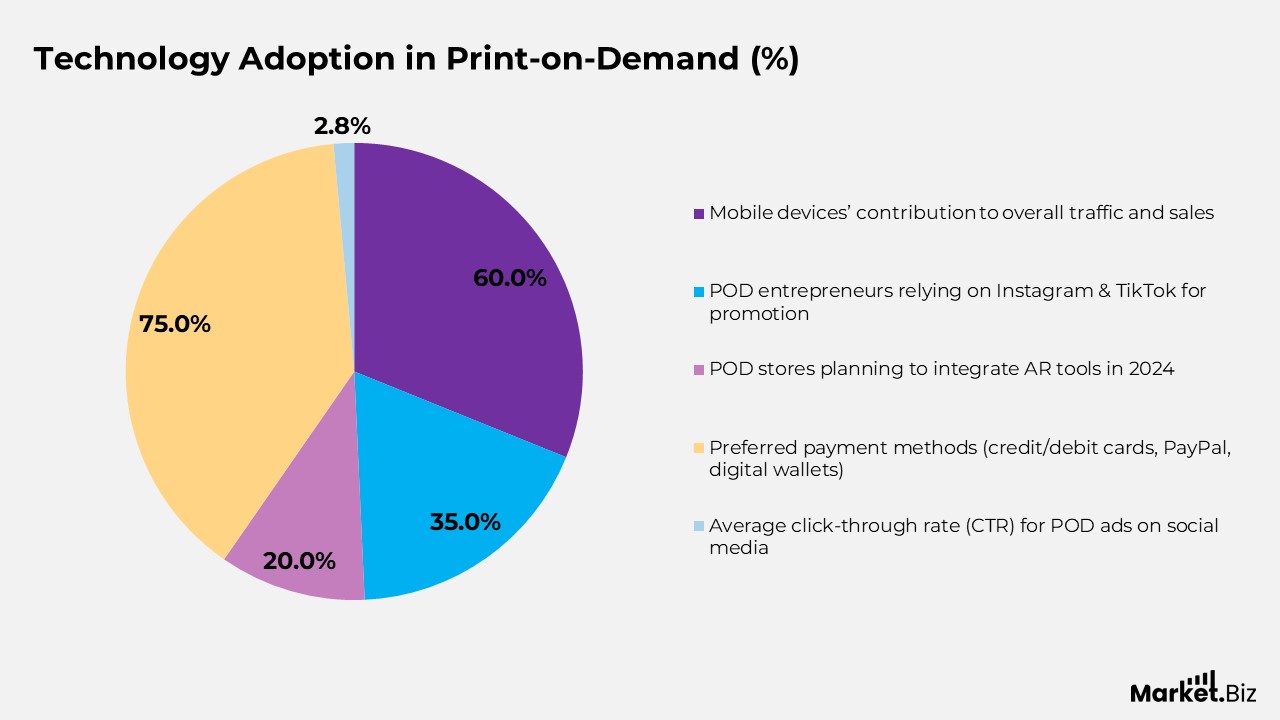
Technology Adoption in Print-on-Demand
- Mobile devices contribute to more than 60% of overall traffic and sales, highlighting the need for mobile-friendly store design.
- Around 35% of POD entrepreneurs rely on social platforms such as Instagram and TikTok to promote their products.
- The use of augmented reality in POD shopping is on the rise, with about 20% of stores planning to integrate AR tools in 2024.
- Preferred payment methods include credit and debit cards (over 75%), along with PayPal and digital wallets for easy checkout.
- The average click-through rate (CTR) for POD ads on social media stands at roughly 2.8%, showing moderate campaign performance.
(Source: Gitnux.org, Statista, DemandSage)
Conclusion
The Print-on-Demand market has established itself as a key driver of digital entrepreneurship, combining creativity with commerce through a low-risk, inventory-free model. Growing consumer interest in personalization and sustainable products is accelerating adoption, while e-commerce platforms and third-party fulfillment make it easier for entrepreneurs to participate.
Apparel continues to lead the segment, driven by quick turnaround times and global demand. At the same time, the sector grapples with challenges such as supply chain vulnerabilities, gaps in technical and marketing expertise, and relatively short business lifecycles.
Even with these obstacles, POD is set to remain a vital part of online retail, offering individuals and brands the chance to expand, innovate, and align with shifting consumer expectations.
FAQ’s
Print-on-Demand is a business approach where products are manufactured only after a purchase is made, enabling sellers to operate without inventory and minimize upfront risks.
The POD sector is expanding consistently, driven by growing consumer interest in personalized products and the rising significance of environmentally responsible choices.
Apparel takes the lead, with items like t-shirts, hoodies, and children’s wear being highly favored. Beyond clothing, home décor, drinkware, and accessories also enjoy strong demand.
The time to market is relatively short, as new designs can be uploaded quickly and made available through digital platforms with minimal delay.
Earnings depend on factors such as product selection, platform charges, and promotional strategies, but the model offers flexibility and scalability for revenue generation.
The strongest presence is seen in areas with mature e-commerce systems and high digital engagement, where shoppers are highly receptive to customized offerings.