
Introduction
Digital Remittance Statistics: The digital remittance market reflects a fast-evolving financial ecosystem shaped by rising global migration, expanding smartphone usage, and the shift toward secure online payment platforms.
As governments and financial institutions promote digital payment infrastructure to improve financial inclusion and reduce informal transfers, fintech providers accelerate innovation with real-time currency conversion, AI-enabled verification, and user-friendly mobile applications.
These advancements enhance transfer speed, lower transaction costs, and increase transparency, making digital channels the preferred choice for millions of migrant workers.
Digital remittance statistics, therefore, offer essential insights into transaction volumes, user demographics, and regional remittance flows, helping stakeholders identify growth opportunities, address regulatory requirements, and enhance service efficiency across major remittance corridors.
Editor’s Choice
- Mobile-based remittances accounted for 60% of all digital transfers in 2025, underscoring the growing reliance on smartphones for cross-border payments.
- India, with USD 125 billion; Mexico, with USD 66.24 billion; and China, with USD 49.5 billion, are the leading remittance-receiving nations in 2025.
- Fintech platforms handle 60% of global remittance volumes by the end of 2025, reflecting a steady shift away from conventional bank-led transfers.
- Blockchain-enabled remittance solutions accounted for 12% of global transactions in 2025 as users adopted transparent, cost-efficient systems.
- The cost of sending USD 200 through digital channels declines to 4.6% in 2025, down from 7% in 2017, moving closer to the UN’s affordability benchmark of 3%.
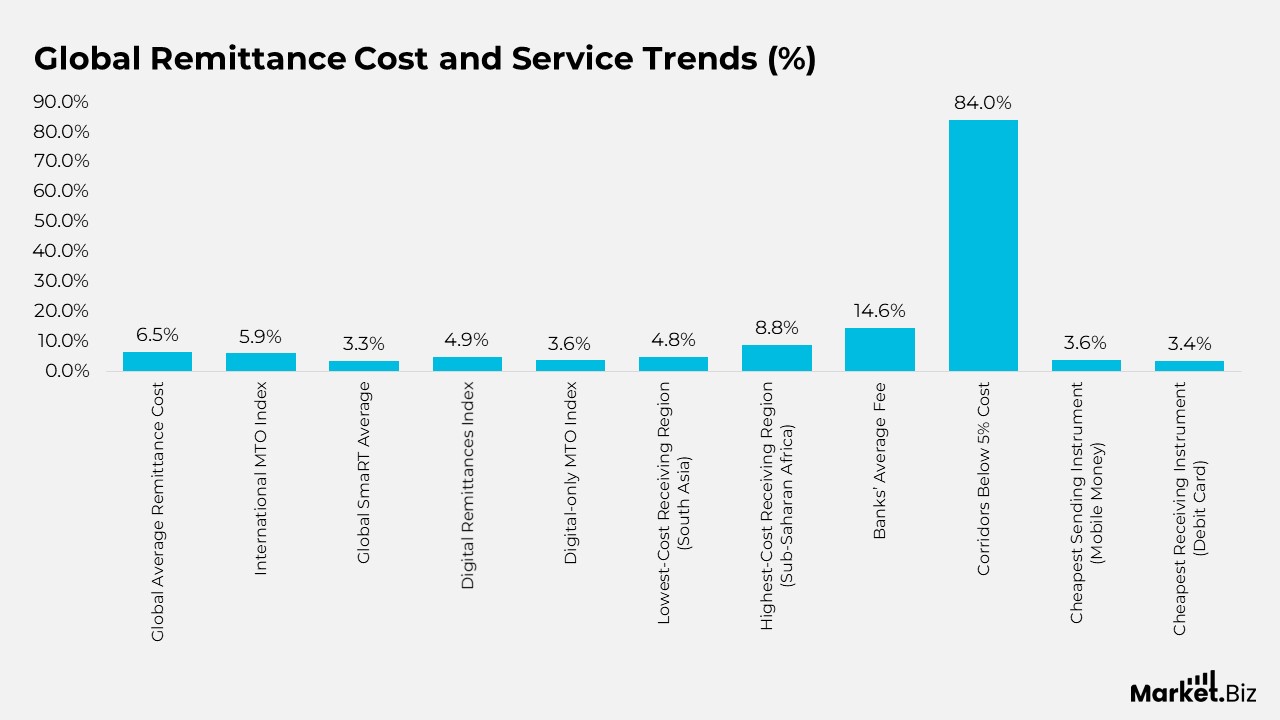
Global Remittance Cost and Service Trends
- The Global Average remittance cost increased to 6.49 per cent in Q1 2025 from 6.26 per cent in Q4 2024.
- The International MTO Index declined to 5.91 per cent from 6.05 per cent in Q4 2024.
- The Global SmaRT Average rose to 3.29 per cent, up from 2.91 per cent in Q4 2024, and 22 corridors recorded no SmaRT-qualifying services.
- The Digital Remittances Index grew to 4.85 per cent, rising from 4.64 per cent in Q4 2024.
- The Digital-only MTO Index dropped to 3.55 per cent, down from 3.68 per cent in Q4 2024.
- South Asia remained the lowest-cost receiving region at 4.80 per cent, while Sub-Saharan Africa was the most expensive at 8.78 per cent.
- Banks remained the highest-cost providers, with an average fee of 14.55 per cent.
- The proportion of corridors with average costs below 5 per cent rose significantly from 17 per cent in Q1 2009 to 84 per cent in Q1 2025.
- Mobile money was the cheapest method for sending remittances at 3.63 per cent, and debit cards were the lowest-cost receiving instrument at 3.44 per cent.
- Due to the Russia-Ukraine conflict, RPW excluded data from Russian corridors in Q1–Q2 2022; from Q3 2022 to Q1 2025, only publicly available data were collected and excluded from the main Q1 2025 analysis due to methodology differences.
- In Q1 2025, 31 services moved from the prospects index to the main analysis, while 55 new services were added to the prospects index for continued monitoring.
(Source: The World Bank, Remittance Prices Worldwide)
International MTO Pricing Trends
- The International MTO Index measures remittance prices from providers operating in at least 85 per cent of the corridors in the RPW database.
- In Q1 2025, the index declined to 5.91 percent, down from 6.05 percent in Q4 2024.
- Compared to Q1 2024, when the index stood at 6.30 per cent, the year-over-year decline is 0.40 percentage points.
- Since its initial reading of 10.36 per cent in Q1 2009, the index has fallen by 4.45 percentage points, indicating sustained long-term cost reductions.
- The digital-only MTO Index was recorded at 3.55 per cent in Q1 2025, down from 3.68 per cent in Q4 2024.
- Digital-only MTO pricing remains lower than both the broader International MTO Index and the global average, reinforcing the cost efficiency of digital channels.
(Source: The World Bank, Remittance Prices Worldwide)
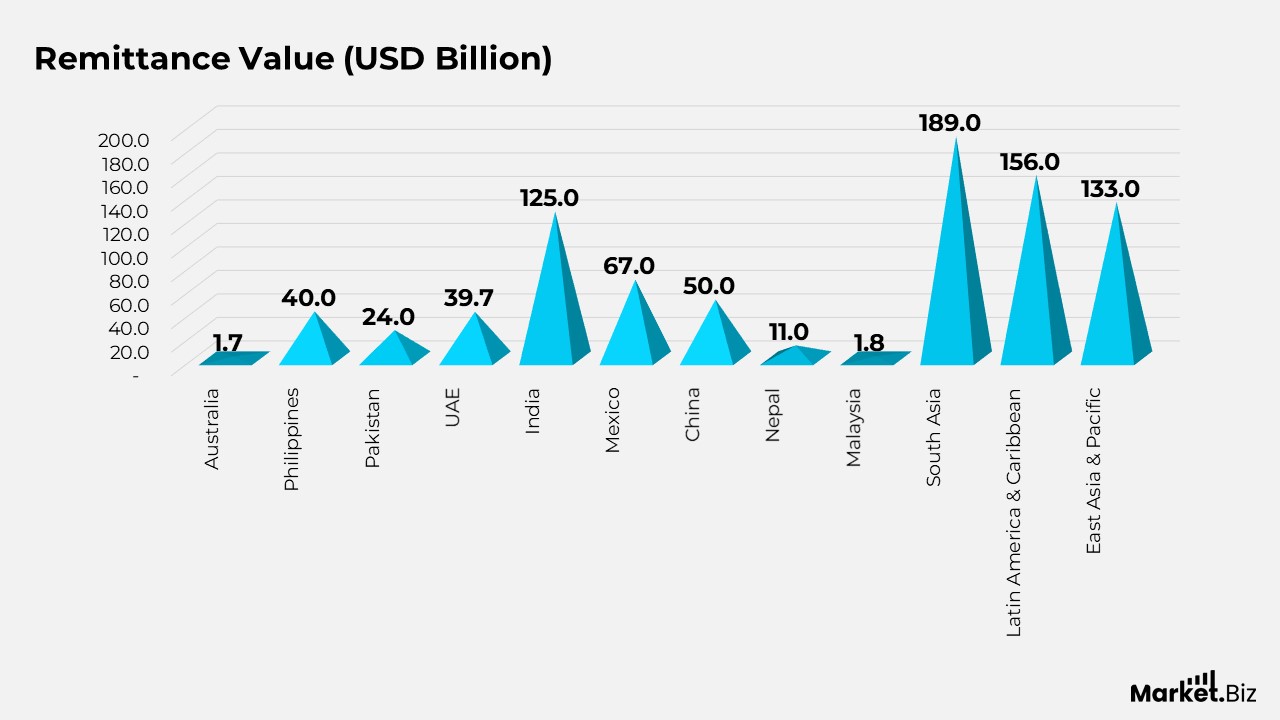
Global Remittance Flows and Country
- Australia recorded remittance outflows of USD 1.65 billion in 2023, sending more funds abroad than it received in remittances.
- The Philippines received USD 40 billion in 2023, equivalent to 9.2 per cent of its GDP.
- Pakistan’s remittance inflows reached USD 24 billion in 2023, representing 7 per cent of its GDP.
- The UAE registered outbound remittances of USD 39.67 billion in 2022, making it the second-largest source country after the United States.
- India generated USD 125 billion in remittances in 2023, contributing 3.4 percent to its GDP, the highest inflow of any country globally.
- Mexico and China received USD 67 billion and USD 50 billion, respectively, securing second and third positions among global remittance recipients.
- Nepal achieved a record USD 11 billion in 2023, accounting for 26.6 per cent of its GDP.
- Malaysia reported USD 1.75 billion in remittance inflows in 2023, with outbound transfers significantly exceeding inflows.
- In 2023, South Asia received USD 189 billion, Latin America and the Caribbean received USD 156 billion, and East Asia and the Pacific received USD 133 billion, making them the top regional beneficiaries of global remittance flows.
(Source: G2.com, Inc., Statista)
Technology Advancements Transforming Digital Remittances
- Around 90 per cent of financial institutions now rely on AI-driven fraud detection, enabling faster threat recognition and reducing the volume of fraudulent activity.
- RippleNet’s global coverage has expanded to more than 70 countries, allowing cross-border payments to clear within 3 to 5 seconds, far outpacing traditional settlement timelines.
- The integration of biometric security into digital remittance systems has helped reduce unauthorised transactions by 22 per cent, strengthening overall platform security and consumer confidence.
- API-based connectivity between conventional banks and digital remittance providers has simplified international transfers, reducing average fees by 15 per cent while accelerating processing times.
- The smart contracts industry is expected to rise from USD 3.69 billion in 2025 to nearly USD 815.86 billion by 2034, reflecting its expanding role in automating and securing remittance workflows.
- The expansion of mobile wallets such as Apple Pay and Google Pay has boosted mobile remittances by 45 per cent, offering users quick, tap-based transfer options.
- AI-enabled chatbots embedded in remittance applications are transforming customer support, delivering instant responses and reducing query resolution time by 35%.
(Source: CoinLaw.io)
Shifting Consumer Preferences in Digital Remittance Methods Across the Asia Pacific
- Digital apps remain the leading choice for sending and receiving remittances across Asia Pacific, with high usage reported in India (74%/76%), the Philippines (74%/66%), and Singapore (70%/75%).
- Despite strong adoption, India has seen noticeable behavioural shifts, with 67% sending and 54% receiving money through digital apps more frequently over the past year.
- In Japan, the preference for digital app usage increased by 10%, reaching 58%/56% in 2025.
- In China, digital app preference remains relatively high at 66%/61%, though this marks a 5% decline and a 10% decline compared to 2024.
- Even with strong digital reliance in Singapore, a significant share of respondents shifted towards check or money order methods (45%/46%).
- In Australia, digital apps are favoured by 69%/65%, yet many respondents reported increased use of checks or money orders via courier (42%/33%) and via a person (38%/35%).
- Across all surveyed markets, digital remittance services accessed in physical locations ranked second, after mobile app usage.
- Ease of use for sending and receiving digital remittances was acknowledged prominently in Singapore (51%/51%), the Philippines (48%/54%), Japan (47%/42%), and Australia (42%/40%).
(Source: Digital Remittances Adoption Report, Visa)
Motivations and User Experiences in Digital Remittances Across Europe
- Across all surveyed European markets, unexpected financial needs remain the leading reason for sending remittances, with the highest responses in France (31 per cent), Norway (30 per cent), and Poland (30 per cent).
- Sending money for personal savings or investments was especially common among respondents in Denmark (30 per cent) and Poland (26 per cent).
- Humanitarian motives ranked strongly as well, cited by participants in Denmark (32 per cent), France (28 per cent), Germany (26 per cent), Norway (29 per cent), Sweden (25 per cent), and the UK (22 per cent).
- Special occasions were the primary reason for receiving remittances in Germany (28 per cent), Norway (28 per cent), Sweden (30 per cent), and the UK (36 per cent).
- Holiday-related remittances were the dominant motivation in Denmark (29 per cent), France (38 per cent), and Poland (32 per cent).
- Roughly half of respondents across Europe reported no challenges when sending or receiving digital remittances, with the most positive feedback coming from the UK (60%/61%), France (57%/59%), Sweden (56%/69%), and Germany (56%/59%).
- Among those who did experience issues, high transaction fees remained the most common concern, though at comparatively lower levels than in other global regions, especially in the UK (19%/17%), Poland (19%/17%), and Sweden (19%/11%).
Digital and Physical Remittance Preferences in Latin America
- Strong trust in digital security drives high adoption of remittance apps across Latin America, with security cited as a key reason for sending and receiving in Brazil (66%/62%), Mexico (49%/39%), and Peru (47%/41%).
- A significant share of users reported no issues with digital remittance apps: Brazil (49%/52%), Mexico (40%/46%), and Peru (37%/37%).
- High fees consistently emerged as the main drawback of digital remittance apps, identified by respondents in Brazil (31%/22%), Peru (25%/25%), and Mexico (22%/15%).
- Physical remittance channels such as cash, checks, and money orders scored extremely low on perceived safety, with safety ratings ranging from 1% to 4% in Brazil, 3% to 7% in Peru, and 4% to 6% in Mexico.
- In Mexico, the top challenges when sending physical remittances were calculating exchange rates (41%), high fees (30%), and the need to visit a physical location (29%).
- For receiving physical remittances in Mexico, the most common issues were the need to visit a physical location (27%) and having to travel long distances to collect funds (23%).
(Source: Digital Remittances Adoption Report, Visa)
Remittance Behavior and Motivations in the Middle East
- Remittance activity in the Middle East shows a slight year-over-year decline of 6 per cent, yet most respondents still send or receive funds at least once a year.
- In Saudi Arabia, the share of respondents sending and receiving money dropped by 5 per cent and 4 per cent, respectively, compared with 2024.
- Expectations for future remittances in Saudi Arabia remain steady for sending at 28 per cent, while expectations for receiving have declined by 3 per cent to 24 per cent.
- In the UAE, there is a 6 per cent decline in respondents who sent remittances in the past year and an 8 per cent decline in those planning to send in the next 12 months.
- Despite this, UAE respondents show a mild increase in remittance receipt: 42 per cent received funds in the past year (+2 per cent), and 32 per cent expect to receive funds in the coming year (+3 per cent).
- Annual remittance participation remains extremely high, with UAE respondents sending and receiving at least once per year at 95%/81%, similar to 2024 levels.
- In Saudi Arabia, remittance activity rose slightly to 93%/77%, up 6 per cent and 4 per cent, respectively.
- Humanitarian needs remain the main driver of remittance sending, reported by 51 per cent of participants in Saudi Arabia and 49 per cent in the UAE.
- Regular remittances also rank highly as a motivation (42 per cent in KSA and 48 per cent in UAE), followed by unexpected financial needs (37 per cent in KSA and 42 per cent in UAE).
(Source: Digital Remittances Adoption Report, Visa)
Remittance Cost Shifts Among G8 Sending Countries
- G8 nations remain major global remittance senders, with their average cost decreasing from 6.08% in Q4 2024 to 5.99% in Q1 2025.
- On a year-over-year basis, the average increased slightly by 0.12 percentage points, rising from 5.87% in Q1 2024.
- digitalItaly recorded the steepest rise in remittance costs, increasing from 7.35% to 8.45%.
- France experienced a small uptick, with costs moving from 5.07% to 5.14%.
- The United Kingdom showed the largest decline, reducing its average cost from 5.98% to 5.56%.
- The United States posted an identical decrease, dropping from 5.98% to 5.56%.
- Japan saw a slight improvement, with remittance costs falling from 7.26% to 7.11%.
- Canada recorded a decline from 6.10% to 5.98%, supporting the broader downward trend.
- Germany’s average cost eased from 6.14% to 6.02%, indicating incremental efficiency gains.
(Source: Digital Remittances Adoption Report, Visa)
Conclusion
Digital Remittance Statistics: The digital remittance landscape is undergoing a significant transformation, driven by rising mobile usage, stronger security frameworks, and the rapid expansion of fintech solutions across global markets. The migration away from traditional banking channels reflects the growing need for faster, more transparent, and cost-efficient money transfers.
Regional patterns indicate strong digital momentum in Asia Pacific, Latin America, and the Middle East, while Europe shows steady engagement, supported by convenience and user confidence. At the same time, evolving regulatory requirements around AML and data protection are reshaping how providers operate and invest in compliance.
Overall, the statistics highlight a sector that is becoming progressively more accessible, secure, and efficient, reinforcing digital remittances as a key pillar of international financial connectivity and inclusion.
FAQ’s
Digital remittances are rooted in the convergence of migration economics, financial technology innovation, and international payment system architecture. They represent the digital evolution of conventional remittance practices and draw upon frameworks such as financial inclusion theory, transaction cost economics, and models of technological diffusion.
These metrics provide empirical evidence on global money flows, enabling researchers to analyse migration-driven capital flows, patterns of digital technology adoption, levels of financial accessibility, and regulatory impacts. They contribute to theoretical examinations of how digital systems transform financial interactions across borders.
Digital remittances are classified as a component of the wider digital payments ecosystem, functioning as digitally facilitated mechanisms for transferring value. In theoretical terms, they are understood as tools that enhance efficiency, reduce transactional friction, and broaden equitable access to financial services.
Their expansion aligns with theories of innovation diffusion, network externalities, and systemic improvements in efficiency as digital infrastructure becomes more pervasive. Lower transaction costs and greater trust, enabled by technologies such as encryption and biometrics, accelerate user adoption.
Cost structure theory suggests that digital remittances incur lower marginal costs than traditional cash-based channels. Statistical indicators, including digital-only MTO cost measures, reinforce the theoretical premise that digitalization reduces operational expenses while intensifying market competition.