Introduction
Vending Machine Statistics: Smart vending machines that incorporate IoT and AI technology are revolutionizing the market by facilitating remote monitoring, real-time inventory oversight, and tailored customer experiences, as digital payment options increasingly supplant cash transactions. The growing demand for convenient snacks and drinks, driven by consumers’ fast-paced lifestyles, is increasing vending machine sales.
Vending machines, prevalent in contemporary retail environments, take various forms, including food and beverage dispensers and ticket and service providers. Users can select products through buttons or touchscreens and make payments using coins, bills, cards, or mobile payment options. Subsequently, the machines dispense the selected item, with inventory management systems monitoring stock levels to ensure timely replenishment.
Providing convenience, cost-effectiveness, and accessibility, vending machines serve as a passive revenue source for businesses, and data analytics can provide insights into consumer preferences. Current trends include healthier product offerings, cashless payment methods, the integration of smart technologies, customizable features, and an emphasis on sustainability.
Editor’s Choice
- The global vending machine market was estimated at approximately USD 18 billion in 2022.
- The vending machine sector is projected to expand at a compound annual growth rate (CAGR) of 4.5% from 2023 to 2030.
- Common types include snack vending machines that dispense items such as chips, candy bars, and healthier options such as granola bars.
- The global vending machine market has shown steady growth over the past 10 years, with a compound annual growth rate (CAGR) of 7.5%.
- The global vending machine market is divided by region, with North America accounting for the largest share at 33.0%.
- Manufacturing facilities exhibited the highest concentration of vending machines, accounting for 30.20% of the total.
- In 2017, the market achieved sales of 13.13 billion yuan, which rose to 19.29 billion yuan in 2018.
- An estimated 84% of vending machine operators utilise some form of electronic payment technology.
General Vending Machine Statistics
- The global vending machine market was estimated at approximately USD 18 billion in 2022.
- The Asia-Pacific region accounts for approximately 45% of the global vending machine market.
- It is estimated that there are more than 10 million vending machines in operation worldwide.
- In the United States, there are roughly 4.5 million vending machines.
- On average, a vending machine earns around USD 76 each week.
- Approximately 60% of vending machines are managed by independent operators.
- The most frequently sold items in vending machines consist of snacks, beverages, and candy.
- Vending machines that accept cashless payments constitute approximately 65% of the market.
- The vending machine sector is projected to expand at a compound annual growth rate (CAGR) of 4.5% from 2023 to 2030.
- The typical lifespan of a vending machine is approximately 10 years.
- An estimated 84% of vending machine operators utilize some form of electronic payment technology.
- The vending machine market in Europe is valued at over USD 10 billion.
- The vending machine industry is progressively integrating IoT technology for inventory management.
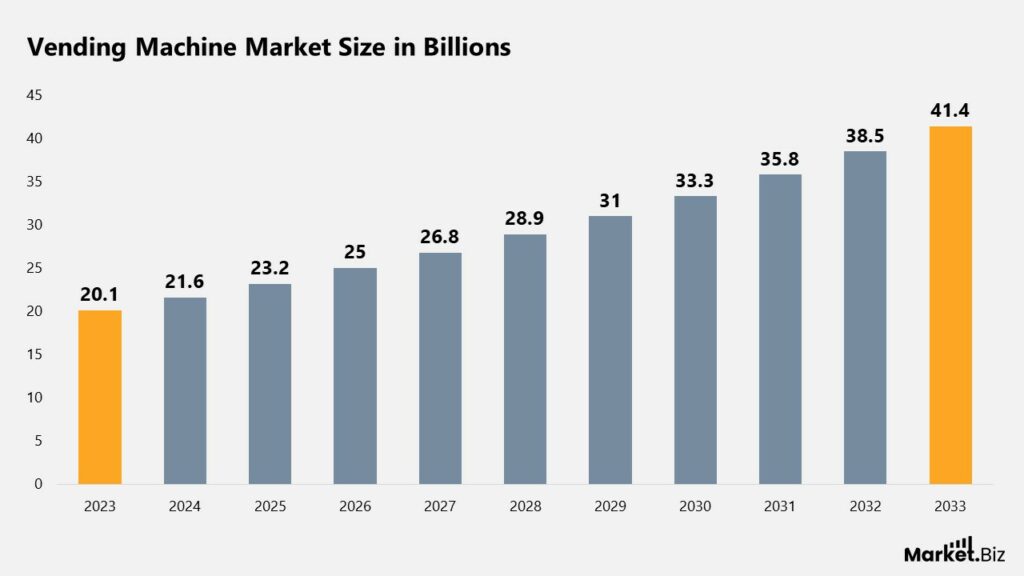
- The global revenue from the vending machine market is expected to reach USD 41.4 billion by 2033.
- Westomatic Vending Services Ltd. dominates the market with a 15% share.
- The global vending machine market is divided by region, with North America possessing the largest market share at 33%.
Types of Vending Machine Statistics
- Common types include snack vending machines that dispense items such as chips, candy bars, and healthier options such as granola bars.
- Beverage vending machines offer drinks, including soft drinks, water, and juices. Coffee vending machines serve a variety of hot beverages, such as espresso, cappuccino, and lattes.
- Combo vending machines merge snacks and beverages into a single unit, maximizing space and providing variety.
- Advanced smart vending machines incorporate features like touchscreens, digital payments, and mobile app connectivity, improving user convenience and operational efficiency.
- These machines typically measure 68-72 inches in height, 29-41 inches in width, and 30-36 inches in depth.
- Moreover, specialized machines, such as hot food vending machines, deliver fresh meals like hot dogs and pizzas, with dimensions approximately 75 inches in height, 55 inches in width, and 38 inches in depth.
Vending Machine Market Size Statistics
- The global vending machine market is projected to reach approximately USD 41.4 billion by 2033, up from USD 20.1 billion in 2023, with a 7.5% CAGR from 2024 to 2033.
- North America held a leading position in 2023, accounting for 44.7% of the global market and generating approximately USD 8.98 billion in vending machine revenue.
- In 2023, beverages emerged as the leading product category, accounting for 42.5% of sales, as consumer demand for ready-to-drink options remained strong across workplaces and public locations.
- Cash remained the most widely used payment method in 2023, accounting for 72.3% of transactions, reflecting a continued preference for simple, accessible payment methods in many regions.
- Offices accounted for the largest share of installations in 2023, at 45.6%, driven by consistent demand for convenient access to food and beverages during working hours.
- Automatic vending machines led the technology segment in 2023, accounting for 55.4% of the market, owing to their reliability and minimal human intervention.
- The vending machine industry experienced revenue pressure during the recent global health crisis. With total operating revenues declining to USD 251.2 million in 2021, down from USD 303.5 million in 2020, reflecting a 17.2% year-over-year decrease due to reduced foot traffic.
- Despite lower operating revenues, net income improved in 2021, rising to USD 17.1 million from USD 15.5 million in 2020, reflecting a 10.9% increase and highlighting improved cost management and operational efficiency.
- Product sales remained the core revenue driver, contributing 91.5% of total operating revenues, while secondary income sources accounted for 8.5%, indicating limited but supportive diversification within revenue streams.
Vending Machine Market by Region
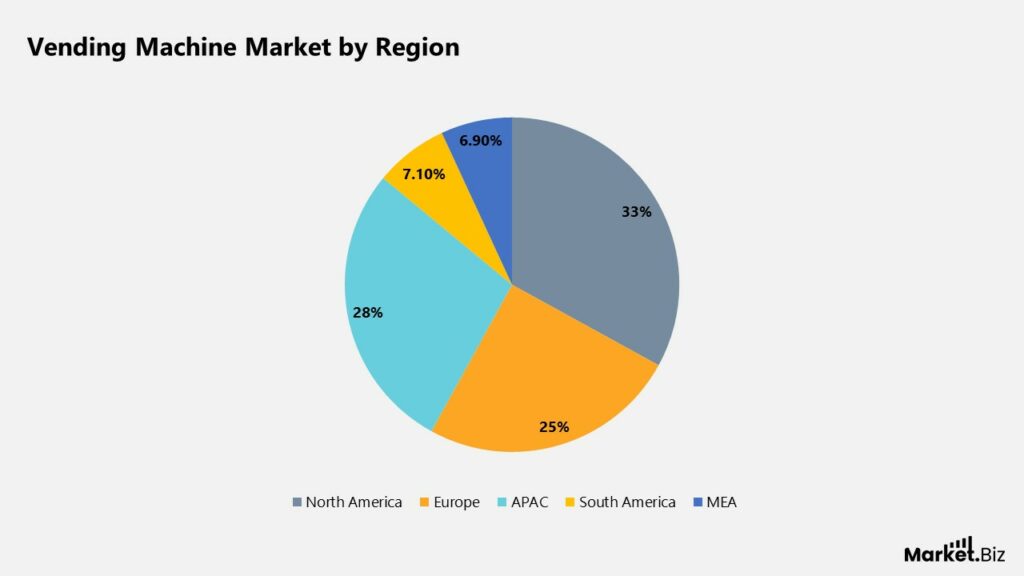
- The global vending machine market is divided by region, with North America accounting for the largest share (33.0%).
- The Asia-Pacific (APAC) region follows closely, accounting for 28.0% of the market.
- Europe also maintains a notable presence, accounting for 25.0% of the market.
- The South America and Middle East & Africa (MEA) regions account for smaller market shares, at 7.1% and 6.9%, respectively.
Locations of Vending Machines
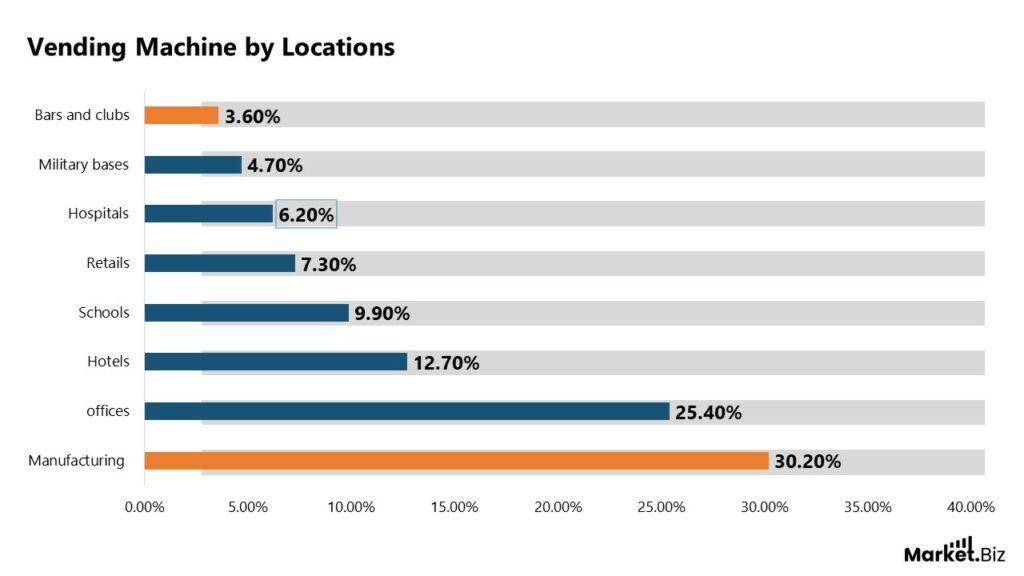
- Manufacturing facilities exhibited the highest concentration of vending machines, accounting for 30.20% of the total.
- Offices came next with 25.40%, indicating a notable presence in work environments.
- Hotels comprised 12.70% of vending machine installations, whereas schools accounted for 9.90%.
- Retail establishments accounted for 7.30%, and hospitals for 6.20%.
- Military installations, bars, and clubs had lesser shares, with 4.70% and 3.60%, respectively.
Vending Machines Sales Statistics
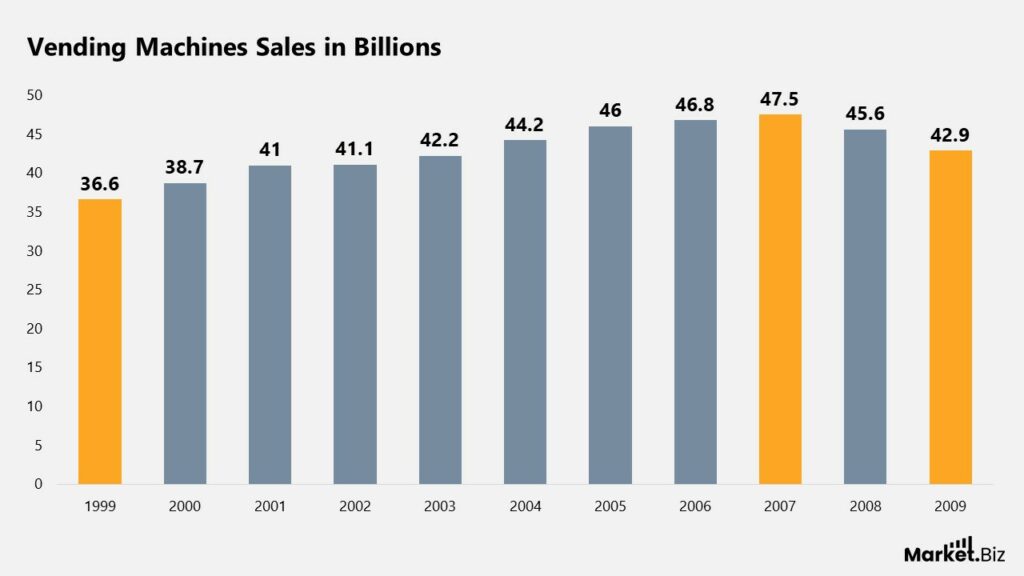
- In 1999, sales volume was USD 36.6 billion, increasing to USD 38.7 billion in 2000 and to USD 41 billion in 2001.
- The upward trend continued, with sales hitting USD 41.1 billion in 2002, USD 42.2 billion in 2003, and USD 44.2 billion in 2004.
- The highest growth was recorded in 2007, with total sales amounting to USD 47.5 billion.
- However, sales declined, falling to USD 45.6 billion in 2008, USD 42.9 billion in 2009, and USD 42.2 billion in 2010.
- In 2013, the average cash transaction at a vending machine was USD 1.16.
- Cashless transactions had an average value of USD 1.71.
- Three out of four vending machine transactions are made using cash.
- The snack and vending machine industry produces an average annual profit exceeding USD 64 million.
- Annual spending on vending machines in the United States exceeds USD 7 billion.
- Currently, there are around 4.6 million vending machines in operation across the United States.
Statistics of Retail Sales Revenue of Vending Machines
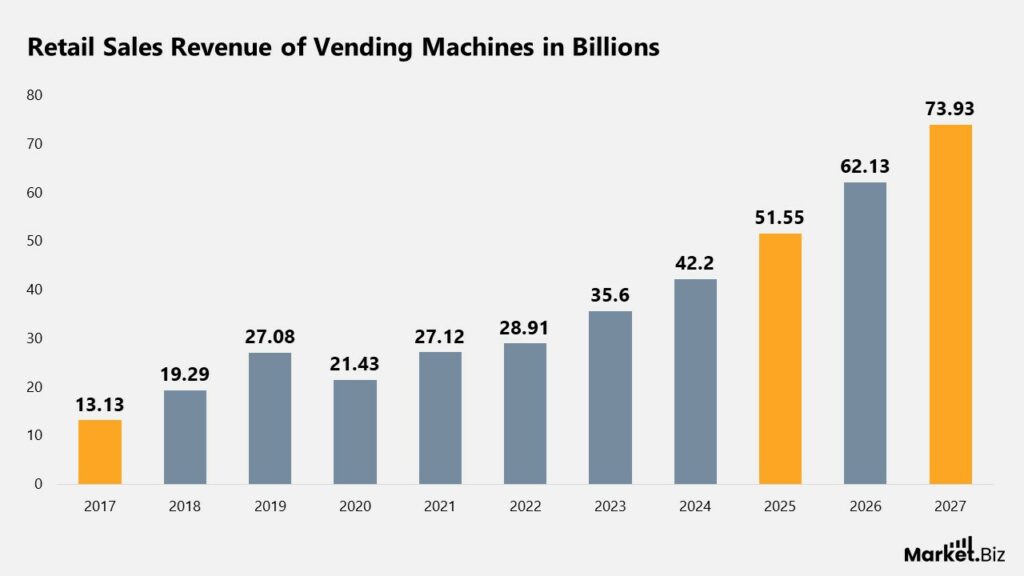
- In 2017, the market achieved sales of 13.13 billion yuan, which rose to 19.29 billion yuan in 2018.
- This upward trend continued, reaching 27.08 billion yuan in 2019.
- Nevertheless, 2020 experienced a downturn to 21.43 billion yuan, likely attributable to the effects of the COVID-19 pandemic.
- The market recovered in 2021, recording sales of 27.12 billion yuan, and further increased to 28.91 billion yuan in 2022.
- Future growth projections are strong, with expected sales of 35.6 billion yuan in 2023, 42.2 billion yuan in 2024, and 51.55 billion yuan in 2025.
- The upward trajectory is anticipated to persist. With estimates of 62.13 billion yuan in 2026 and 73.93 billion yuan by 2027.
Cost of Calorie Counts on Vending Items
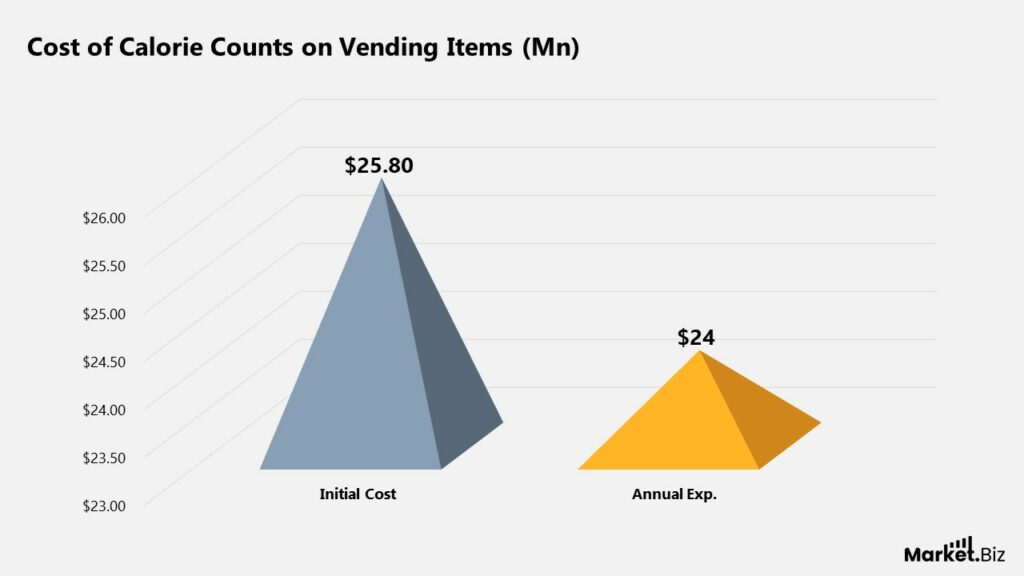
- The requirements for calorie documentation are estimated to impose an initial cost of USD 25.8 million on the vending machine industry, followed by an annual expense of USD 24 million thereafter.
- To offset this cost, it would only require 0.02% of the American population with a Body Mass Index (BMI) of 30 or above to reduce their consumption of vending machine calories by 100 per week.
- The forthcoming vending regulations will affect more than 10,000 American companies that regularly operate 20 or more machines.
- Over 75% of American vending machine businesses employ three or fewer individuals.
- The anticipated average expense for the new documentation requirements is approximately USD 2,400 for each machine.
- A study conducted in 2011 revealed that merely 1 in 6 individuals take the time to read the calorie or ingredient information that may be present on a label.
Consumer Behavior on Vending Machines
- The typical vending machine earns approximately USD 76 each week.
- The products most frequently sold in vending machines consist of snacks, drinks, and candy.
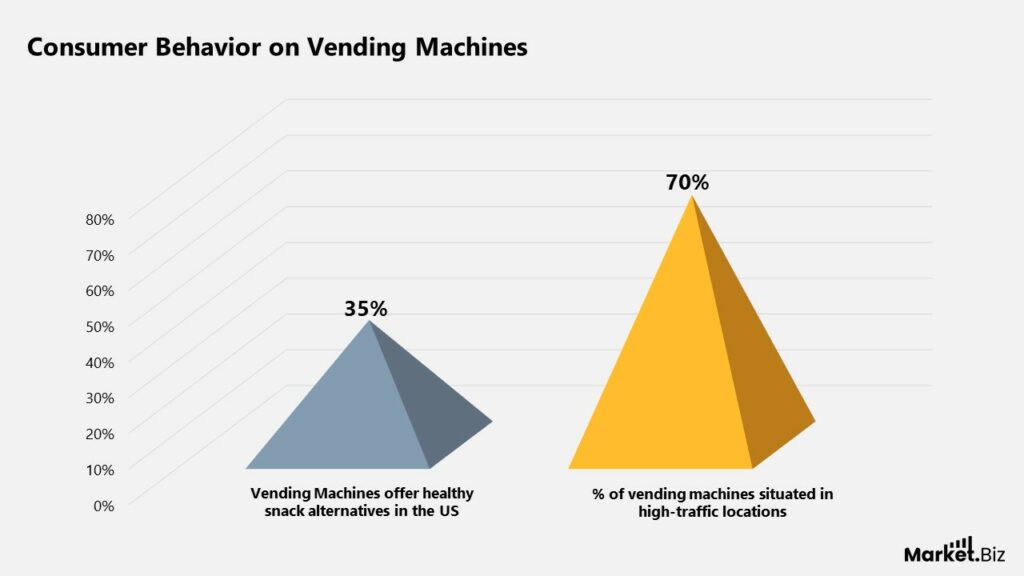
- Currently, 35% of vending machines in the United States offer healthy snack alternatives.
- Almost 70% of vending machines are situated in high-traffic locations such as shopping malls, airports, and office complexes.
- The utilization of vending machines is notably high among Generation Z and Millennials, which is contributing to the growth of the industry.
- It is anticipated that the market share for healthy snacks in vending machines will reach 25% by the year 2025.
- The average range of products available in a vending machine varies from 10 to 40, depending on its size and location.
- The most sought-after snacks in vending machines include chips, chocolates, and energy bars.
- More than 90% of vending machines in Japan are equipped to accept cashless payments.
- The average expenditure per transaction in vending machines is roughly USD 2.50.
- The trend of adopting biodegradable packaging in vending machines is on the rise, in line with sustainability objectives.
- The growth of the industry is partially fueled by increasing urbanization globally. Resulting in a greater demand for quick and convenient food options.
- The convenience of cashless and contactless transactions plays a crucial role in consumer preferences, significantly impacting industry sales.
Technological Advancements in Vending Machines
- An estimated 84% of vending machine operators utilize some form of electronic payment technology.
- The vending machine sector is progressively embracing IoT technology for inventory management.
- The launch of smart vending machines has led to a sales increase of up to 20%.
- Approximately 55% of vending machines across North America are outfitted with telemetry systems.
- The focus of innovation within the vending machine industry is increasingly directed towards sustainability, including energy-efficient models.
- More than 80% of vending machine transactions are now conducted through digital payment methods.
- The vending machine sector in South Korea is undergoing rapid innovation with the introduction of robotic vending machines.
- Vending machines equipped with contactless payment systems have experienced a 30% year-over-year increase in sales.
- The vending machine industry is placing greater emphasis on eco-friendly refrigerants to minimize carbon footprints.
- The integration of AI in vending machines for customer personalization is on the rise, with over 25% of new machines incorporating AI features.
- As of 2023, the vending machine industry has a project pipeline that includes over 5,000 new machine models currently in development.
- Facial recognition technology is beginning to be incorporated into advanced vending machines to enhance personalized experiences.
- Vending machines that feature adjustable pricing based on demand are being tested in select markets to optimize revenue.
- The average energy consumption of contemporary vending machines has been reduced by 30% due to enhanced efficiency standards.
- The vending industry is investigating automation and robotics for maintenance and restocking tasks to boost efficiency.
Recent Developments
- In December 2024, Cantaloupe, a provider of self-service commerce technology, introduced smart stores as a groundbreaking alternative to conventional vending machines. These self-service solutions, available 24/7, are tailored for retailers, fitness centers, residential complexes, and hotel pantries. The system functions through a straightforward process where customers present payment at the point of sale to unlock the unit, choose their items, and finalize their purchase by selecting ‘Pay.’
- In December 2024, SECO entered into an 11-year partnership with BDTA to modernize the tobacco vending machines in Germany. This collaboration aims to connect over 200,000 machines utilizing SECO’s AI and IoT-enabled Clea Vend, which will facilitate predictive sales management, remote monitoring, maintenance, and cashless payments with age verification. Additionally, SECO will oversee server management and guarantee high service availability, thereby improving efficiency and enhancing the customer experience within the tobacco vending industry.
Conclusion
Vending Machine Statistics: In conclusion, vending machines signify a rapidly growing segment within the retail industry. Fueled by technological progress and evolving consumer preferences for convenient, portable solutions. The expansion of the market is driven by elements like the rising use of cashless payments and an expanding range of products.
As we look ahead, there are numerous opportunities for growth, especially through innovation in product offerings and the incorporation of data analytics. Nevertheless, stakeholders need to stay alert to challenges such as regulatory compliance and increased competition.
FAQs
A strategically positioned, adequately stocked vending machine in a busy area can generate gross revenue of USD 300-600 per month. Once the cost of goods sold (COGS) and other operating expenses are deducted. The net profit may range from USD 100 to USD 300 per machine per month.
The retail vending machine sector in the United States exhibits significant growth and market leadership. With more than 7 million machines installed nationwide, serving approximately 100 million Americans daily.
Optimal locations for vending machines include high-traffic environments such as schools, hospitals, airports, and large office complexes. These sites experience consistent daily foot traffic and longer dwell times, resulting in higher sales than locations with lower traffic.